Air Pollution in Nanchang: Real-time Air Quality Index and smog alert.
Pollution and air quality forecast for Nanchang. Today is Tuesday, June 2, 2026. The following air pollution values have been recorded for Nanchang:- particulate matter (PM10) suspended dust - 179 (Very bad Hazardous)
- particulate matter (PM2.5) dust - 35 (Unhealthy for Sensitive Groups)
- ozone (O3) - 0 (Good)
- nitrogen dioxide (NO2) - 0 (Good)
- sulfur dioxide (SO2) - 0 (Good)

What is the air quality in Nanchang today? Is the air polluted in Nanchang?. Is there smog?
What is the level of PM10 today in Nanchang? (particulate matter (PM10) suspended dust)
The current level of particulate matter PM10 in Nanchang is:
179 (Very bad Hazardous)
The highest PM10 values usually occur in month: 104 (November 2019).
The lowest value of particulate matter PM10 pollution in Nanchang is usually recorded in: August (31).
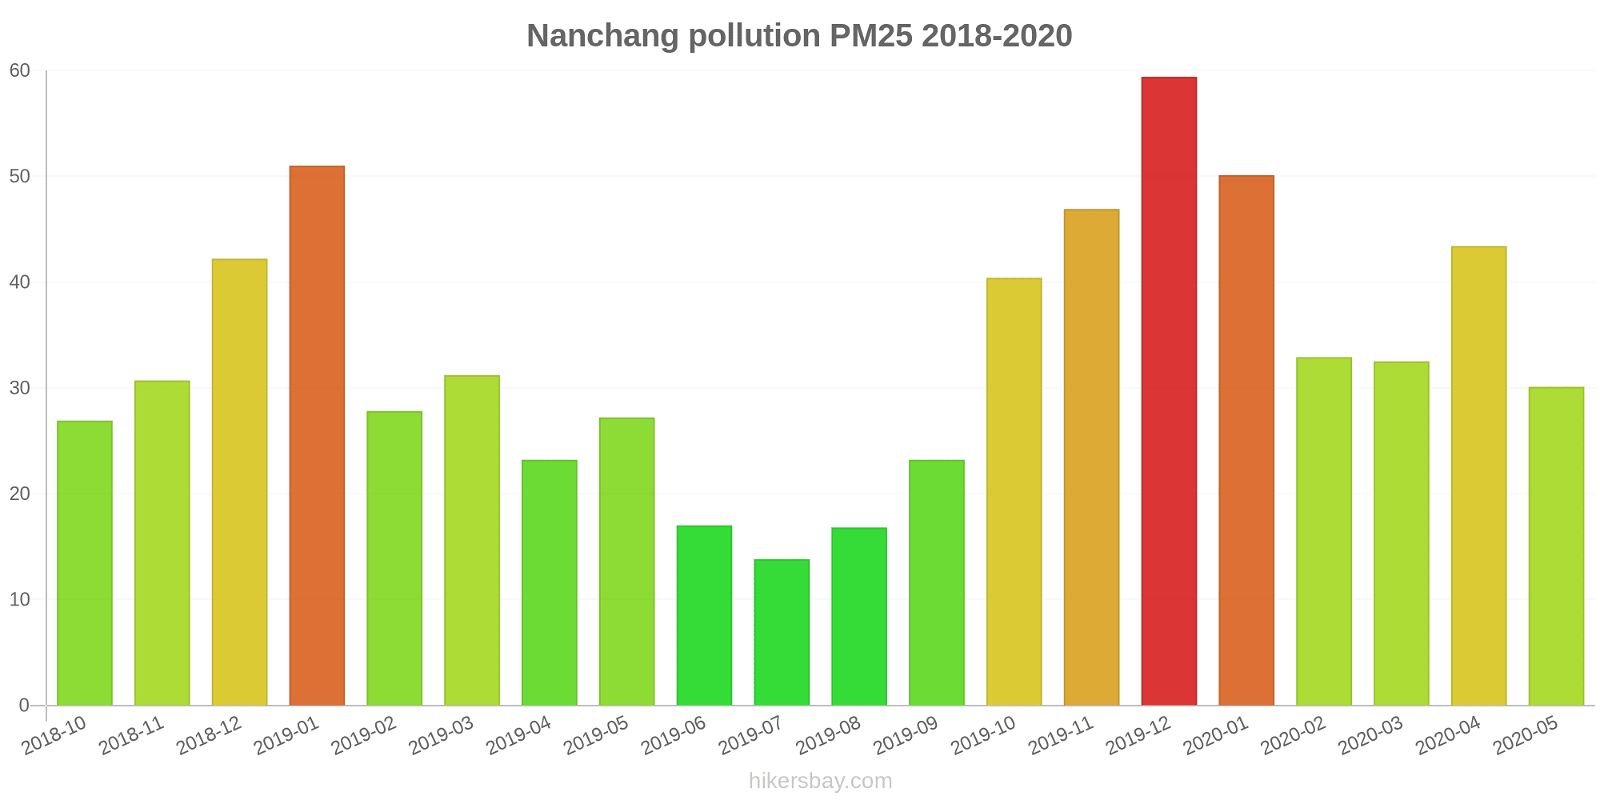
What is the current level of PM2.5 in Nanchang? (particulate matter (PM2.5) dust)
Today's PM2.5 level is:
35 (Unhealthy for Sensitive Groups)
For comparison, the highest level of PM2.5 in Nanchang in the last 7 days was: 56 (Friday, May 27, 2022) and the lowest: 56 (Friday, May 27, 2022).
The highest PM2.5 values were recorded: 59 (December 2019).
The lowest level of particulate matter PM2.5 pollution occurs in month: July (14).
How is the O3 level today in Nanchang? (ozone (O3))
0 (Good)
How high is the level of NO2? (nitrogen dioxide (NO2))
0 (Good)
What is the level of SO2 pollution? (sulfur dioxide (SO2))
0 (Good)
Current data Friday, May 27, 2022, 12:00 PM
PM10 179 (Very bad Hazardous)
PM2,5 35 (Unhealthy for Sensitive Groups)
O3 0 (Good)
NO2 0 (Good)
SO2 0 (Good)
Data on air pollution from recent days in Nanchang
index
2022-05-27
pm10
56
Unhealthy for Sensitive Groups
pm25
56
Unhealthy
o3
0
Good
no2
0
Good
so2
0
Good
data source »
Air pollution in Nanchang from October 2018 to May 2020
index
2020-05
2020-04
2020-03
2020-02
2020-01
2019-12
2019-11
2019-10
2019-09
2019-08
2019-07
2019-06
2019-05
2019-04
2019-03
2019-02
2019-01
2018-12
2018-11
2018-10
pm25
30 (Moderate)
43 (Unhealthy for Sensitive Groups)
33 (Moderate)
33 (Moderate)
50 (Unhealthy for Sensitive Groups)
59 (Unhealthy)
47 (Unhealthy for Sensitive Groups)
40 (Unhealthy for Sensitive Groups)
23 (Moderate)
17 (Moderate)
14 (Moderate)
17 (Moderate)
27 (Moderate)
23 (Moderate)
31 (Moderate)
28 (Moderate)
51 (Unhealthy for Sensitive Groups)
42 (Unhealthy for Sensitive Groups)
31 (Moderate)
27 (Moderate)
co
616 (Good)
643 (Good)
664 (Good)
644 (Good)
902 (Good)
1 (Good)
863 (Good)
834 (Good)
788 (Good)
552 (Good)
641 (Good)
708 (Good)
935 (Good)
925 (Good)
858 (Good)
1 (Good)
1 (Good)
1 (Good)
941 (Good)
1 (Good)
no2
24 (Good)
46 (Moderate)
32 (Good)
19 (Good)
30 (Good)
53 (Moderate)
47 (Moderate)
37 (Good)
24 (Good)
26 (Good)
29 (Good)
26 (Good)
35 (Good)
37 (Good)
44 (Moderate)
28 (Good)
44 (Moderate)
33 (Good)
33 (Good)
37 (Good)
o3
127 (Unhealthy for Sensitive Groups)
147 (Unhealthy for Sensitive Groups)
92 (Moderate)
89 (Moderate)
61 (Good)
74 (Moderate)
117 (Moderate)
139 (Unhealthy for Sensitive Groups)
175 (Unhealthy)
154 (Unhealthy)
124 (Unhealthy for Sensitive Groups)
133 (Unhealthy for Sensitive Groups)
144 (Unhealthy for Sensitive Groups)
112 (Moderate)
102 (Moderate)
52 (Good)
62 (Good)
46 (Good)
70 (Good)
101 (Moderate)
pm10
59 (Unhealthy for Sensitive Groups)
91 (Unhealthy)
64 (Unhealthy for Sensitive Groups)
50 (Moderate)
64 (Unhealthy for Sensitive Groups)
94 (Unhealthy)
104 (Unhealthy)
90 (Unhealthy)
56 (Unhealthy for Sensitive Groups)
31 (Moderate)
36 (Moderate)
49 (Moderate)
77 (Unhealthy for Sensitive Groups)
41 (Moderate)
54 (Unhealthy for Sensitive Groups)
33 (Moderate)
68 (Unhealthy for Sensitive Groups)
61 (Unhealthy for Sensitive Groups)
67 (Unhealthy for Sensitive Groups)
83 (Unhealthy)
so2
11 (Good)
13 (Good)
9.8 (Good)
7.2 (Good)
6.6 (Good)
12 (Good)
14 (Good)
10 (Good)
8.2 (Good)
9.6 (Good)
8.4 (Good)
8.2 (Good)
10 (Good)
9.1 (Good)
8.2 (Good)
5.2 (Good)
8.3 (Good)
9.6 (Good)
9.2 (Good)
11 (Good)
data source »
建工学校
Friday, May 27, 2022, 12:00 PM
PM10 179 (Very bad Hazardous)
particulate matter (PM10) suspended dust
PM2,5 35 (Unhealthy for Sensitive Groups)
particulate matter (PM2.5) dust
O3 0.04 (Good)
ozone (O3)
NO2 0 (Good)
nitrogen dioxide (NO2)
SO2 0 (Good)
sulfur dioxide (SO2)
建工学校
index
2022-05-27
pm10
56
pm25
56
o3
0.03
no2
0
so2
0
建工学校
2018-10 2020-05

index
2020-05
2020-04
2020-03
2020-02
2020-01
2019-12
2019-11
2019-10
2019-09
2019-08
2019-07
2019-06
2019-05
2019-04
2019-03
2019-02
2019-01
2018-12
2018-11
2018-10
pm25
30
43
33
33
50
59
47
40
23
17
14
17
27
23
31
28
51
42
31
27
co
616
643
664
644
902
1
863
834
788
552
641
708
935
925
858
1
1
1
941
1
no2
24
46
32
19
30
53
47
37
24
26
29
26
35
37
44
28
44
33
33
37
o3
127
147
92
89
61
74
117
139
175
154
124
133
144
112
102
52
62
46
70
101
pm10
59
91
64
50
64
94
104
90
56
31
36
49
77
41
54
33
68
61
67
83
so2
11
13
9.8
7.2
6.6
12
14
10
8.2
9.6
8.4
8.2
10
9.1
8.2
5.2
8.3
9.6
9.2
11
* Pollution data source:
https://openaq.org
(ChinaAQIData)
The data is licensed under CC-By 4.0
PM10 179 (Very bad Hazardous)
PM2,5 35 (Unhealthy for Sensitive Groups)
O3 0 (Good)
NO2 0 (Good)
SO2 0 (Good)
Data on air pollution from recent days in Nanchang
| index | 2022-05-27 |
|---|---|
| pm10 | 56 Unhealthy for Sensitive Groups |
| pm25 | 56 Unhealthy |
| o3 | 0 Good |
| no2 | 0 Good |
| so2 | 0 Good |

| index | 2020-05 | 2020-04 | 2020-03 | 2020-02 | 2020-01 | 2019-12 | 2019-11 | 2019-10 | 2019-09 | 2019-08 | 2019-07 | 2019-06 | 2019-05 | 2019-04 | 2019-03 | 2019-02 | 2019-01 | 2018-12 | 2018-11 | 2018-10 |
|---|---|---|---|---|---|---|---|---|---|---|---|---|---|---|---|---|---|---|---|---|
| pm25 | 30 (Moderate) | 43 (Unhealthy for Sensitive Groups) | 33 (Moderate) | 33 (Moderate) | 50 (Unhealthy for Sensitive Groups) | 59 (Unhealthy) | 47 (Unhealthy for Sensitive Groups) | 40 (Unhealthy for Sensitive Groups) | 23 (Moderate) | 17 (Moderate) | 14 (Moderate) | 17 (Moderate) | 27 (Moderate) | 23 (Moderate) | 31 (Moderate) | 28 (Moderate) | 51 (Unhealthy for Sensitive Groups) | 42 (Unhealthy for Sensitive Groups) | 31 (Moderate) | 27 (Moderate) |
| co | 616 (Good) | 643 (Good) | 664 (Good) | 644 (Good) | 902 (Good) | 1 (Good) | 863 (Good) | 834 (Good) | 788 (Good) | 552 (Good) | 641 (Good) | 708 (Good) | 935 (Good) | 925 (Good) | 858 (Good) | 1 (Good) | 1 (Good) | 1 (Good) | 941 (Good) | 1 (Good) |
| no2 | 24 (Good) | 46 (Moderate) | 32 (Good) | 19 (Good) | 30 (Good) | 53 (Moderate) | 47 (Moderate) | 37 (Good) | 24 (Good) | 26 (Good) | 29 (Good) | 26 (Good) | 35 (Good) | 37 (Good) | 44 (Moderate) | 28 (Good) | 44 (Moderate) | 33 (Good) | 33 (Good) | 37 (Good) |
| o3 | 127 (Unhealthy for Sensitive Groups) | 147 (Unhealthy for Sensitive Groups) | 92 (Moderate) | 89 (Moderate) | 61 (Good) | 74 (Moderate) | 117 (Moderate) | 139 (Unhealthy for Sensitive Groups) | 175 (Unhealthy) | 154 (Unhealthy) | 124 (Unhealthy for Sensitive Groups) | 133 (Unhealthy for Sensitive Groups) | 144 (Unhealthy for Sensitive Groups) | 112 (Moderate) | 102 (Moderate) | 52 (Good) | 62 (Good) | 46 (Good) | 70 (Good) | 101 (Moderate) |
| pm10 | 59 (Unhealthy for Sensitive Groups) | 91 (Unhealthy) | 64 (Unhealthy for Sensitive Groups) | 50 (Moderate) | 64 (Unhealthy for Sensitive Groups) | 94 (Unhealthy) | 104 (Unhealthy) | 90 (Unhealthy) | 56 (Unhealthy for Sensitive Groups) | 31 (Moderate) | 36 (Moderate) | 49 (Moderate) | 77 (Unhealthy for Sensitive Groups) | 41 (Moderate) | 54 (Unhealthy for Sensitive Groups) | 33 (Moderate) | 68 (Unhealthy for Sensitive Groups) | 61 (Unhealthy for Sensitive Groups) | 67 (Unhealthy for Sensitive Groups) | 83 (Unhealthy) |
| so2 | 11 (Good) | 13 (Good) | 9.8 (Good) | 7.2 (Good) | 6.6 (Good) | 12 (Good) | 14 (Good) | 10 (Good) | 8.2 (Good) | 9.6 (Good) | 8.4 (Good) | 8.2 (Good) | 10 (Good) | 9.1 (Good) | 8.2 (Good) | 5.2 (Good) | 8.3 (Good) | 9.6 (Good) | 9.2 (Good) | 11 (Good) |
PM10 179 (Very bad Hazardous)
particulate matter (PM10) suspended dustPM2,5 35 (Unhealthy for Sensitive Groups)
particulate matter (PM2.5) dustO3 0.04 (Good)
ozone (O3)NO2 0 (Good)
nitrogen dioxide (NO2)SO2 0 (Good)
sulfur dioxide (SO2)建工学校
| index | 2022-05-27 |
|---|---|
| pm10 | 56 |
| pm25 | 56 |
| o3 | 0.03 |
| no2 | 0 |
| so2 | 0 |
建工学校

| index | 2020-05 | 2020-04 | 2020-03 | 2020-02 | 2020-01 | 2019-12 | 2019-11 | 2019-10 | 2019-09 | 2019-08 | 2019-07 | 2019-06 | 2019-05 | 2019-04 | 2019-03 | 2019-02 | 2019-01 | 2018-12 | 2018-11 | 2018-10 |
|---|---|---|---|---|---|---|---|---|---|---|---|---|---|---|---|---|---|---|---|---|
| pm25 | 30 | 43 | 33 | 33 | 50 | 59 | 47 | 40 | 23 | 17 | 14 | 17 | 27 | 23 | 31 | 28 | 51 | 42 | 31 | 27 |
| co | 616 | 643 | 664 | 644 | 902 | 1 | 863 | 834 | 788 | 552 | 641 | 708 | 935 | 925 | 858 | 1 | 1 | 1 | 941 | 1 |
| no2 | 24 | 46 | 32 | 19 | 30 | 53 | 47 | 37 | 24 | 26 | 29 | 26 | 35 | 37 | 44 | 28 | 44 | 33 | 33 | 37 |
| o3 | 127 | 147 | 92 | 89 | 61 | 74 | 117 | 139 | 175 | 154 | 124 | 133 | 144 | 112 | 102 | 52 | 62 | 46 | 70 | 101 |
| pm10 | 59 | 91 | 64 | 50 | 64 | 94 | 104 | 90 | 56 | 31 | 36 | 49 | 77 | 41 | 54 | 33 | 68 | 61 | 67 | 83 |
| so2 | 11 | 13 | 9.8 | 7.2 | 6.6 | 12 | 14 | 10 | 8.2 | 9.6 | 8.4 | 8.2 | 10 | 9.1 | 8.2 | 5.2 | 8.3 | 9.6 | 9.2 | 11 |