Air Pollution in Neijiang Shi: Real-time Air Quality Index and smog alert.
Pollution and air quality forecast for Neijiang Shi. Today is Tuesday, June 16, 2026. The following air pollution values have been recorded for Neijiang Shi:- particulate matter (PM2.5) dust - 61 (Unhealthy)
- nitrogen dioxide (NO2) - 22 (Good)
- particulate matter (PM10) suspended dust - 69 (Unhealthy for Sensitive Groups)
- carbon monoxide (CO) - 219 (Good)
- ozone (O3) - 0 (Good)
- sulfur dioxide (SO2) - 8 (Good)

What is the air quality in Neijiang Shi today? Is the air polluted in Neijiang Shi?. Is there smog?
What is the current level of PM2.5 in Neijiang Shi? (particulate matter (PM2.5) dust)
Today's PM2.5 level is:
61 (Unhealthy)
For comparison, the highest level of PM2.5 in Neijiang Shi in the last 7 days was: 28 (Friday, May 27, 2022) and the lowest: 28 (Friday, May 27, 2022).
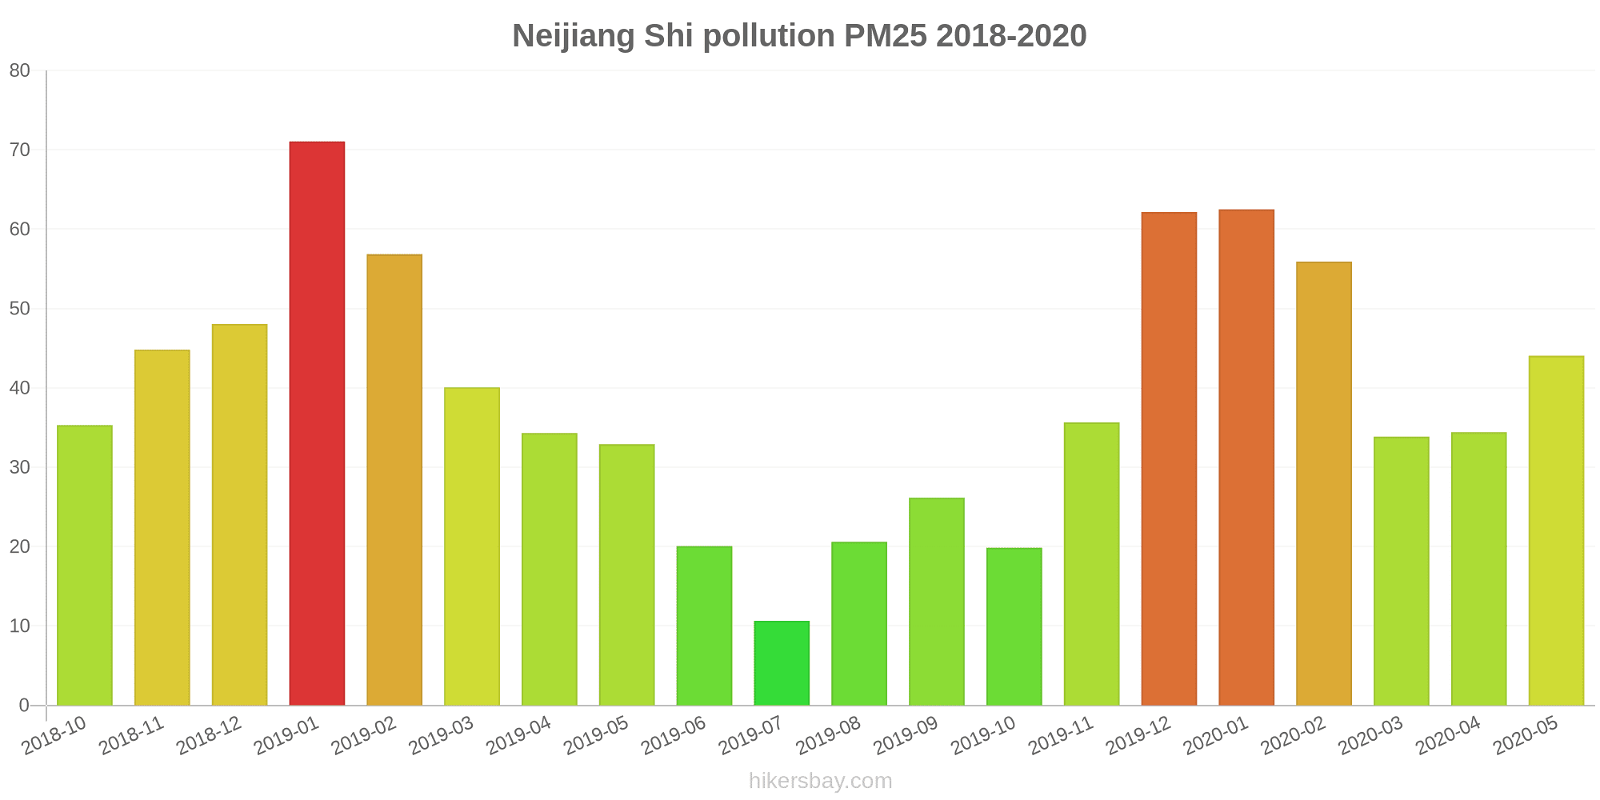
The highest PM2.5 values were recorded: 71 (January 2019).
The lowest level of particulate matter PM2.5 pollution occurs in month: July (11).
How high is the level of NO2? (nitrogen dioxide (NO2))
22 (Good)
What is the level of PM10 today in Neijiang Shi? (particulate matter (PM10) suspended dust)
The current level of particulate matter PM10 in Neijiang Shi is:
69 (Unhealthy for Sensitive Groups)
The highest PM10 values usually occur in month: 89 (January 2019).
The lowest value of particulate matter PM10 pollution in Neijiang Shi is usually recorded in: July (20).
How high is the CO level? (carbon monoxide (CO))
219 (Good)
How is the O3 level today in Neijiang Shi? (ozone (O3))
0 (Good)
What is the level of SO2 pollution? (sulfur dioxide (SO2))
8 (Good)
Current data Friday, May 27, 2022, 3:00 PM
PM2,5 61 (Unhealthy)
NO2 22 (Good)
PM10 69 (Unhealthy for Sensitive Groups)
CO 219 (Good)
O3 0 (Good)
SO2 8 (Good)
Data on air pollution from recent days in Neijiang Shi
index
2022-05-27
pm25
28
Moderate
no2
22
Good
pm10
35
Moderate
co
579
Good
o3
22
Good
so2
5
Good
data source »
Air pollution in Neijiang Shi from October 2018 to May 2020
index
2020-05
2020-04
2020-03
2020-02
2020-01
2019-12
2019-11
2019-10
2019-09
2019-08
2019-07
2019-06
2019-05
2019-04
2019-03
2019-02
2019-01
2018-12
2018-11
2018-10
pm25
44 (Unhealthy for Sensitive Groups)
34 (Moderate)
34 (Moderate)
56 (Unhealthy)
63 (Unhealthy)
62 (Unhealthy)
36 (Unhealthy for Sensitive Groups)
20 (Moderate)
26 (Moderate)
21 (Moderate)
11 (Good)
20 (Moderate)
33 (Moderate)
34 (Moderate)
40 (Unhealthy for Sensitive Groups)
57 (Unhealthy)
71 (Unhealthy)
48 (Unhealthy for Sensitive Groups)
45 (Unhealthy for Sensitive Groups)
35 (Unhealthy for Sensitive Groups)
co
685 (Good)
618 (Good)
660 (Good)
727 (Good)
1 (Good)
949 (Good)
646 (Good)
548 (Good)
568 (Good)
562 (Good)
558 (Good)
551 (Good)
508 (Good)
602 (Good)
791 (Good)
1 (Good)
1 (Good)
868 (Good)
786 (Good)
945 (Good)
no2
18 (Good)
18 (Good)
16 (Good)
12 (Good)
24 (Good)
35 (Good)
28 (Good)
19 (Good)
20 (Good)
18 (Good)
16 (Good)
17 (Good)
17 (Good)
23 (Good)
33 (Good)
30 (Good)
40 (Moderate)
32 (Good)
28 (Good)
27 (Good)
o3
167 (Unhealthy)
124 (Unhealthy for Sensitive Groups)
119 (Moderate)
84 (Moderate)
69 (Good)
63 (Good)
58 (Good)
81 (Moderate)
110 (Moderate)
149 (Unhealthy for Sensitive Groups)
102 (Moderate)
111 (Moderate)
104 (Moderate)
132 (Unhealthy for Sensitive Groups)
98 (Moderate)
75 (Moderate)
64 (Good)
41 (Good)
76 (Moderate)
75 (Moderate)
pm10
66 (Unhealthy for Sensitive Groups)
50 (Unhealthy for Sensitive Groups)
56 (Unhealthy for Sensitive Groups)
71 (Unhealthy for Sensitive Groups)
77 (Unhealthy for Sensitive Groups)
80 (Unhealthy for Sensitive Groups)
55 (Unhealthy for Sensitive Groups)
31 (Moderate)
41 (Moderate)
37 (Moderate)
20 (Moderate)
31 (Moderate)
51 (Unhealthy for Sensitive Groups)
52 (Unhealthy for Sensitive Groups)
57 (Unhealthy for Sensitive Groups)
71 (Unhealthy for Sensitive Groups)
89 (Unhealthy)
69 (Unhealthy for Sensitive Groups)
60 (Unhealthy for Sensitive Groups)
51 (Unhealthy for Sensitive Groups)
so2
12 (Good)
9 (Good)
9.5 (Good)
5.9 (Good)
6.3 (Good)
7 (Good)
7 (Good)
5.2 (Good)
7 (Good)
8.1 (Good)
4.2 (Good)
4.8 (Good)
4.4 (Good)
6.8 (Good)
9.8 (Good)
7.6 (Good)
8.5 (Good)
8.6 (Good)
6.6 (Good)
6.4 (Good)
data source »
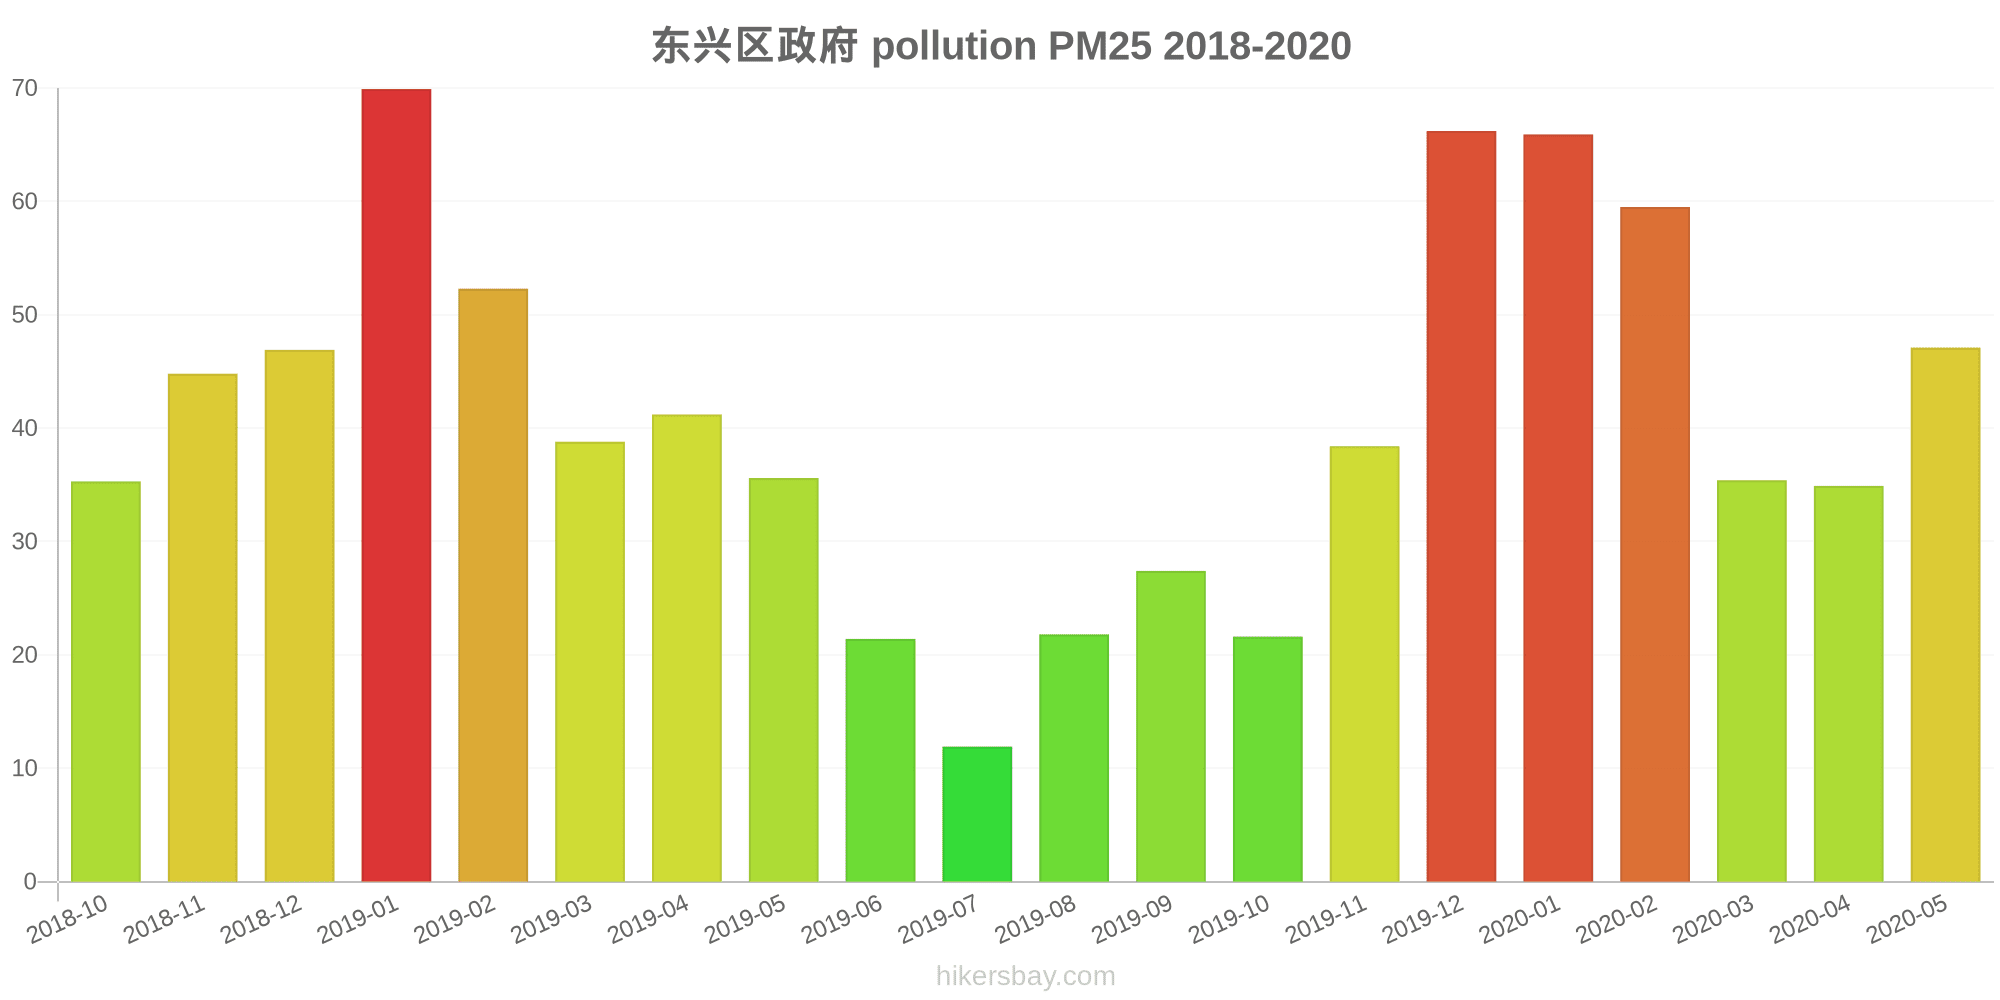
东兴区政府
Friday, May 27, 2022, 3:00 PM
PM2,5 61 (Unhealthy)
particulate matter (PM2.5) dust
NO2 22 (Good)
nitrogen dioxide (NO2)
PM10 69 (Unhealthy for Sensitive Groups)
particulate matter (PM10) suspended dust
CO 219 (Good)
carbon monoxide (CO)
O3 0.05 (Good)
ozone (O3)
SO2 7.7 (Good)
sulfur dioxide (SO2)
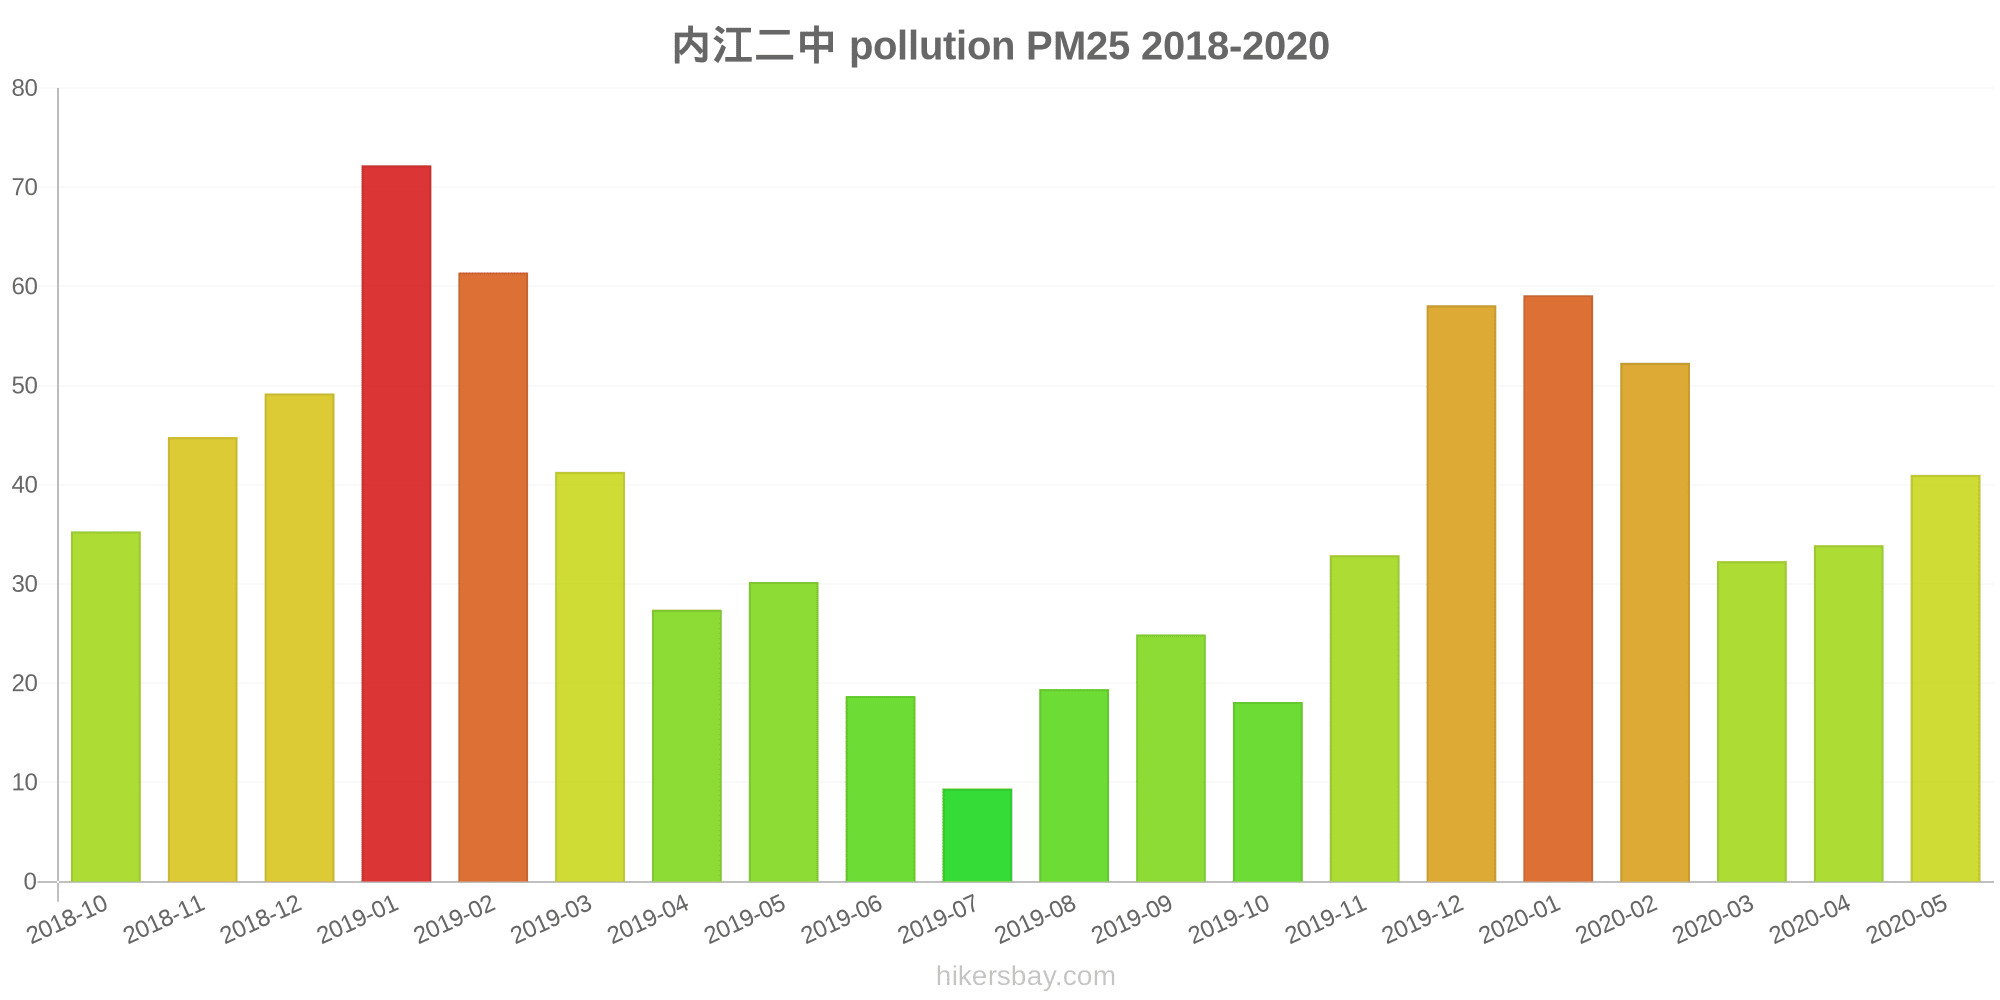
内江二中
Friday, May 27, 2022, 3:00 PM
PM2,5 61 (Unhealthy)
particulate matter (PM2.5) dust
NO2 22 (Good)
nitrogen dioxide (NO2)
PM10 69 (Unhealthy for Sensitive Groups)
particulate matter (PM10) suspended dust
CO 219 (Good)
carbon monoxide (CO)
O3 0.05 (Good)
ozone (O3)
SO2 7.7 (Good)
sulfur dioxide (SO2)
东兴区政府
index
2022-05-27
pm25
28
no2
22
pm10
35
co
579
o3
22
so2
4.6
内江二中
index
2022-05-27
pm25
28
no2
22
pm10
35
co
579
o3
22
so2
4.6
东兴区政府
2018-10 2020-05

index
2020-05
2020-04
2020-03
2020-02
2020-01
2019-12
2019-11
2019-10
2019-09
2019-08
2019-07
2019-06
2019-05
2019-04
2019-03
2019-02
2019-01
2018-12
2018-11
2018-10
pm25
47
35
35
60
66
66
38
22
27
22
12
21
36
41
39
52
70
47
45
35
co
592
584
705
731
1
997
624
547
534
537
549
511
443
584
784
1
1
756
760
948
no2
16
17
15
11
23
34
26
16
18
17
15
16
15
21
30
27
40
29
29
29
o3
168
127
120
85
70
65
59
82
109
145
93
106
100
125
96
74
64
43
77
75
pm10
69
48
54
72
80
83
57
30
38
34
19
29
51
55
59
73
94
68
60
50
so2
11
11
10
6.5
5.9
7
7.2
5.7
5.8
7
4
4.3
3.8
6.4
9.3
5.9
7.7
11
8.2
7.3
内江二中
2018-10 2020-05

index
2020-05
2020-04
2020-03
2020-02
2020-01
2019-12
2019-11
2019-10
2019-09
2019-08
2019-07
2019-06
2019-05
2019-04
2019-03
2019-02
2019-01
2018-12
2018-11
2018-10
pm25
41
34
32
52
59
58
33
18
25
19
9.4
19
30
27
41
61
72
49
45
35
co
778
652
615
722
1
900
667
548
602
587
566
590
572
620
798
1
1
979
812
941
no2
20
19
17
13
26
36
29
21
21
20
17
18
20
24
36
34
41
34
28
25
o3
165
121
117
83
69
61
56
81
110
152
111
116
109
139
99
76
63
39
75
75
pm10
64
53
59
70
74
77
53
32
44
39
22
32
51
48
56
70
84
70
61
52
so2
12
6.6
8.8
5.4
6.7
7.1
6.8
4.8
8.2
9.2
4.4
5.3
5
7.2
10
9.4
9.2
6.6
5.1
5.4
* Pollution data source:
https://openaq.org
(ChinaAQIData)
The data is licensed under CC-By 4.0
PM2,5 61 (Unhealthy)
NO2 22 (Good)
PM10 69 (Unhealthy for Sensitive Groups)
CO 219 (Good)
O3 0 (Good)
SO2 8 (Good)
Data on air pollution from recent days in Neijiang Shi
| index | 2022-05-27 |
|---|---|
| pm25 | 28 Moderate |
| no2 | 22 Good |
| pm10 | 35 Moderate |
| co | 579 Good |
| o3 | 22 Good |
| so2 | 5 Good |

| index | 2020-05 | 2020-04 | 2020-03 | 2020-02 | 2020-01 | 2019-12 | 2019-11 | 2019-10 | 2019-09 | 2019-08 | 2019-07 | 2019-06 | 2019-05 | 2019-04 | 2019-03 | 2019-02 | 2019-01 | 2018-12 | 2018-11 | 2018-10 |
|---|---|---|---|---|---|---|---|---|---|---|---|---|---|---|---|---|---|---|---|---|
| pm25 | 44 (Unhealthy for Sensitive Groups) | 34 (Moderate) | 34 (Moderate) | 56 (Unhealthy) | 63 (Unhealthy) | 62 (Unhealthy) | 36 (Unhealthy for Sensitive Groups) | 20 (Moderate) | 26 (Moderate) | 21 (Moderate) | 11 (Good) | 20 (Moderate) | 33 (Moderate) | 34 (Moderate) | 40 (Unhealthy for Sensitive Groups) | 57 (Unhealthy) | 71 (Unhealthy) | 48 (Unhealthy for Sensitive Groups) | 45 (Unhealthy for Sensitive Groups) | 35 (Unhealthy for Sensitive Groups) |
| co | 685 (Good) | 618 (Good) | 660 (Good) | 727 (Good) | 1 (Good) | 949 (Good) | 646 (Good) | 548 (Good) | 568 (Good) | 562 (Good) | 558 (Good) | 551 (Good) | 508 (Good) | 602 (Good) | 791 (Good) | 1 (Good) | 1 (Good) | 868 (Good) | 786 (Good) | 945 (Good) |
| no2 | 18 (Good) | 18 (Good) | 16 (Good) | 12 (Good) | 24 (Good) | 35 (Good) | 28 (Good) | 19 (Good) | 20 (Good) | 18 (Good) | 16 (Good) | 17 (Good) | 17 (Good) | 23 (Good) | 33 (Good) | 30 (Good) | 40 (Moderate) | 32 (Good) | 28 (Good) | 27 (Good) |
| o3 | 167 (Unhealthy) | 124 (Unhealthy for Sensitive Groups) | 119 (Moderate) | 84 (Moderate) | 69 (Good) | 63 (Good) | 58 (Good) | 81 (Moderate) | 110 (Moderate) | 149 (Unhealthy for Sensitive Groups) | 102 (Moderate) | 111 (Moderate) | 104 (Moderate) | 132 (Unhealthy for Sensitive Groups) | 98 (Moderate) | 75 (Moderate) | 64 (Good) | 41 (Good) | 76 (Moderate) | 75 (Moderate) |
| pm10 | 66 (Unhealthy for Sensitive Groups) | 50 (Unhealthy for Sensitive Groups) | 56 (Unhealthy for Sensitive Groups) | 71 (Unhealthy for Sensitive Groups) | 77 (Unhealthy for Sensitive Groups) | 80 (Unhealthy for Sensitive Groups) | 55 (Unhealthy for Sensitive Groups) | 31 (Moderate) | 41 (Moderate) | 37 (Moderate) | 20 (Moderate) | 31 (Moderate) | 51 (Unhealthy for Sensitive Groups) | 52 (Unhealthy for Sensitive Groups) | 57 (Unhealthy for Sensitive Groups) | 71 (Unhealthy for Sensitive Groups) | 89 (Unhealthy) | 69 (Unhealthy for Sensitive Groups) | 60 (Unhealthy for Sensitive Groups) | 51 (Unhealthy for Sensitive Groups) |
| so2 | 12 (Good) | 9 (Good) | 9.5 (Good) | 5.9 (Good) | 6.3 (Good) | 7 (Good) | 7 (Good) | 5.2 (Good) | 7 (Good) | 8.1 (Good) | 4.2 (Good) | 4.8 (Good) | 4.4 (Good) | 6.8 (Good) | 9.8 (Good) | 7.6 (Good) | 8.5 (Good) | 8.6 (Good) | 6.6 (Good) | 6.4 (Good) |
PM2,5 61 (Unhealthy)
particulate matter (PM2.5) dustNO2 22 (Good)
nitrogen dioxide (NO2)PM10 69 (Unhealthy for Sensitive Groups)
particulate matter (PM10) suspended dustCO 219 (Good)
carbon monoxide (CO)O3 0.05 (Good)
ozone (O3)SO2 7.7 (Good)
sulfur dioxide (SO2)PM2,5 61 (Unhealthy)
particulate matter (PM2.5) dustNO2 22 (Good)
nitrogen dioxide (NO2)PM10 69 (Unhealthy for Sensitive Groups)
particulate matter (PM10) suspended dustCO 219 (Good)
carbon monoxide (CO)O3 0.05 (Good)
ozone (O3)SO2 7.7 (Good)
sulfur dioxide (SO2)东兴区政府
| index | 2022-05-27 |
|---|---|
| pm25 | 28 |
| no2 | 22 |
| pm10 | 35 |
| co | 579 |
| o3 | 22 |
| so2 | 4.6 |
内江二中
| index | 2022-05-27 |
|---|---|
| pm25 | 28 |
| no2 | 22 |
| pm10 | 35 |
| co | 579 |
| o3 | 22 |
| so2 | 4.6 |
东兴区政府
| index | 2020-05 | 2020-04 | 2020-03 | 2020-02 | 2020-01 | 2019-12 | 2019-11 | 2019-10 | 2019-09 | 2019-08 | 2019-07 | 2019-06 | 2019-05 | 2019-04 | 2019-03 | 2019-02 | 2019-01 | 2018-12 | 2018-11 | 2018-10 |
|---|---|---|---|---|---|---|---|---|---|---|---|---|---|---|---|---|---|---|---|---|
| pm25 | 47 | 35 | 35 | 60 | 66 | 66 | 38 | 22 | 27 | 22 | 12 | 21 | 36 | 41 | 39 | 52 | 70 | 47 | 45 | 35 |
| co | 592 | 584 | 705 | 731 | 1 | 997 | 624 | 547 | 534 | 537 | 549 | 511 | 443 | 584 | 784 | 1 | 1 | 756 | 760 | 948 |
| no2 | 16 | 17 | 15 | 11 | 23 | 34 | 26 | 16 | 18 | 17 | 15 | 16 | 15 | 21 | 30 | 27 | 40 | 29 | 29 | 29 |
| o3 | 168 | 127 | 120 | 85 | 70 | 65 | 59 | 82 | 109 | 145 | 93 | 106 | 100 | 125 | 96 | 74 | 64 | 43 | 77 | 75 |
| pm10 | 69 | 48 | 54 | 72 | 80 | 83 | 57 | 30 | 38 | 34 | 19 | 29 | 51 | 55 | 59 | 73 | 94 | 68 | 60 | 50 |
| so2 | 11 | 11 | 10 | 6.5 | 5.9 | 7 | 7.2 | 5.7 | 5.8 | 7 | 4 | 4.3 | 3.8 | 6.4 | 9.3 | 5.9 | 7.7 | 11 | 8.2 | 7.3 |
内江二中
| index | 2020-05 | 2020-04 | 2020-03 | 2020-02 | 2020-01 | 2019-12 | 2019-11 | 2019-10 | 2019-09 | 2019-08 | 2019-07 | 2019-06 | 2019-05 | 2019-04 | 2019-03 | 2019-02 | 2019-01 | 2018-12 | 2018-11 | 2018-10 |
|---|---|---|---|---|---|---|---|---|---|---|---|---|---|---|---|---|---|---|---|---|
| pm25 | 41 | 34 | 32 | 52 | 59 | 58 | 33 | 18 | 25 | 19 | 9.4 | 19 | 30 | 27 | 41 | 61 | 72 | 49 | 45 | 35 |
| co | 778 | 652 | 615 | 722 | 1 | 900 | 667 | 548 | 602 | 587 | 566 | 590 | 572 | 620 | 798 | 1 | 1 | 979 | 812 | 941 |
| no2 | 20 | 19 | 17 | 13 | 26 | 36 | 29 | 21 | 21 | 20 | 17 | 18 | 20 | 24 | 36 | 34 | 41 | 34 | 28 | 25 |
| o3 | 165 | 121 | 117 | 83 | 69 | 61 | 56 | 81 | 110 | 152 | 111 | 116 | 109 | 139 | 99 | 76 | 63 | 39 | 75 | 75 |
| pm10 | 64 | 53 | 59 | 70 | 74 | 77 | 53 | 32 | 44 | 39 | 22 | 32 | 51 | 48 | 56 | 70 | 84 | 70 | 61 | 52 |
| so2 | 12 | 6.6 | 8.8 | 5.4 | 6.7 | 7.1 | 6.8 | 4.8 | 8.2 | 9.2 | 4.4 | 5.3 | 5 | 7.2 | 10 | 9.4 | 9.2 | 6.6 | 5.1 | 5.4 |