Air Pollution in Putang: Real-time Air Quality Index and smog alert.
Pollution and air quality forecast for Putang. Today is Tuesday, June 16, 2026. The following air pollution values have been recorded for Putang:- particulate matter (PM10) suspended dust - 179 (Very bad Hazardous)
- particulate matter (PM2.5) dust - 35 (Unhealthy for Sensitive Groups)
- ozone (O3) - 0 (Good)
- nitrogen dioxide (NO2) - 0 (Good)
- sulfur dioxide (SO2) - 0 (Good)

What is the air quality in Putang today? Is the air polluted in Putang?. Is there smog?
What is the level of PM10 today in Putang? (particulate matter (PM10) suspended dust)
The current level of particulate matter PM10 in Putang is:
179 (Very bad Hazardous)
The highest PM10 values usually occur in month: 91 (January 2019).
The lowest value of particulate matter PM10 pollution in Putang is usually recorded in: August (38).
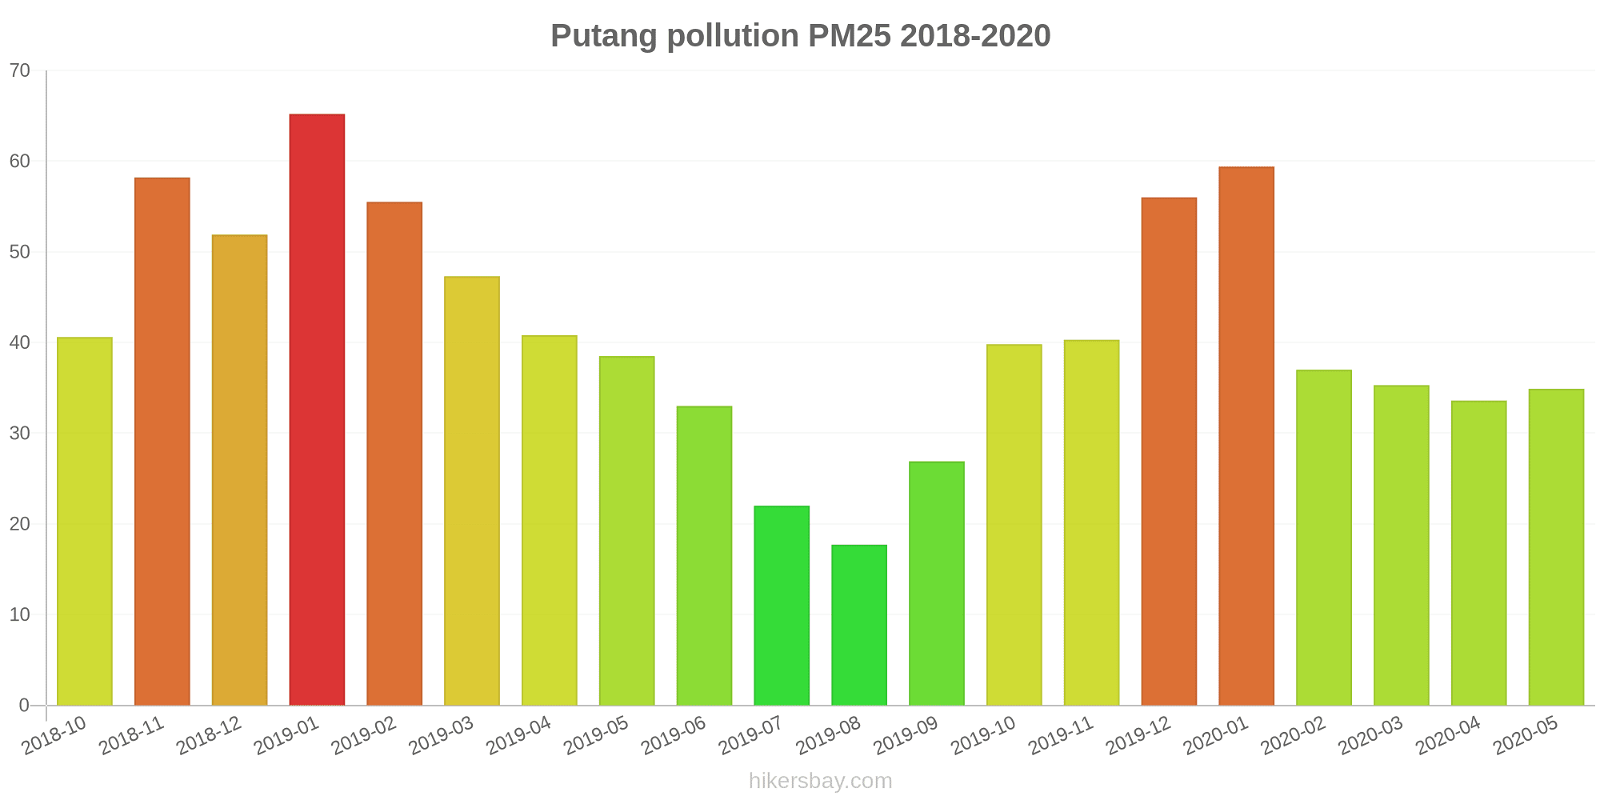
What is the current level of PM2.5 in Putang? (particulate matter (PM2.5) dust)
Today's PM2.5 level is:
35 (Unhealthy for Sensitive Groups)
For comparison, the highest level of PM2.5 in Putang in the last 7 days was: 56 (Friday, May 27, 2022) and the lowest: 56 (Friday, May 27, 2022).
The highest PM2.5 values were recorded: 65 (January 2019).
The lowest level of particulate matter PM2.5 pollution occurs in month: August (18).
How is the O3 level today in Putang? (ozone (O3))
0 (Good)
How high is the level of NO2? (nitrogen dioxide (NO2))
0 (Good)
What is the level of SO2 pollution? (sulfur dioxide (SO2))
0 (Good)
Current data Friday, May 27, 2022, 12:00 PM
PM10 179 (Very bad Hazardous)
PM2,5 35 (Unhealthy for Sensitive Groups)
O3 0 (Good)
NO2 0 (Good)
SO2 0 (Good)
Data on air pollution from recent days in Putang
index
2022-05-27
pm10
56
Unhealthy for Sensitive Groups
pm25
56
Unhealthy
o3
0
Good
no2
0
Good
so2
0
Good
data source »
Air pollution in Putang from October 2018 to May 2020
index
2020-05
2020-04
2020-03
2020-02
2020-01
2019-12
2019-11
2019-10
2019-09
2019-08
2019-07
2019-06
2019-05
2019-04
2019-03
2019-02
2019-01
2018-12
2018-11
2018-10
pm25
35 (Moderate)
34 (Moderate)
35 (Unhealthy for Sensitive Groups)
37 (Unhealthy for Sensitive Groups)
59 (Unhealthy)
56 (Unhealthy)
40 (Unhealthy for Sensitive Groups)
40 (Unhealthy for Sensitive Groups)
27 (Moderate)
18 (Moderate)
22 (Moderate)
33 (Moderate)
39 (Unhealthy for Sensitive Groups)
41 (Unhealthy for Sensitive Groups)
47 (Unhealthy for Sensitive Groups)
56 (Unhealthy)
65 (Unhealthy)
52 (Unhealthy for Sensitive Groups)
58 (Unhealthy)
41 (Unhealthy for Sensitive Groups)
co
584 (Good)
586 (Good)
610 (Good)
590 (Good)
696 (Good)
620 (Good)
482 (Good)
591 (Good)
582 (Good)
573 (Good)
558 (Good)
614 (Good)
620 (Good)
728 (Good)
741 (Good)
785 (Good)
998 (Good)
602 (Good)
860 (Good)
568 (Good)
no2
22 (Good)
28 (Good)
27 (Good)
13 (Good)
27 (Good)
44 (Moderate)
38 (Good)
28 (Good)
20 (Good)
18 (Good)
18 (Good)
17 (Good)
22 (Good)
28 (Good)
35 (Good)
20 (Good)
40 (Good)
29 (Good)
17 (Good)
16 (Good)
o3
139 (Unhealthy for Sensitive Groups)
130 (Unhealthy for Sensitive Groups)
112 (Moderate)
78 (Moderate)
58 (Good)
86 (Moderate)
125 (Unhealthy for Sensitive Groups)
126 (Unhealthy for Sensitive Groups)
160 (Unhealthy)
145 (Unhealthy for Sensitive Groups)
141 (Unhealthy for Sensitive Groups)
174 (Unhealthy)
153 (Unhealthy)
112 (Moderate)
111 (Moderate)
111 (Moderate)
116 (Moderate)
86 (Moderate)
110 (Moderate)
131 (Unhealthy for Sensitive Groups)
pm10
53 (Unhealthy for Sensitive Groups)
57 (Unhealthy for Sensitive Groups)
55 (Unhealthy for Sensitive Groups)
48 (Moderate)
75 (Unhealthy for Sensitive Groups)
69 (Unhealthy for Sensitive Groups)
70 (Unhealthy for Sensitive Groups)
70 (Unhealthy for Sensitive Groups)
47 (Moderate)
38 (Moderate)
41 (Moderate)
48 (Moderate)
60 (Unhealthy for Sensitive Groups)
65 (Unhealthy for Sensitive Groups)
83 (Unhealthy)
72 (Unhealthy for Sensitive Groups)
91 (Unhealthy)
66 (Unhealthy for Sensitive Groups)
68 (Unhealthy for Sensitive Groups)
59 (Unhealthy for Sensitive Groups)
so2
17 (Good)
9.6 (Good)
11 (Good)
11 (Good)
10 (Good)
13 (Good)
12 (Good)
12 (Good)
6.9 (Good)
9.4 (Good)
10 (Good)
12 (Good)
14 (Good)
12 (Good)
13 (Good)
13 (Good)
15 (Good)
11 (Good)
6 (Good)
6.3 (Good)
data source »
Ma'anshan Shi Jiao Yu Ji Di
Friday, May 27, 2022, 12:00 PM
PM10 179 (Very bad Hazardous)
particulate matter (PM10) suspended dust
PM2,5 35 (Unhealthy for Sensitive Groups)
particulate matter (PM2.5) dust
O3 0.04 (Good)
ozone (O3)
NO2 0 (Good)
nitrogen dioxide (NO2)
SO2 0 (Good)
sulfur dioxide (SO2)
Ma'anshan Shi Jiao Yu Ji Di
index
2022-05-27
pm10
56
pm25
56
o3
0.03
no2
0
so2
0
市教育基地
2018-10 2020-05

index
2020-05
2020-04
2020-03
2020-02
2020-01
2019-12
2019-11
2019-10
2019-09
2019-08
2019-07
2019-06
2019-05
2019-04
2019-03
2019-02
2019-01
2018-12
2018-11
2018-10
pm25
35
34
35
37
59
56
40
40
27
18
22
33
39
41
47
56
65
52
58
41
co
584
586
610
590
696
620
482
591
582
573
558
614
620
728
741
785
998
602
860
568
no2
22
28
27
13
27
44
38
28
20
18
18
17
22
28
35
20
40
29
17
16
o3
139
130
112
78
58
86
125
126
160
145
141
174
153
112
111
111
116
86
110
131
pm10
53
57
55
48
75
69
70
70
47
38
41
48
60
65
83
72
91
66
68
59
so2
17
9.6
11
11
10
13
12
12
6.9
9.4
10
12
14
12
13
13
15
11
6
6.3
* Pollution data source:
https://openaq.org
(ChinaAQIData)
The data is licensed under CC-By 4.0
PM10 179 (Very bad Hazardous)
PM2,5 35 (Unhealthy for Sensitive Groups)
O3 0 (Good)
NO2 0 (Good)
SO2 0 (Good)
Data on air pollution from recent days in Putang
| index | 2022-05-27 |
|---|---|
| pm10 | 56 Unhealthy for Sensitive Groups |
| pm25 | 56 Unhealthy |
| o3 | 0 Good |
| no2 | 0 Good |
| so2 | 0 Good |

| index | 2020-05 | 2020-04 | 2020-03 | 2020-02 | 2020-01 | 2019-12 | 2019-11 | 2019-10 | 2019-09 | 2019-08 | 2019-07 | 2019-06 | 2019-05 | 2019-04 | 2019-03 | 2019-02 | 2019-01 | 2018-12 | 2018-11 | 2018-10 |
|---|---|---|---|---|---|---|---|---|---|---|---|---|---|---|---|---|---|---|---|---|
| pm25 | 35 (Moderate) | 34 (Moderate) | 35 (Unhealthy for Sensitive Groups) | 37 (Unhealthy for Sensitive Groups) | 59 (Unhealthy) | 56 (Unhealthy) | 40 (Unhealthy for Sensitive Groups) | 40 (Unhealthy for Sensitive Groups) | 27 (Moderate) | 18 (Moderate) | 22 (Moderate) | 33 (Moderate) | 39 (Unhealthy for Sensitive Groups) | 41 (Unhealthy for Sensitive Groups) | 47 (Unhealthy for Sensitive Groups) | 56 (Unhealthy) | 65 (Unhealthy) | 52 (Unhealthy for Sensitive Groups) | 58 (Unhealthy) | 41 (Unhealthy for Sensitive Groups) |
| co | 584 (Good) | 586 (Good) | 610 (Good) | 590 (Good) | 696 (Good) | 620 (Good) | 482 (Good) | 591 (Good) | 582 (Good) | 573 (Good) | 558 (Good) | 614 (Good) | 620 (Good) | 728 (Good) | 741 (Good) | 785 (Good) | 998 (Good) | 602 (Good) | 860 (Good) | 568 (Good) |
| no2 | 22 (Good) | 28 (Good) | 27 (Good) | 13 (Good) | 27 (Good) | 44 (Moderate) | 38 (Good) | 28 (Good) | 20 (Good) | 18 (Good) | 18 (Good) | 17 (Good) | 22 (Good) | 28 (Good) | 35 (Good) | 20 (Good) | 40 (Good) | 29 (Good) | 17 (Good) | 16 (Good) |
| o3 | 139 (Unhealthy for Sensitive Groups) | 130 (Unhealthy for Sensitive Groups) | 112 (Moderate) | 78 (Moderate) | 58 (Good) | 86 (Moderate) | 125 (Unhealthy for Sensitive Groups) | 126 (Unhealthy for Sensitive Groups) | 160 (Unhealthy) | 145 (Unhealthy for Sensitive Groups) | 141 (Unhealthy for Sensitive Groups) | 174 (Unhealthy) | 153 (Unhealthy) | 112 (Moderate) | 111 (Moderate) | 111 (Moderate) | 116 (Moderate) | 86 (Moderate) | 110 (Moderate) | 131 (Unhealthy for Sensitive Groups) |
| pm10 | 53 (Unhealthy for Sensitive Groups) | 57 (Unhealthy for Sensitive Groups) | 55 (Unhealthy for Sensitive Groups) | 48 (Moderate) | 75 (Unhealthy for Sensitive Groups) | 69 (Unhealthy for Sensitive Groups) | 70 (Unhealthy for Sensitive Groups) | 70 (Unhealthy for Sensitive Groups) | 47 (Moderate) | 38 (Moderate) | 41 (Moderate) | 48 (Moderate) | 60 (Unhealthy for Sensitive Groups) | 65 (Unhealthy for Sensitive Groups) | 83 (Unhealthy) | 72 (Unhealthy for Sensitive Groups) | 91 (Unhealthy) | 66 (Unhealthy for Sensitive Groups) | 68 (Unhealthy for Sensitive Groups) | 59 (Unhealthy for Sensitive Groups) |
| so2 | 17 (Good) | 9.6 (Good) | 11 (Good) | 11 (Good) | 10 (Good) | 13 (Good) | 12 (Good) | 12 (Good) | 6.9 (Good) | 9.4 (Good) | 10 (Good) | 12 (Good) | 14 (Good) | 12 (Good) | 13 (Good) | 13 (Good) | 15 (Good) | 11 (Good) | 6 (Good) | 6.3 (Good) |
PM10 179 (Very bad Hazardous)
particulate matter (PM10) suspended dustPM2,5 35 (Unhealthy for Sensitive Groups)
particulate matter (PM2.5) dustO3 0.04 (Good)
ozone (O3)NO2 0 (Good)
nitrogen dioxide (NO2)SO2 0 (Good)
sulfur dioxide (SO2)Ma'anshan Shi Jiao Yu Ji Di
| index | 2022-05-27 |
|---|---|
| pm10 | 56 |
| pm25 | 56 |
| o3 | 0.03 |
| no2 | 0 |
| so2 | 0 |
市教育基地

| index | 2020-05 | 2020-04 | 2020-03 | 2020-02 | 2020-01 | 2019-12 | 2019-11 | 2019-10 | 2019-09 | 2019-08 | 2019-07 | 2019-06 | 2019-05 | 2019-04 | 2019-03 | 2019-02 | 2019-01 | 2018-12 | 2018-11 | 2018-10 |
|---|---|---|---|---|---|---|---|---|---|---|---|---|---|---|---|---|---|---|---|---|
| pm25 | 35 | 34 | 35 | 37 | 59 | 56 | 40 | 40 | 27 | 18 | 22 | 33 | 39 | 41 | 47 | 56 | 65 | 52 | 58 | 41 |
| co | 584 | 586 | 610 | 590 | 696 | 620 | 482 | 591 | 582 | 573 | 558 | 614 | 620 | 728 | 741 | 785 | 998 | 602 | 860 | 568 |
| no2 | 22 | 28 | 27 | 13 | 27 | 44 | 38 | 28 | 20 | 18 | 18 | 17 | 22 | 28 | 35 | 20 | 40 | 29 | 17 | 16 |
| o3 | 139 | 130 | 112 | 78 | 58 | 86 | 125 | 126 | 160 | 145 | 141 | 174 | 153 | 112 | 111 | 111 | 116 | 86 | 110 | 131 |
| pm10 | 53 | 57 | 55 | 48 | 75 | 69 | 70 | 70 | 47 | 38 | 41 | 48 | 60 | 65 | 83 | 72 | 91 | 66 | 68 | 59 |
| so2 | 17 | 9.6 | 11 | 11 | 10 | 13 | 12 | 12 | 6.9 | 9.4 | 10 | 12 | 14 | 12 | 13 | 13 | 15 | 11 | 6 | 6.3 |