Air Pollution in Qingyuan: Real-time Air Quality Index and smog alert.
Pollution and air quality forecast for Qingyuan. Today is Tuesday, June 16, 2026. The following air pollution values have been recorded for Qingyuan:- particulate matter (PM10) suspended dust - 179 (Very bad Hazardous)
- particulate matter (PM2.5) dust - 35 (Unhealthy for Sensitive Groups)
- ozone (O3) - 0 (Good)
- nitrogen dioxide (NO2) - 0 (Good)
- sulfur dioxide (SO2) - 0 (Good)

What is the air quality in Qingyuan today? Is the air polluted in Qingyuan?. Is there smog?
What is the level of PM10 today in Qingyuan? (particulate matter (PM10) suspended dust)
The current level of particulate matter PM10 in Qingyuan is:
179 (Very bad Hazardous)
The highest PM10 values usually occur in month: 75 (November 2019).
The lowest value of particulate matter PM10 pollution in Qingyuan is usually recorded in: June (35).
What is the current level of PM2.5 in Qingyuan? (particulate matter (PM2.5) dust)
Today's PM2.5 level is:
35 (Unhealthy for Sensitive Groups)
For comparison, the highest level of PM2.5 in Qingyuan in the last 7 days was: 56 (Friday, May 27, 2022) and the lowest: 56 (Friday, May 27, 2022).
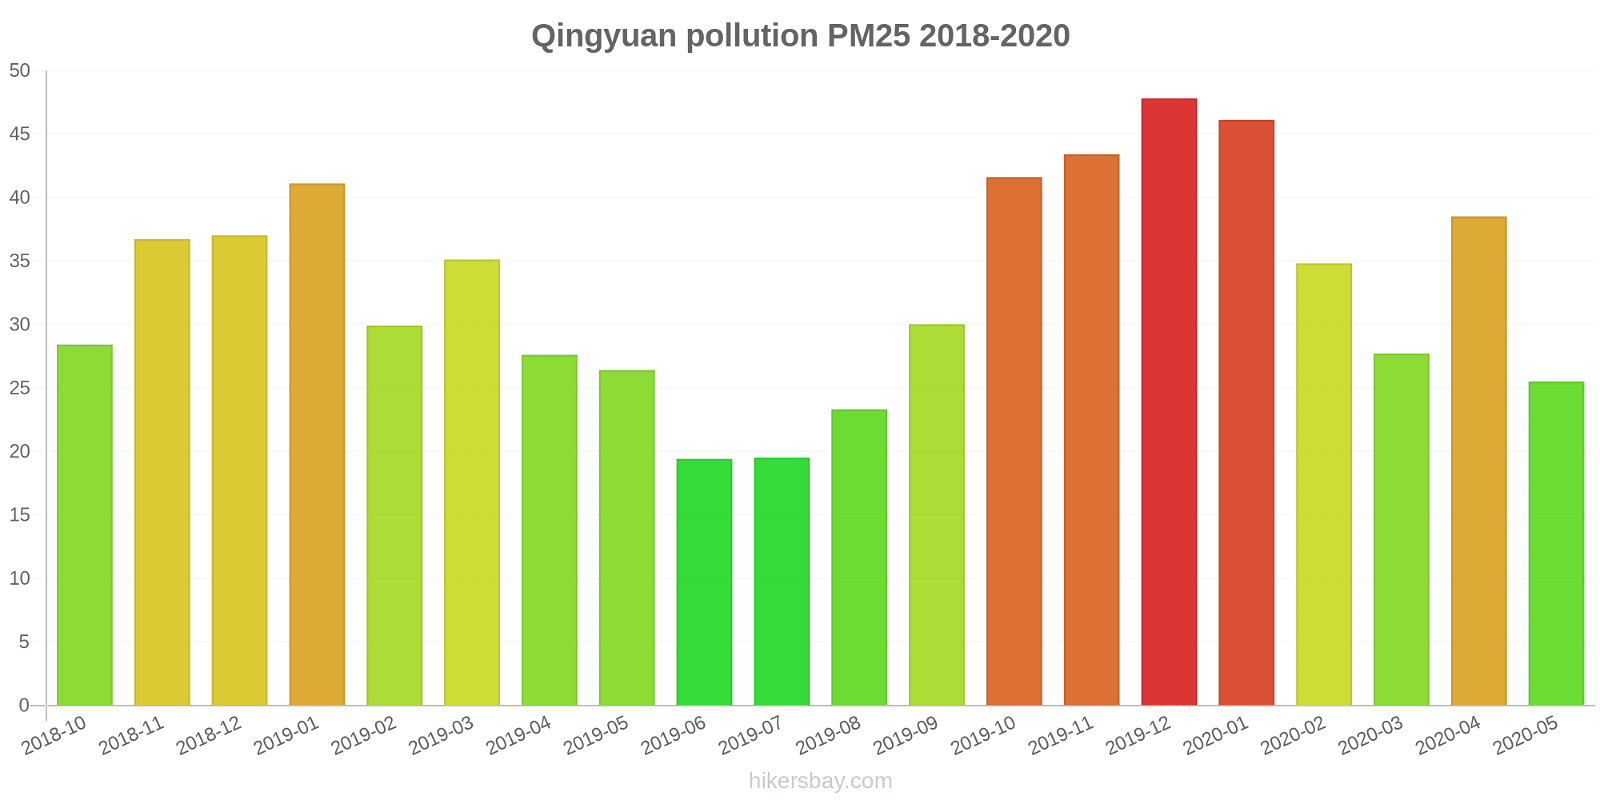
The highest PM2.5 values were recorded: 48 (December 2019).
The lowest level of particulate matter PM2.5 pollution occurs in month: June (19).
How is the O3 level today in Qingyuan? (ozone (O3))
0 (Good)
How high is the level of NO2? (nitrogen dioxide (NO2))
0 (Good)
What is the level of SO2 pollution? (sulfur dioxide (SO2))
0 (Good)
Current data Friday, May 27, 2022, 12:00 PM
PM10 179 (Very bad Hazardous)
PM2,5 35 (Unhealthy for Sensitive Groups)
O3 0 (Good)
NO2 0 (Good)
SO2 0 (Good)
Data on air pollution from recent days in Qingyuan
index
2022-05-27
pm10
56
Unhealthy for Sensitive Groups
pm25
56
Unhealthy
o3
0
Good
no2
0
Good
so2
0
Good
data source »
Air pollution in Qingyuan from October 2018 to May 2020
index
2020-05
2020-04
2020-03
2020-02
2020-01
2019-12
2019-11
2019-10
2019-09
2019-08
2019-07
2019-06
2019-05
2019-04
2019-03
2019-02
2019-01
2018-12
2018-11
2018-10
pm25
26 (Moderate)
39 (Unhealthy for Sensitive Groups)
28 (Moderate)
35 (Moderate)
46 (Unhealthy for Sensitive Groups)
48 (Unhealthy for Sensitive Groups)
43 (Unhealthy for Sensitive Groups)
42 (Unhealthy for Sensitive Groups)
30 (Moderate)
23 (Moderate)
20 (Moderate)
19 (Moderate)
26 (Moderate)
28 (Moderate)
35 (Unhealthy for Sensitive Groups)
30 (Moderate)
41 (Unhealthy for Sensitive Groups)
37 (Unhealthy for Sensitive Groups)
37 (Unhealthy for Sensitive Groups)
28 (Moderate)
co
516 (Good)
794 (Good)
790 (Good)
704 (Good)
1 (Good)
979 (Good)
758 (Good)
713 (Good)
654 (Good)
583 (Good)
547 (Good)
599 (Good)
726 (Good)
931 (Good)
1 (Good)
1 (Good)
1 (Good)
1 (Good)
991 (Good)
848 (Good)
no2
22 (Good)
32 (Good)
34 (Good)
25 (Good)
40 (Good)
47 (Moderate)
40 (Moderate)
30 (Good)
30 (Good)
24 (Good)
27 (Good)
27 (Good)
30 (Good)
37 (Good)
40 (Good)
27 (Good)
34 (Good)
37 (Good)
36 (Good)
31 (Good)
o3
127 (Unhealthy for Sensitive Groups)
118 (Moderate)
72 (Moderate)
94 (Moderate)
91 (Moderate)
101 (Moderate)
156 (Unhealthy)
141 (Unhealthy for Sensitive Groups)
149 (Unhealthy for Sensitive Groups)
121 (Unhealthy for Sensitive Groups)
121 (Unhealthy for Sensitive Groups)
115 (Moderate)
106 (Moderate)
81 (Moderate)
64 (Good)
46 (Good)
66 (Good)
55 (Good)
88 (Moderate)
92 (Moderate)
pm10
45 (Moderate)
52 (Unhealthy for Sensitive Groups)
41 (Moderate)
39 (Moderate)
61 (Unhealthy for Sensitive Groups)
74 (Unhealthy for Sensitive Groups)
75 (Unhealthy for Sensitive Groups)
62 (Unhealthy for Sensitive Groups)
54 (Unhealthy for Sensitive Groups)
41 (Moderate)
37 (Moderate)
35 (Moderate)
40 (Moderate)
41 (Moderate)
52 (Unhealthy for Sensitive Groups)
41 (Moderate)
53 (Unhealthy for Sensitive Groups)
53 (Unhealthy for Sensitive Groups)
52 (Unhealthy for Sensitive Groups)
45 (Moderate)
so2
7.6 (Good)
9.1 (Good)
7.1 (Good)
6.3 (Good)
7.1 (Good)
12 (Good)
12 (Good)
11 (Good)
9.4 (Good)
7.5 (Good)
7.9 (Good)
8.2 (Good)
8.1 (Good)
9 (Good)
10 (Good)
7.2 (Good)
7.6 (Good)
7.9 (Good)
12 (Good)
12 (Good)
data source »
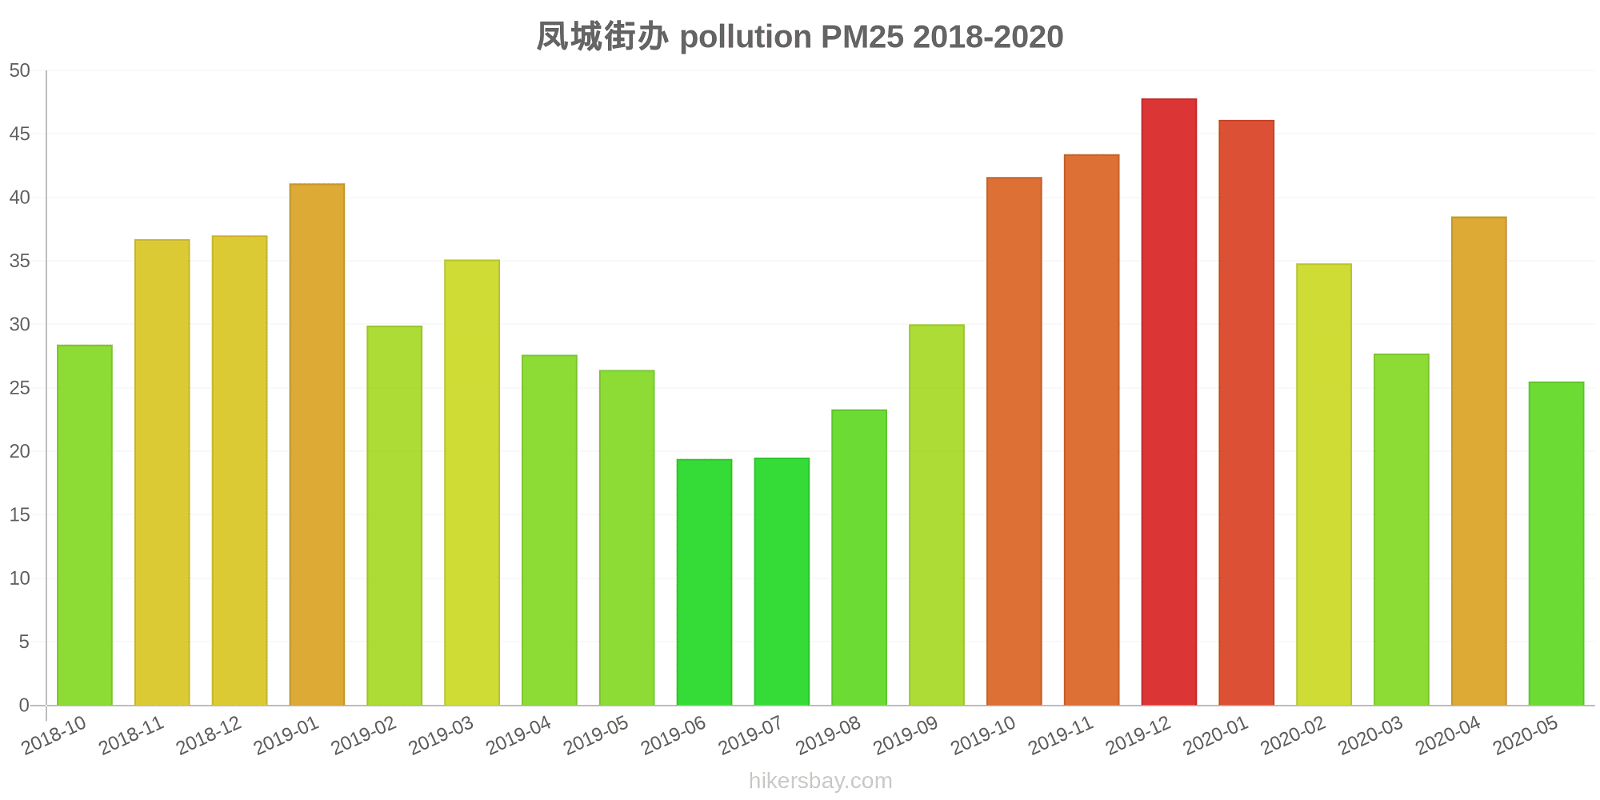
凤城街办
Friday, May 27, 2022, 12:00 PM
PM10 179 (Very bad Hazardous)
particulate matter (PM10) suspended dust
PM2,5 35 (Unhealthy for Sensitive Groups)
particulate matter (PM2.5) dust
O3 0.04 (Good)
ozone (O3)
NO2 0 (Good)
nitrogen dioxide (NO2)
SO2 0 (Good)
sulfur dioxide (SO2)
凤城街办
index
2022-05-27
pm10
56
pm25
56
o3
0.03
no2
0
so2
0
凤城街办
2018-10 2020-05
index
2020-05
2020-04
2020-03
2020-02
2020-01
2019-12
2019-11
2019-10
2019-09
2019-08
2019-07
2019-06
2019-05
2019-04
2019-03
2019-02
2019-01
2018-12
2018-11
2018-10
pm25
26
39
28
35
46
48
43
42
30
23
20
19
26
28
35
30
41
37
37
28
co
516
794
790
704
1
979
758
713
654
583
547
599
726
931
1
1
1
1
991
848
no2
22
32
34
25
40
47
40
30
30
24
27
27
30
37
40
27
34
37
36
31
o3
127
118
72
94
91
101
156
141
149
121
121
115
106
81
64
46
66
55
88
92
pm10
45
52
41
39
61
74
75
62
54
41
37
35
40
41
52
41
53
53
52
45
so2
7.6
9.1
7.1
6.3
7.1
12
12
11
9.4
7.5
7.9
8.2
8.1
9
10
7.2
7.6
7.9
12
12
* Pollution data source:
https://openaq.org
(ChinaAQIData)
The data is licensed under CC-By 4.0
PM10 179 (Very bad Hazardous)
PM2,5 35 (Unhealthy for Sensitive Groups)
O3 0 (Good)
NO2 0 (Good)
SO2 0 (Good)
Data on air pollution from recent days in Qingyuan
| index | 2022-05-27 |
|---|---|
| pm10 | 56 Unhealthy for Sensitive Groups |
| pm25 | 56 Unhealthy |
| o3 | 0 Good |
| no2 | 0 Good |
| so2 | 0 Good |

| index | 2020-05 | 2020-04 | 2020-03 | 2020-02 | 2020-01 | 2019-12 | 2019-11 | 2019-10 | 2019-09 | 2019-08 | 2019-07 | 2019-06 | 2019-05 | 2019-04 | 2019-03 | 2019-02 | 2019-01 | 2018-12 | 2018-11 | 2018-10 |
|---|---|---|---|---|---|---|---|---|---|---|---|---|---|---|---|---|---|---|---|---|
| pm25 | 26 (Moderate) | 39 (Unhealthy for Sensitive Groups) | 28 (Moderate) | 35 (Moderate) | 46 (Unhealthy for Sensitive Groups) | 48 (Unhealthy for Sensitive Groups) | 43 (Unhealthy for Sensitive Groups) | 42 (Unhealthy for Sensitive Groups) | 30 (Moderate) | 23 (Moderate) | 20 (Moderate) | 19 (Moderate) | 26 (Moderate) | 28 (Moderate) | 35 (Unhealthy for Sensitive Groups) | 30 (Moderate) | 41 (Unhealthy for Sensitive Groups) | 37 (Unhealthy for Sensitive Groups) | 37 (Unhealthy for Sensitive Groups) | 28 (Moderate) |
| co | 516 (Good) | 794 (Good) | 790 (Good) | 704 (Good) | 1 (Good) | 979 (Good) | 758 (Good) | 713 (Good) | 654 (Good) | 583 (Good) | 547 (Good) | 599 (Good) | 726 (Good) | 931 (Good) | 1 (Good) | 1 (Good) | 1 (Good) | 1 (Good) | 991 (Good) | 848 (Good) |
| no2 | 22 (Good) | 32 (Good) | 34 (Good) | 25 (Good) | 40 (Good) | 47 (Moderate) | 40 (Moderate) | 30 (Good) | 30 (Good) | 24 (Good) | 27 (Good) | 27 (Good) | 30 (Good) | 37 (Good) | 40 (Good) | 27 (Good) | 34 (Good) | 37 (Good) | 36 (Good) | 31 (Good) |
| o3 | 127 (Unhealthy for Sensitive Groups) | 118 (Moderate) | 72 (Moderate) | 94 (Moderate) | 91 (Moderate) | 101 (Moderate) | 156 (Unhealthy) | 141 (Unhealthy for Sensitive Groups) | 149 (Unhealthy for Sensitive Groups) | 121 (Unhealthy for Sensitive Groups) | 121 (Unhealthy for Sensitive Groups) | 115 (Moderate) | 106 (Moderate) | 81 (Moderate) | 64 (Good) | 46 (Good) | 66 (Good) | 55 (Good) | 88 (Moderate) | 92 (Moderate) |
| pm10 | 45 (Moderate) | 52 (Unhealthy for Sensitive Groups) | 41 (Moderate) | 39 (Moderate) | 61 (Unhealthy for Sensitive Groups) | 74 (Unhealthy for Sensitive Groups) | 75 (Unhealthy for Sensitive Groups) | 62 (Unhealthy for Sensitive Groups) | 54 (Unhealthy for Sensitive Groups) | 41 (Moderate) | 37 (Moderate) | 35 (Moderate) | 40 (Moderate) | 41 (Moderate) | 52 (Unhealthy for Sensitive Groups) | 41 (Moderate) | 53 (Unhealthy for Sensitive Groups) | 53 (Unhealthy for Sensitive Groups) | 52 (Unhealthy for Sensitive Groups) | 45 (Moderate) |
| so2 | 7.6 (Good) | 9.1 (Good) | 7.1 (Good) | 6.3 (Good) | 7.1 (Good) | 12 (Good) | 12 (Good) | 11 (Good) | 9.4 (Good) | 7.5 (Good) | 7.9 (Good) | 8.2 (Good) | 8.1 (Good) | 9 (Good) | 10 (Good) | 7.2 (Good) | 7.6 (Good) | 7.9 (Good) | 12 (Good) | 12 (Good) |
PM10 179 (Very bad Hazardous)
particulate matter (PM10) suspended dustPM2,5 35 (Unhealthy for Sensitive Groups)
particulate matter (PM2.5) dustO3 0.04 (Good)
ozone (O3)NO2 0 (Good)
nitrogen dioxide (NO2)SO2 0 (Good)
sulfur dioxide (SO2)凤城街办
| index | 2022-05-27 |
|---|---|
| pm10 | 56 |
| pm25 | 56 |
| o3 | 0.03 |
| no2 | 0 |
| so2 | 0 |
凤城街办

| index | 2020-05 | 2020-04 | 2020-03 | 2020-02 | 2020-01 | 2019-12 | 2019-11 | 2019-10 | 2019-09 | 2019-08 | 2019-07 | 2019-06 | 2019-05 | 2019-04 | 2019-03 | 2019-02 | 2019-01 | 2018-12 | 2018-11 | 2018-10 |
|---|---|---|---|---|---|---|---|---|---|---|---|---|---|---|---|---|---|---|---|---|
| pm25 | 26 | 39 | 28 | 35 | 46 | 48 | 43 | 42 | 30 | 23 | 20 | 19 | 26 | 28 | 35 | 30 | 41 | 37 | 37 | 28 |
| co | 516 | 794 | 790 | 704 | 1 | 979 | 758 | 713 | 654 | 583 | 547 | 599 | 726 | 931 | 1 | 1 | 1 | 1 | 991 | 848 |
| no2 | 22 | 32 | 34 | 25 | 40 | 47 | 40 | 30 | 30 | 24 | 27 | 27 | 30 | 37 | 40 | 27 | 34 | 37 | 36 | 31 |
| o3 | 127 | 118 | 72 | 94 | 91 | 101 | 156 | 141 | 149 | 121 | 121 | 115 | 106 | 81 | 64 | 46 | 66 | 55 | 88 | 92 |
| pm10 | 45 | 52 | 41 | 39 | 61 | 74 | 75 | 62 | 54 | 41 | 37 | 35 | 40 | 41 | 52 | 41 | 53 | 53 | 52 | 45 |
| so2 | 7.6 | 9.1 | 7.1 | 6.3 | 7.1 | 12 | 12 | 11 | 9.4 | 7.5 | 7.9 | 8.2 | 8.1 | 9 | 10 | 7.2 | 7.6 | 7.9 | 12 | 12 |