Air Pollution in Qingyunpu: Real-time Air Quality Index and smog alert.
Pollution and air quality forecast for Qingyunpu. Today is Tuesday, June 2, 2026. The following air pollution values have been recorded for Qingyunpu:- particulate matter (PM10) suspended dust - 179 (Very bad Hazardous)
- particulate matter (PM2.5) dust - 35 (Unhealthy for Sensitive Groups)
- ozone (O3) - 0 (Good)
- nitrogen dioxide (NO2) - 0 (Good)
- sulfur dioxide (SO2) - 0 (Good)

What is the air quality in Qingyunpu today? Is the air polluted in Qingyunpu?. Is there smog?
What is the level of PM10 today in Qingyunpu? (particulate matter (PM10) suspended dust)
The current level of particulate matter PM10 in Qingyunpu is:
179 (Very bad Hazardous)
The highest PM10 values usually occur in month: 119 (November 2019).
The lowest value of particulate matter PM10 pollution in Qingyunpu is usually recorded in: July (37).
What is the current level of PM2.5 in Qingyunpu? (particulate matter (PM2.5) dust)
Today's PM2.5 level is:
35 (Unhealthy for Sensitive Groups)
For comparison, the highest level of PM2.5 in Qingyunpu in the last 7 days was: 56 (Friday, May 27, 2022) and the lowest: 56 (Friday, May 27, 2022).
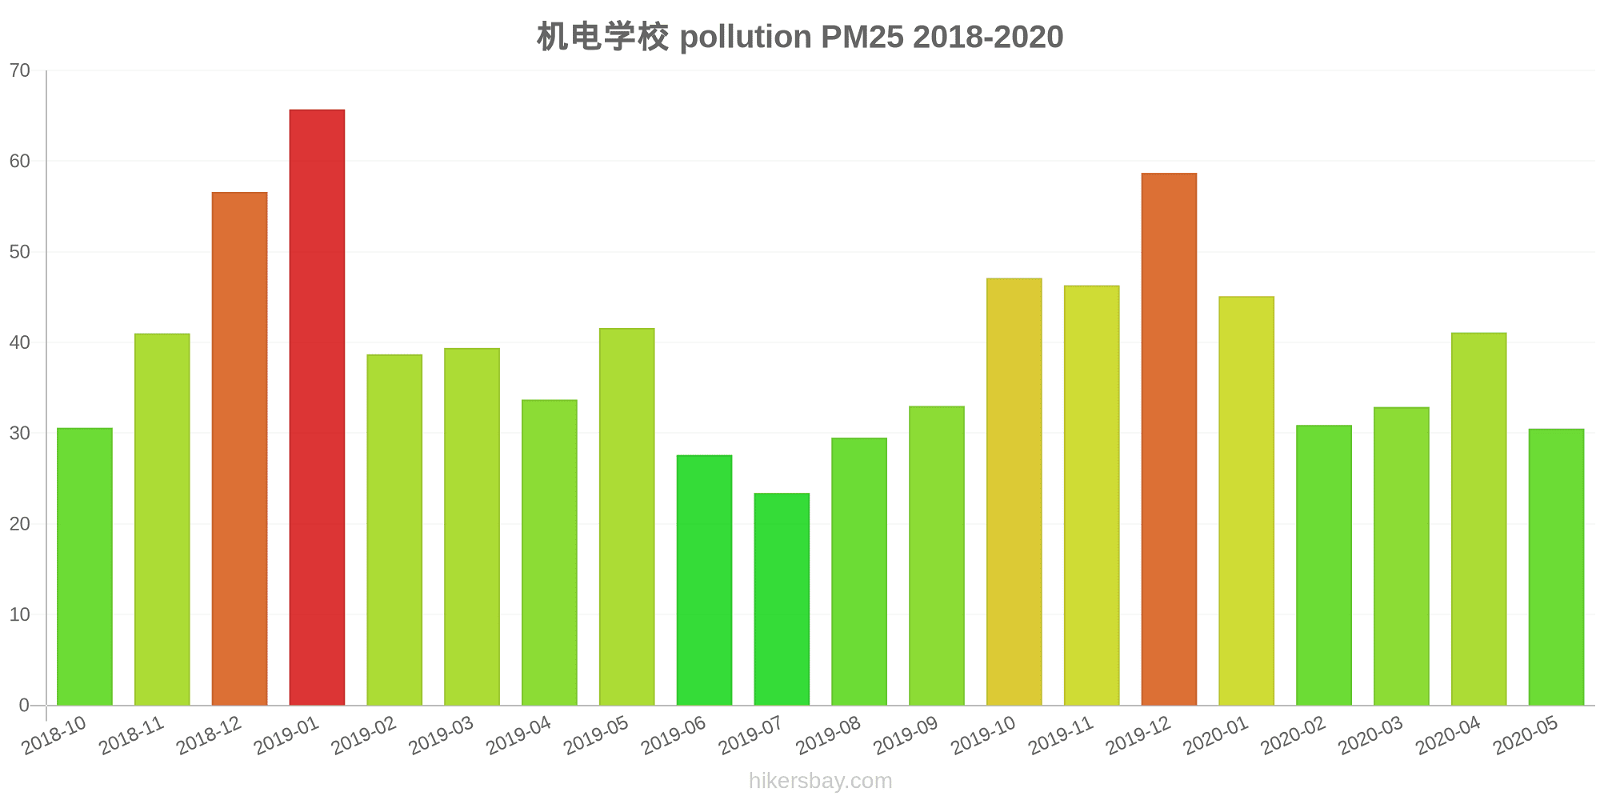
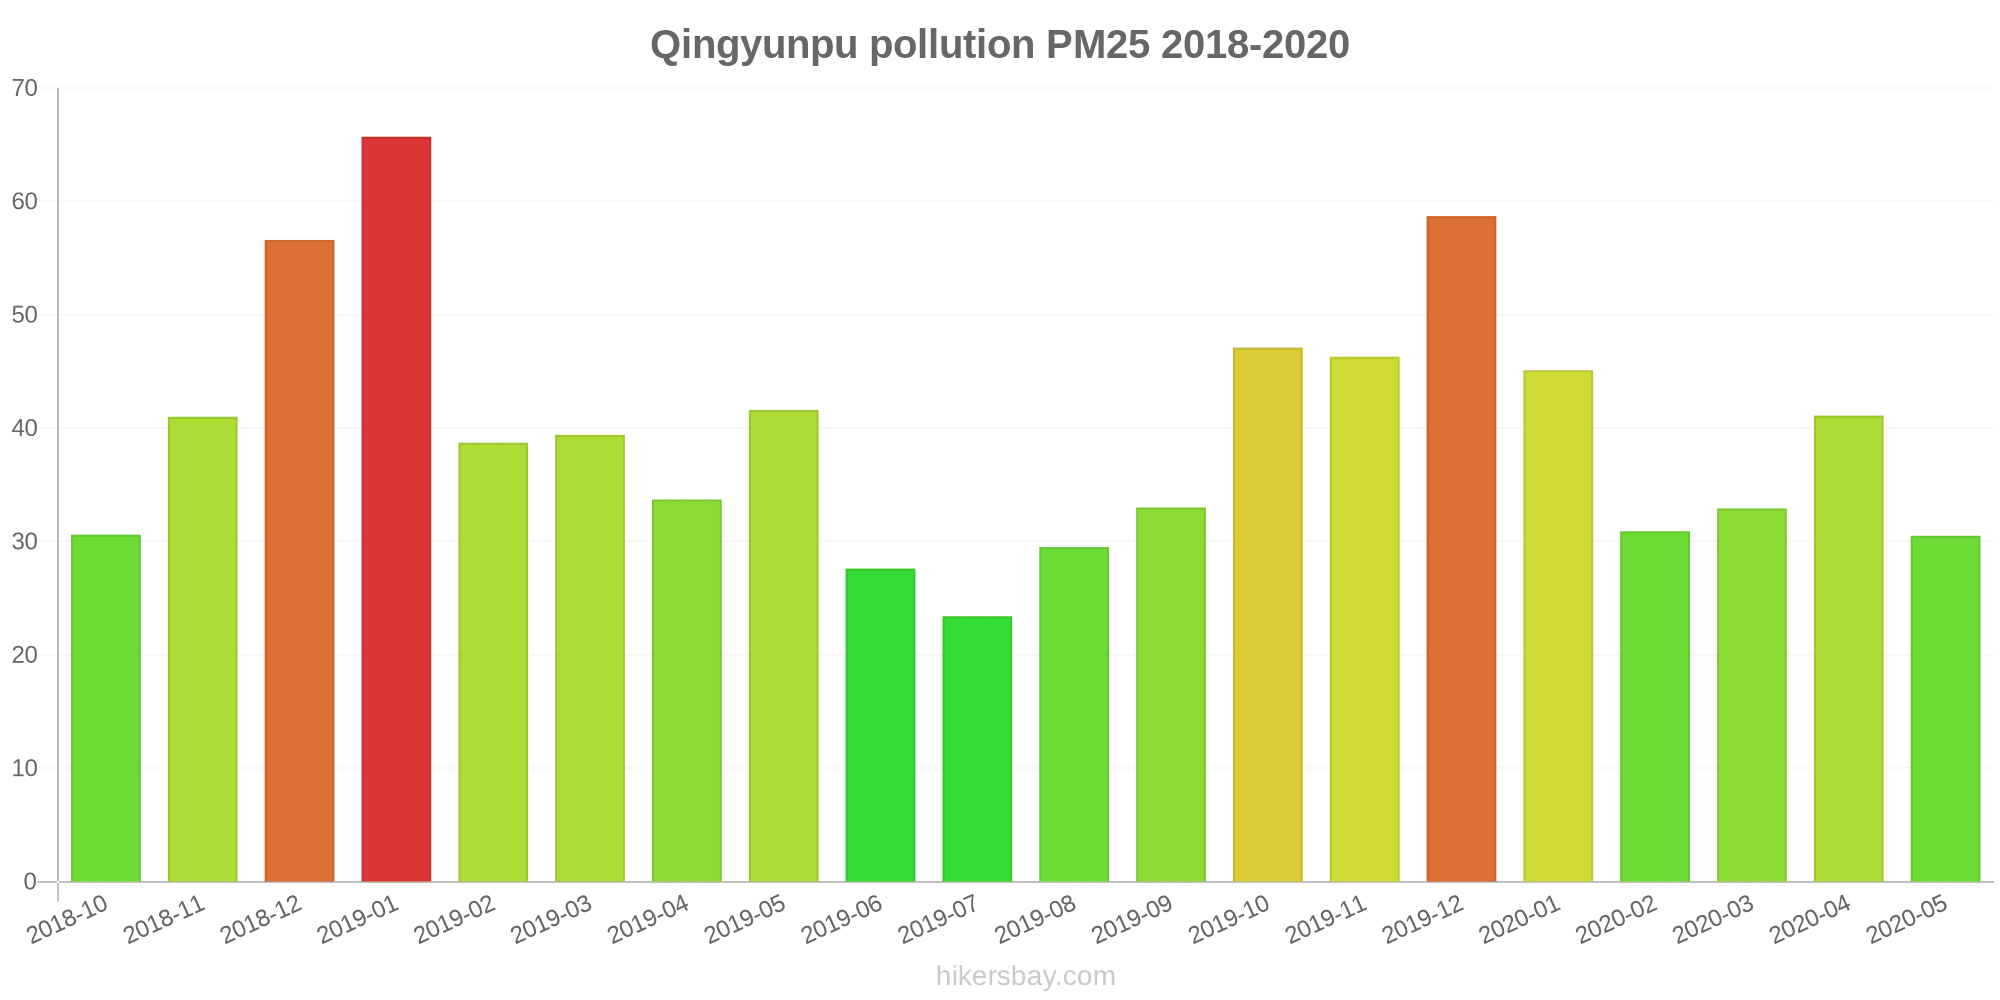
The highest PM2.5 values were recorded: 66 (January 2019).
The lowest level of particulate matter PM2.5 pollution occurs in month: July (23).
How is the O3 level today in Qingyunpu? (ozone (O3))
0 (Good)
How high is the level of NO2? (nitrogen dioxide (NO2))
0 (Good)
What is the level of SO2 pollution? (sulfur dioxide (SO2))
0 (Good)
Current data Friday, May 27, 2022, 12:00 PM
PM10 179 (Very bad Hazardous)
PM2,5 35 (Unhealthy for Sensitive Groups)
O3 0 (Good)
NO2 0 (Good)
SO2 0 (Good)
Data on air pollution from recent days in Qingyunpu
index
2022-05-27
pm10
56
Unhealthy for Sensitive Groups
pm25
56
Unhealthy
o3
0
Good
no2
0
Good
so2
0
Good
data source »
Air pollution in Qingyunpu from October 2018 to May 2020

index
2020-05
2020-04
2020-03
2020-02
2020-01
2019-12
2019-11
2019-10
2019-09
2019-08
2019-07
2019-06
2019-05
2019-04
2019-03
2019-02
2019-01
2018-12
2018-11
2018-10
pm25
31 (Moderate)
41 (Unhealthy for Sensitive Groups)
33 (Moderate)
31 (Moderate)
45 (Unhealthy for Sensitive Groups)
59 (Unhealthy)
46 (Unhealthy for Sensitive Groups)
47 (Unhealthy for Sensitive Groups)
33 (Moderate)
30 (Moderate)
23 (Moderate)
28 (Moderate)
42 (Unhealthy for Sensitive Groups)
34 (Moderate)
39 (Unhealthy for Sensitive Groups)
39 (Unhealthy for Sensitive Groups)
66 (Unhealthy)
57 (Unhealthy)
41 (Unhealthy for Sensitive Groups)
31 (Moderate)
co
685 (Good)
521 (Good)
590 (Good)
516 (Good)
722 (Good)
858 (Good)
664 (Good)
726 (Good)
755 (Good)
622 (Good)
582 (Good)
740 (Good)
896 (Good)
898 (Good)
758 (Good)
762 (Good)
1 (Good)
1 (Good)
980 (Good)
874 (Good)
no2
24 (Good)
46 (Moderate)
32 (Good)
18 (Good)
28 (Good)
53 (Moderate)
50 (Moderate)
39 (Good)
28 (Good)
22 (Good)
19 (Good)
21 (Good)
34 (Good)
36 (Good)
40 (Good)
31 (Good)
42 (Moderate)
41 (Moderate)
45 (Moderate)
51 (Moderate)
o3
130 (Unhealthy for Sensitive Groups)
136 (Unhealthy for Sensitive Groups)
89 (Moderate)
88 (Moderate)
69 (Good)
78 (Moderate)
107 (Moderate)
126 (Unhealthy for Sensitive Groups)
160 (Unhealthy)
148 (Unhealthy for Sensitive Groups)
112 (Moderate)
113 (Moderate)
138 (Unhealthy for Sensitive Groups)
115 (Moderate)
99 (Moderate)
54 (Good)
60 (Good)
49 (Good)
76 (Moderate)
111 (Moderate)
pm10
56 (Unhealthy for Sensitive Groups)
105 (Unhealthy)
70 (Unhealthy for Sensitive Groups)
50 (Unhealthy for Sensitive Groups)
69 (Unhealthy for Sensitive Groups)
112 (Very Unhealthy)
119 (Very Unhealthy)
103 (Unhealthy)
80 (Unhealthy)
66 (Unhealthy for Sensitive Groups)
37 (Moderate)
46 (Moderate)
80 (Unhealthy for Sensitive Groups)
61 (Unhealthy for Sensitive Groups)
73 (Unhealthy for Sensitive Groups)
51 (Unhealthy for Sensitive Groups)
93 (Unhealthy)
75 (Unhealthy for Sensitive Groups)
58 (Unhealthy for Sensitive Groups)
63 (Unhealthy for Sensitive Groups)
so2
11 (Good)
14 (Good)
7.2 (Good)
4.2 (Good)
5.3 (Good)
12 (Good)
13 (Good)
8 (Good)
6.2 (Good)
7.1 (Good)
6.3 (Good)
4.2 (Good)
7.5 (Good)
10 (Good)
6 (Good)
2.9 (Good)
7.5 (Good)
7.2 (Good)
9.3 (Good)
12 (Good)
data source »
机电学校(启用170322)
Friday, May 27, 2022, 12:00 PM
PM10 179 (Very bad Hazardous)
particulate matter (PM10) suspended dust
PM2,5 35 (Unhealthy for Sensitive Groups)
particulate matter (PM2.5) dust
O3 0.04 (Good)
ozone (O3)
NO2 0 (Good)
nitrogen dioxide (NO2)
SO2 0 (Good)
sulfur dioxide (SO2)
机电学校(启用170322)
index
2022-05-27
pm10
56
pm25
56
o3
0.03
no2
0
so2
0
机电学校
2018-10 2020-05
index
2020-05
2020-04
2020-03
2020-02
2020-01
2019-12
2019-11
2019-10
2019-09
2019-08
2019-07
2019-06
2019-05
2019-04
2019-03
2019-02
2019-01
2018-12
2018-11
2018-10
pm25
31
41
33
31
45
59
46
47
33
30
23
28
42
34
39
39
66
57
41
31
co
685
521
590
516
722
858
664
726
755
622
582
740
896
898
758
762
1
1
980
874
no2
24
46
32
18
28
53
50
39
28
22
19
21
34
36
40
31
42
41
45
51
o3
130
136
89
88
69
78
107
126
160
148
112
113
138
115
99
54
60
49
76
111
pm10
56
105
70
50
69
112
119
103
80
66
37
46
80
61
73
51
93
75
58
63
so2
11
14
7.2
4.2
5.3
12
13
8
6.2
7.1
6.3
4.2
7.5
10
6
2.9
7.5
7.2
9.3
12
* Pollution data source:
https://openaq.org
(ChinaAQIData)
The data is licensed under CC-By 4.0
PM10 179 (Very bad Hazardous)
PM2,5 35 (Unhealthy for Sensitive Groups)
O3 0 (Good)
NO2 0 (Good)
SO2 0 (Good)
Data on air pollution from recent days in Qingyunpu
| index | 2022-05-27 |
|---|---|
| pm10 | 56 Unhealthy for Sensitive Groups |
| pm25 | 56 Unhealthy |
| o3 | 0 Good |
| no2 | 0 Good |
| so2 | 0 Good |
| index | 2020-05 | 2020-04 | 2020-03 | 2020-02 | 2020-01 | 2019-12 | 2019-11 | 2019-10 | 2019-09 | 2019-08 | 2019-07 | 2019-06 | 2019-05 | 2019-04 | 2019-03 | 2019-02 | 2019-01 | 2018-12 | 2018-11 | 2018-10 |
|---|---|---|---|---|---|---|---|---|---|---|---|---|---|---|---|---|---|---|---|---|
| pm25 | 31 (Moderate) | 41 (Unhealthy for Sensitive Groups) | 33 (Moderate) | 31 (Moderate) | 45 (Unhealthy for Sensitive Groups) | 59 (Unhealthy) | 46 (Unhealthy for Sensitive Groups) | 47 (Unhealthy for Sensitive Groups) | 33 (Moderate) | 30 (Moderate) | 23 (Moderate) | 28 (Moderate) | 42 (Unhealthy for Sensitive Groups) | 34 (Moderate) | 39 (Unhealthy for Sensitive Groups) | 39 (Unhealthy for Sensitive Groups) | 66 (Unhealthy) | 57 (Unhealthy) | 41 (Unhealthy for Sensitive Groups) | 31 (Moderate) |
| co | 685 (Good) | 521 (Good) | 590 (Good) | 516 (Good) | 722 (Good) | 858 (Good) | 664 (Good) | 726 (Good) | 755 (Good) | 622 (Good) | 582 (Good) | 740 (Good) | 896 (Good) | 898 (Good) | 758 (Good) | 762 (Good) | 1 (Good) | 1 (Good) | 980 (Good) | 874 (Good) |
| no2 | 24 (Good) | 46 (Moderate) | 32 (Good) | 18 (Good) | 28 (Good) | 53 (Moderate) | 50 (Moderate) | 39 (Good) | 28 (Good) | 22 (Good) | 19 (Good) | 21 (Good) | 34 (Good) | 36 (Good) | 40 (Good) | 31 (Good) | 42 (Moderate) | 41 (Moderate) | 45 (Moderate) | 51 (Moderate) |
| o3 | 130 (Unhealthy for Sensitive Groups) | 136 (Unhealthy for Sensitive Groups) | 89 (Moderate) | 88 (Moderate) | 69 (Good) | 78 (Moderate) | 107 (Moderate) | 126 (Unhealthy for Sensitive Groups) | 160 (Unhealthy) | 148 (Unhealthy for Sensitive Groups) | 112 (Moderate) | 113 (Moderate) | 138 (Unhealthy for Sensitive Groups) | 115 (Moderate) | 99 (Moderate) | 54 (Good) | 60 (Good) | 49 (Good) | 76 (Moderate) | 111 (Moderate) |
| pm10 | 56 (Unhealthy for Sensitive Groups) | 105 (Unhealthy) | 70 (Unhealthy for Sensitive Groups) | 50 (Unhealthy for Sensitive Groups) | 69 (Unhealthy for Sensitive Groups) | 112 (Very Unhealthy) | 119 (Very Unhealthy) | 103 (Unhealthy) | 80 (Unhealthy) | 66 (Unhealthy for Sensitive Groups) | 37 (Moderate) | 46 (Moderate) | 80 (Unhealthy for Sensitive Groups) | 61 (Unhealthy for Sensitive Groups) | 73 (Unhealthy for Sensitive Groups) | 51 (Unhealthy for Sensitive Groups) | 93 (Unhealthy) | 75 (Unhealthy for Sensitive Groups) | 58 (Unhealthy for Sensitive Groups) | 63 (Unhealthy for Sensitive Groups) |
| so2 | 11 (Good) | 14 (Good) | 7.2 (Good) | 4.2 (Good) | 5.3 (Good) | 12 (Good) | 13 (Good) | 8 (Good) | 6.2 (Good) | 7.1 (Good) | 6.3 (Good) | 4.2 (Good) | 7.5 (Good) | 10 (Good) | 6 (Good) | 2.9 (Good) | 7.5 (Good) | 7.2 (Good) | 9.3 (Good) | 12 (Good) |
PM10 179 (Very bad Hazardous)
particulate matter (PM10) suspended dustPM2,5 35 (Unhealthy for Sensitive Groups)
particulate matter (PM2.5) dustO3 0.04 (Good)
ozone (O3)NO2 0 (Good)
nitrogen dioxide (NO2)SO2 0 (Good)
sulfur dioxide (SO2)机电学校(启用170322)
| index | 2022-05-27 |
|---|---|
| pm10 | 56 |
| pm25 | 56 |
| o3 | 0.03 |
| no2 | 0 |
| so2 | 0 |
机电学校

| index | 2020-05 | 2020-04 | 2020-03 | 2020-02 | 2020-01 | 2019-12 | 2019-11 | 2019-10 | 2019-09 | 2019-08 | 2019-07 | 2019-06 | 2019-05 | 2019-04 | 2019-03 | 2019-02 | 2019-01 | 2018-12 | 2018-11 | 2018-10 |
|---|---|---|---|---|---|---|---|---|---|---|---|---|---|---|---|---|---|---|---|---|
| pm25 | 31 | 41 | 33 | 31 | 45 | 59 | 46 | 47 | 33 | 30 | 23 | 28 | 42 | 34 | 39 | 39 | 66 | 57 | 41 | 31 |
| co | 685 | 521 | 590 | 516 | 722 | 858 | 664 | 726 | 755 | 622 | 582 | 740 | 896 | 898 | 758 | 762 | 1 | 1 | 980 | 874 |
| no2 | 24 | 46 | 32 | 18 | 28 | 53 | 50 | 39 | 28 | 22 | 19 | 21 | 34 | 36 | 40 | 31 | 42 | 41 | 45 | 51 |
| o3 | 130 | 136 | 89 | 88 | 69 | 78 | 107 | 126 | 160 | 148 | 112 | 113 | 138 | 115 | 99 | 54 | 60 | 49 | 76 | 111 |
| pm10 | 56 | 105 | 70 | 50 | 69 | 112 | 119 | 103 | 80 | 66 | 37 | 46 | 80 | 61 | 73 | 51 | 93 | 75 | 58 | 63 |
| so2 | 11 | 14 | 7.2 | 4.2 | 5.3 | 12 | 13 | 8 | 6.2 | 7.1 | 6.3 | 4.2 | 7.5 | 10 | 6 | 2.9 | 7.5 | 7.2 | 9.3 | 12 |