Air Pollution in Rizhao Shi: Real-time Air Quality Index and smog alert.
Pollution and air quality forecast for Rizhao Shi. Today is Tuesday, June 16, 2026. The following air pollution values have been recorded for Rizhao Shi:- particulate matter (PM10) suspended dust - 179 (Very bad Hazardous)
- particulate matter (PM2.5) dust - 35 (Unhealthy for Sensitive Groups)
- ozone (O3) - 0 (Good)
- nitrogen dioxide (NO2) - 0 (Good)
- sulfur dioxide (SO2) - 0 (Good)

What is the air quality in Rizhao Shi today? Is the air polluted in Rizhao Shi?. Is there smog?
What is the level of PM10 today in Rizhao Shi? (particulate matter (PM10) suspended dust)
The current level of particulate matter PM10 in Rizhao Shi is:
179 (Very bad Hazardous)
The highest PM10 values usually occur in month: 139 (January 2019).
The lowest value of particulate matter PM10 pollution in Rizhao Shi is usually recorded in: August (44).
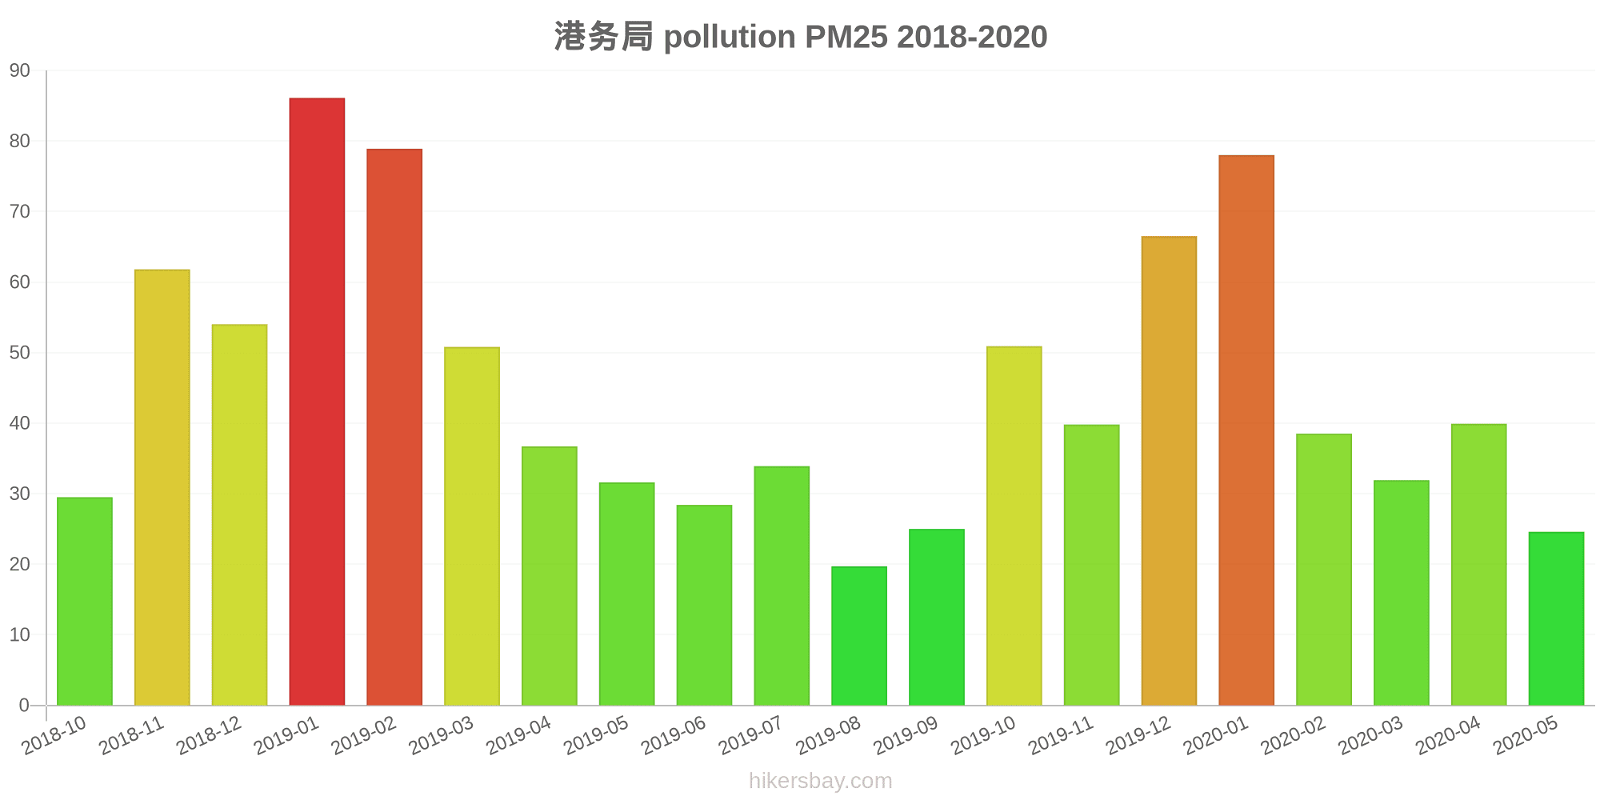
What is the current level of PM2.5 in Rizhao Shi? (particulate matter (PM2.5) dust)
Today's PM2.5 level is:
35 (Unhealthy for Sensitive Groups)
For comparison, the highest level of PM2.5 in Rizhao Shi in the last 7 days was: 56 (Friday, May 27, 2022) and the lowest: 56 (Friday, May 27, 2022).
The highest PM2.5 values were recorded: 86 (January 2019).
The lowest level of particulate matter PM2.5 pollution occurs in month: August (20).
How is the O3 level today in Rizhao Shi? (ozone (O3))
0 (Good)
How high is the level of NO2? (nitrogen dioxide (NO2))
0 (Good)
What is the level of SO2 pollution? (sulfur dioxide (SO2))
0 (Good)
Current data Friday, May 27, 2022, 12:00 PM
PM10 179 (Very bad Hazardous)
PM2,5 35 (Unhealthy for Sensitive Groups)
O3 0 (Good)
NO2 0 (Good)
SO2 0 (Good)
Data on air pollution from recent days in Rizhao Shi
index
2022-05-27
pm10
56
Unhealthy for Sensitive Groups
pm25
56
Unhealthy
o3
0
Good
no2
0
Good
so2
0
Good
data source »
Air pollution in Rizhao Shi from October 2018 to May 2020

index
2020-05
2020-04
2020-03
2020-02
2020-01
2019-12
2019-11
2019-10
2019-09
2019-08
2019-07
2019-06
2019-05
2019-04
2019-03
2019-02
2019-01
2018-12
2018-11
2018-10
pm25
25 (Moderate)
40 (Unhealthy for Sensitive Groups)
32 (Moderate)
39 (Unhealthy for Sensitive Groups)
78 (Very Unhealthy)
67 (Unhealthy)
40 (Unhealthy for Sensitive Groups)
51 (Unhealthy for Sensitive Groups)
25 (Moderate)
20 (Moderate)
34 (Moderate)
28 (Moderate)
32 (Moderate)
37 (Unhealthy for Sensitive Groups)
51 (Unhealthy for Sensitive Groups)
79 (Very Unhealthy)
86 (Very Unhealthy)
54 (Unhealthy for Sensitive Groups)
62 (Unhealthy)
30 (Moderate)
co
435 (Good)
585 (Good)
584 (Good)
621 (Good)
880 (Good)
802 (Good)
437 (Good)
593 (Good)
458 (Good)
418 (Good)
481 (Good)
359 (Good)
437 (Good)
443 (Good)
512 (Good)
913 (Good)
1 (Good)
752 (Good)
648 (Good)
497 (Good)
no2
21 (Good)
39 (Good)
33 (Good)
23 (Good)
33 (Good)
42 (Moderate)
35 (Good)
41 (Moderate)
24 (Good)
21 (Good)
25 (Good)
20 (Good)
29 (Good)
29 (Good)
47 (Moderate)
45 (Moderate)
55 (Moderate)
37 (Good)
45 (Moderate)
39 (Good)
o3
125 (Unhealthy for Sensitive Groups)
137 (Unhealthy for Sensitive Groups)
114 (Moderate)
94 (Moderate)
87 (Moderate)
70 (Good)
93 (Moderate)
127 (Unhealthy for Sensitive Groups)
170 (Unhealthy)
138 (Unhealthy for Sensitive Groups)
157 (Unhealthy)
158 (Unhealthy)
160 (Unhealthy)
121 (Unhealthy for Sensitive Groups)
108 (Moderate)
96 (Moderate)
71 (Moderate)
67 (Good)
100 (Moderate)
107 (Moderate)
pm10
53 (Unhealthy for Sensitive Groups)
89 (Unhealthy)
86 (Unhealthy)
62 (Unhealthy for Sensitive Groups)
106 (Unhealthy)
103 (Unhealthy)
96 (Unhealthy)
111 (Very Unhealthy)
55 (Unhealthy for Sensitive Groups)
44 (Moderate)
71 (Unhealthy for Sensitive Groups)
60 (Unhealthy for Sensitive Groups)
87 (Unhealthy)
84 (Unhealthy)
107 (Unhealthy)
120 (Very Unhealthy)
139 (Very Unhealthy)
101 (Unhealthy)
120 (Very Unhealthy)
76 (Unhealthy for Sensitive Groups)
so2
6.4 (Good)
6.8 (Good)
6.8 (Good)
6.2 (Good)
11 (Good)
8 (Good)
6.9 (Good)
8 (Good)
4.5 (Good)
4.5 (Good)
5.2 (Good)
5.8 (Good)
8 (Good)
6 (Good)
9.9 (Good)
10 (Good)
14 (Good)
8.6 (Good)
7.1 (Good)
8.4 (Good)
data source »
港务局
Friday, May 27, 2022, 12:00 PM
PM10 179 (Very bad Hazardous)
particulate matter (PM10) suspended dust
PM2,5 35 (Unhealthy for Sensitive Groups)
particulate matter (PM2.5) dust
O3 0.04 (Good)
ozone (O3)
NO2 0 (Good)
nitrogen dioxide (NO2)
SO2 0 (Good)
sulfur dioxide (SO2)
港务局
index
2022-05-27
pm10
56
pm25
56
o3
0.03
no2
0
so2
0
港务局
2018-10 2020-05
index
2020-05
2020-04
2020-03
2020-02
2020-01
2019-12
2019-11
2019-10
2019-09
2019-08
2019-07
2019-06
2019-05
2019-04
2019-03
2019-02
2019-01
2018-12
2018-11
2018-10
pm25
25
40
32
39
78
67
40
51
25
20
34
28
32
37
51
79
86
54
62
30
co
435
585
584
621
880
802
437
593
458
418
481
359
437
443
512
913
1
752
648
497
no2
21
39
33
23
33
42
35
41
24
21
25
20
29
29
47
45
55
37
45
39
o3
125
137
114
94
87
70
93
127
170
138
157
158
160
121
108
96
71
67
100
107
pm10
53
89
86
62
106
103
96
111
55
44
71
60
87
84
107
120
139
101
120
76
so2
6.4
6.8
6.8
6.2
11
8
6.9
8
4.5
4.5
5.2
5.8
8
6
9.9
10
14
8.6
7.1
8.4
* Pollution data source:
https://openaq.org
(ChinaAQIData)
The data is licensed under CC-By 4.0
PM10 179 (Very bad Hazardous)
PM2,5 35 (Unhealthy for Sensitive Groups)
O3 0 (Good)
NO2 0 (Good)
SO2 0 (Good)
Data on air pollution from recent days in Rizhao Shi
| index | 2022-05-27 |
|---|---|
| pm10 | 56 Unhealthy for Sensitive Groups |
| pm25 | 56 Unhealthy |
| o3 | 0 Good |
| no2 | 0 Good |
| so2 | 0 Good |

| index | 2020-05 | 2020-04 | 2020-03 | 2020-02 | 2020-01 | 2019-12 | 2019-11 | 2019-10 | 2019-09 | 2019-08 | 2019-07 | 2019-06 | 2019-05 | 2019-04 | 2019-03 | 2019-02 | 2019-01 | 2018-12 | 2018-11 | 2018-10 |
|---|---|---|---|---|---|---|---|---|---|---|---|---|---|---|---|---|---|---|---|---|
| pm25 | 25 (Moderate) | 40 (Unhealthy for Sensitive Groups) | 32 (Moderate) | 39 (Unhealthy for Sensitive Groups) | 78 (Very Unhealthy) | 67 (Unhealthy) | 40 (Unhealthy for Sensitive Groups) | 51 (Unhealthy for Sensitive Groups) | 25 (Moderate) | 20 (Moderate) | 34 (Moderate) | 28 (Moderate) | 32 (Moderate) | 37 (Unhealthy for Sensitive Groups) | 51 (Unhealthy for Sensitive Groups) | 79 (Very Unhealthy) | 86 (Very Unhealthy) | 54 (Unhealthy for Sensitive Groups) | 62 (Unhealthy) | 30 (Moderate) |
| co | 435 (Good) | 585 (Good) | 584 (Good) | 621 (Good) | 880 (Good) | 802 (Good) | 437 (Good) | 593 (Good) | 458 (Good) | 418 (Good) | 481 (Good) | 359 (Good) | 437 (Good) | 443 (Good) | 512 (Good) | 913 (Good) | 1 (Good) | 752 (Good) | 648 (Good) | 497 (Good) |
| no2 | 21 (Good) | 39 (Good) | 33 (Good) | 23 (Good) | 33 (Good) | 42 (Moderate) | 35 (Good) | 41 (Moderate) | 24 (Good) | 21 (Good) | 25 (Good) | 20 (Good) | 29 (Good) | 29 (Good) | 47 (Moderate) | 45 (Moderate) | 55 (Moderate) | 37 (Good) | 45 (Moderate) | 39 (Good) |
| o3 | 125 (Unhealthy for Sensitive Groups) | 137 (Unhealthy for Sensitive Groups) | 114 (Moderate) | 94 (Moderate) | 87 (Moderate) | 70 (Good) | 93 (Moderate) | 127 (Unhealthy for Sensitive Groups) | 170 (Unhealthy) | 138 (Unhealthy for Sensitive Groups) | 157 (Unhealthy) | 158 (Unhealthy) | 160 (Unhealthy) | 121 (Unhealthy for Sensitive Groups) | 108 (Moderate) | 96 (Moderate) | 71 (Moderate) | 67 (Good) | 100 (Moderate) | 107 (Moderate) |
| pm10 | 53 (Unhealthy for Sensitive Groups) | 89 (Unhealthy) | 86 (Unhealthy) | 62 (Unhealthy for Sensitive Groups) | 106 (Unhealthy) | 103 (Unhealthy) | 96 (Unhealthy) | 111 (Very Unhealthy) | 55 (Unhealthy for Sensitive Groups) | 44 (Moderate) | 71 (Unhealthy for Sensitive Groups) | 60 (Unhealthy for Sensitive Groups) | 87 (Unhealthy) | 84 (Unhealthy) | 107 (Unhealthy) | 120 (Very Unhealthy) | 139 (Very Unhealthy) | 101 (Unhealthy) | 120 (Very Unhealthy) | 76 (Unhealthy for Sensitive Groups) |
| so2 | 6.4 (Good) | 6.8 (Good) | 6.8 (Good) | 6.2 (Good) | 11 (Good) | 8 (Good) | 6.9 (Good) | 8 (Good) | 4.5 (Good) | 4.5 (Good) | 5.2 (Good) | 5.8 (Good) | 8 (Good) | 6 (Good) | 9.9 (Good) | 10 (Good) | 14 (Good) | 8.6 (Good) | 7.1 (Good) | 8.4 (Good) |
PM10 179 (Very bad Hazardous)
particulate matter (PM10) suspended dustPM2,5 35 (Unhealthy for Sensitive Groups)
particulate matter (PM2.5) dustO3 0.04 (Good)
ozone (O3)NO2 0 (Good)
nitrogen dioxide (NO2)SO2 0 (Good)
sulfur dioxide (SO2)港务局
| index | 2022-05-27 |
|---|---|
| pm10 | 56 |
| pm25 | 56 |
| o3 | 0.03 |
| no2 | 0 |
| so2 | 0 |
港务局

| index | 2020-05 | 2020-04 | 2020-03 | 2020-02 | 2020-01 | 2019-12 | 2019-11 | 2019-10 | 2019-09 | 2019-08 | 2019-07 | 2019-06 | 2019-05 | 2019-04 | 2019-03 | 2019-02 | 2019-01 | 2018-12 | 2018-11 | 2018-10 |
|---|---|---|---|---|---|---|---|---|---|---|---|---|---|---|---|---|---|---|---|---|
| pm25 | 25 | 40 | 32 | 39 | 78 | 67 | 40 | 51 | 25 | 20 | 34 | 28 | 32 | 37 | 51 | 79 | 86 | 54 | 62 | 30 |
| co | 435 | 585 | 584 | 621 | 880 | 802 | 437 | 593 | 458 | 418 | 481 | 359 | 437 | 443 | 512 | 913 | 1 | 752 | 648 | 497 |
| no2 | 21 | 39 | 33 | 23 | 33 | 42 | 35 | 41 | 24 | 21 | 25 | 20 | 29 | 29 | 47 | 45 | 55 | 37 | 45 | 39 |
| o3 | 125 | 137 | 114 | 94 | 87 | 70 | 93 | 127 | 170 | 138 | 157 | 158 | 160 | 121 | 108 | 96 | 71 | 67 | 100 | 107 |
| pm10 | 53 | 89 | 86 | 62 | 106 | 103 | 96 | 111 | 55 | 44 | 71 | 60 | 87 | 84 | 107 | 120 | 139 | 101 | 120 | 76 |
| so2 | 6.4 | 6.8 | 6.8 | 6.2 | 11 | 8 | 6.9 | 8 | 4.5 | 4.5 | 5.2 | 5.8 | 8 | 6 | 9.9 | 10 | 14 | 8.6 | 7.1 | 8.4 |