Air Pollution in Shenjiaxiang: Real-time Air Quality Index and smog alert.
Pollution and air quality forecast for Shenjiaxiang. Today is Tuesday, June 16, 2026. The following air pollution values have been recorded for Shenjiaxiang:- particulate matter (PM2.5) dust - 61 (Unhealthy)
- nitrogen dioxide (NO2) - 22 (Good)
- particulate matter (PM10) suspended dust - 69 (Unhealthy for Sensitive Groups)
- carbon monoxide (CO) - 219 (Good)
- ozone (O3) - 0 (Good)
- sulfur dioxide (SO2) - 8 (Good)

What is the air quality in Shenjiaxiang today? Is the air polluted in Shenjiaxiang?. Is there smog?
What is the current level of PM2.5 in Shenjiaxiang? (particulate matter (PM2.5) dust)
Today's PM2.5 level is:
61 (Unhealthy)
For comparison, the highest level of PM2.5 in Shenjiaxiang in the last 7 days was: 28 (Friday, May 27, 2022) and the lowest: 28 (Friday, May 27, 2022).
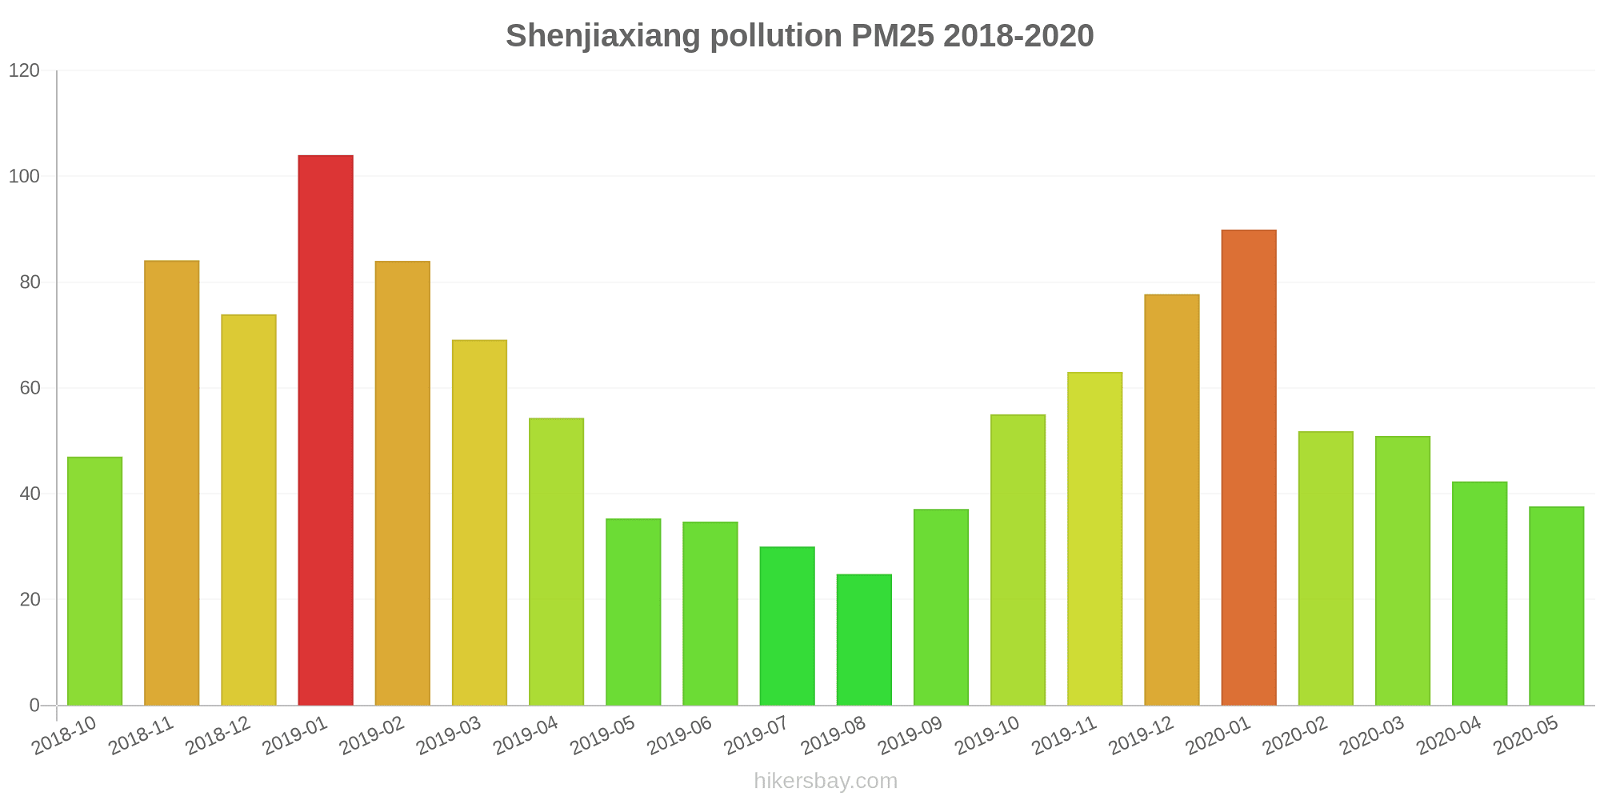
The highest PM2.5 values were recorded: 104 (January 2019).
The lowest level of particulate matter PM2.5 pollution occurs in month: August (25).
How high is the level of NO2? (nitrogen dioxide (NO2))
22 (Good)
What is the level of PM10 today in Shenjiaxiang? (particulate matter (PM10) suspended dust)
The current level of particulate matter PM10 in Shenjiaxiang is:
69 (Unhealthy for Sensitive Groups)
The highest PM10 values usually occur in month: 123 (January 2019).
The lowest value of particulate matter PM10 pollution in Shenjiaxiang is usually recorded in: May (57).
How high is the CO level? (carbon monoxide (CO))
219 (Good)
How is the O3 level today in Shenjiaxiang? (ozone (O3))
0 (Good)
What is the level of SO2 pollution? (sulfur dioxide (SO2))
8 (Good)
Current data Friday, May 27, 2022, 3:00 PM
PM2,5 61 (Unhealthy)
NO2 22 (Good)
PM10 69 (Unhealthy for Sensitive Groups)
CO 219 (Good)
O3 0 (Good)
SO2 8 (Good)
Data on air pollution from recent days in Shenjiaxiang
index
2022-05-27
pm25
28
Moderate
no2
22
Good
pm10
35
Moderate
co
579
Good
o3
22
Good
so2
5
Good
data source »
Air pollution in Shenjiaxiang from October 2018 to May 2020
index
2020-05
2020-04
2020-03
2020-02
2020-01
2019-12
2019-11
2019-10
2019-09
2019-08
2019-07
2019-06
2019-05
2019-04
2019-03
2019-02
2019-01
2018-12
2018-11
2018-10
pm25
38 (Unhealthy for Sensitive Groups)
42 (Unhealthy for Sensitive Groups)
51 (Unhealthy for Sensitive Groups)
52 (Unhealthy for Sensitive Groups)
90 (Very Unhealthy)
78 (Very Unhealthy)
63 (Unhealthy)
55 (Unhealthy)
37 (Unhealthy for Sensitive Groups)
25 (Moderate)
30 (Moderate)
35 (Moderate)
35 (Unhealthy for Sensitive Groups)
54 (Unhealthy for Sensitive Groups)
69 (Unhealthy)
84 (Very Unhealthy)
104 (Very Unhealthy)
74 (Unhealthy)
84 (Very Unhealthy)
47 (Unhealthy for Sensitive Groups)
co
589 (Good)
510 (Good)
607 (Good)
575 (Good)
974 (Good)
814 (Good)
629 (Good)
609 (Good)
816 (Good)
644 (Good)
724 (Good)
757 (Good)
629 (Good)
722 (Good)
623 (Good)
866 (Good)
980 (Good)
848 (Good)
876 (Good)
662 (Good)
no2
20 (Good)
25 (Good)
26 (Good)
18 (Good)
29 (Good)
44 (Moderate)
35 (Good)
27 (Good)
21 (Good)
16 (Good)
16 (Good)
14 (Good)
18 (Good)
22 (Good)
28 (Good)
23 (Good)
35 (Good)
35 (Good)
33 (Good)
25 (Good)
o3
133 (Unhealthy for Sensitive Groups)
133 (Unhealthy for Sensitive Groups)
107 (Moderate)
92 (Moderate)
67 (Good)
66 (Good)
102 (Moderate)
123 (Unhealthy for Sensitive Groups)
157 (Unhealthy)
152 (Unhealthy)
146 (Unhealthy for Sensitive Groups)
172 (Unhealthy)
150 (Unhealthy)
124 (Unhealthy for Sensitive Groups)
118 (Moderate)
82 (Moderate)
70 (Good)
62 (Good)
99 (Moderate)
127 (Unhealthy for Sensitive Groups)
pm10
57 (Unhealthy for Sensitive Groups)
72 (Unhealthy for Sensitive Groups)
84 (Unhealthy)
66 (Unhealthy for Sensitive Groups)
106 (Unhealthy)
103 (Unhealthy)
103 (Unhealthy)
110 (Very Unhealthy)
77 (Unhealthy for Sensitive Groups)
63 (Unhealthy for Sensitive Groups)
68 (Unhealthy for Sensitive Groups)
89 (Unhealthy)
99 (Unhealthy)
109 (Unhealthy)
120 (Very Unhealthy)
97 (Unhealthy)
123 (Very Unhealthy)
96 (Unhealthy)
116 (Very Unhealthy)
86 (Unhealthy)
so2
7.1 (Good)
11 (Good)
9.7 (Good)
7.6 (Good)
9.8 (Good)
12 (Good)
17 (Good)
14 (Good)
14 (Good)
16 (Good)
17 (Good)
15 (Good)
13 (Good)
10 (Good)
17 (Good)
18 (Good)
17 (Good)
15 (Good)
15 (Good)
16 (Good)
data source »
Huainan Ba Gong Shan Qu Zheng Fu
Friday, May 27, 2022, 3:00 PM
PM2,5 61 (Unhealthy)
particulate matter (PM2.5) dust
NO2 22 (Good)
nitrogen dioxide (NO2)
PM10 69 (Unhealthy for Sensitive Groups)
particulate matter (PM10) suspended dust
CO 219 (Good)
carbon monoxide (CO)
O3 0.05 (Good)
ozone (O3)
SO2 7.7 (Good)
sulfur dioxide (SO2)
Huainan Ba Gong Shan Qu Zheng Fu
index
2022-05-27
pm25
28
no2
22
pm10
35
co
579
o3
22
so2
4.6
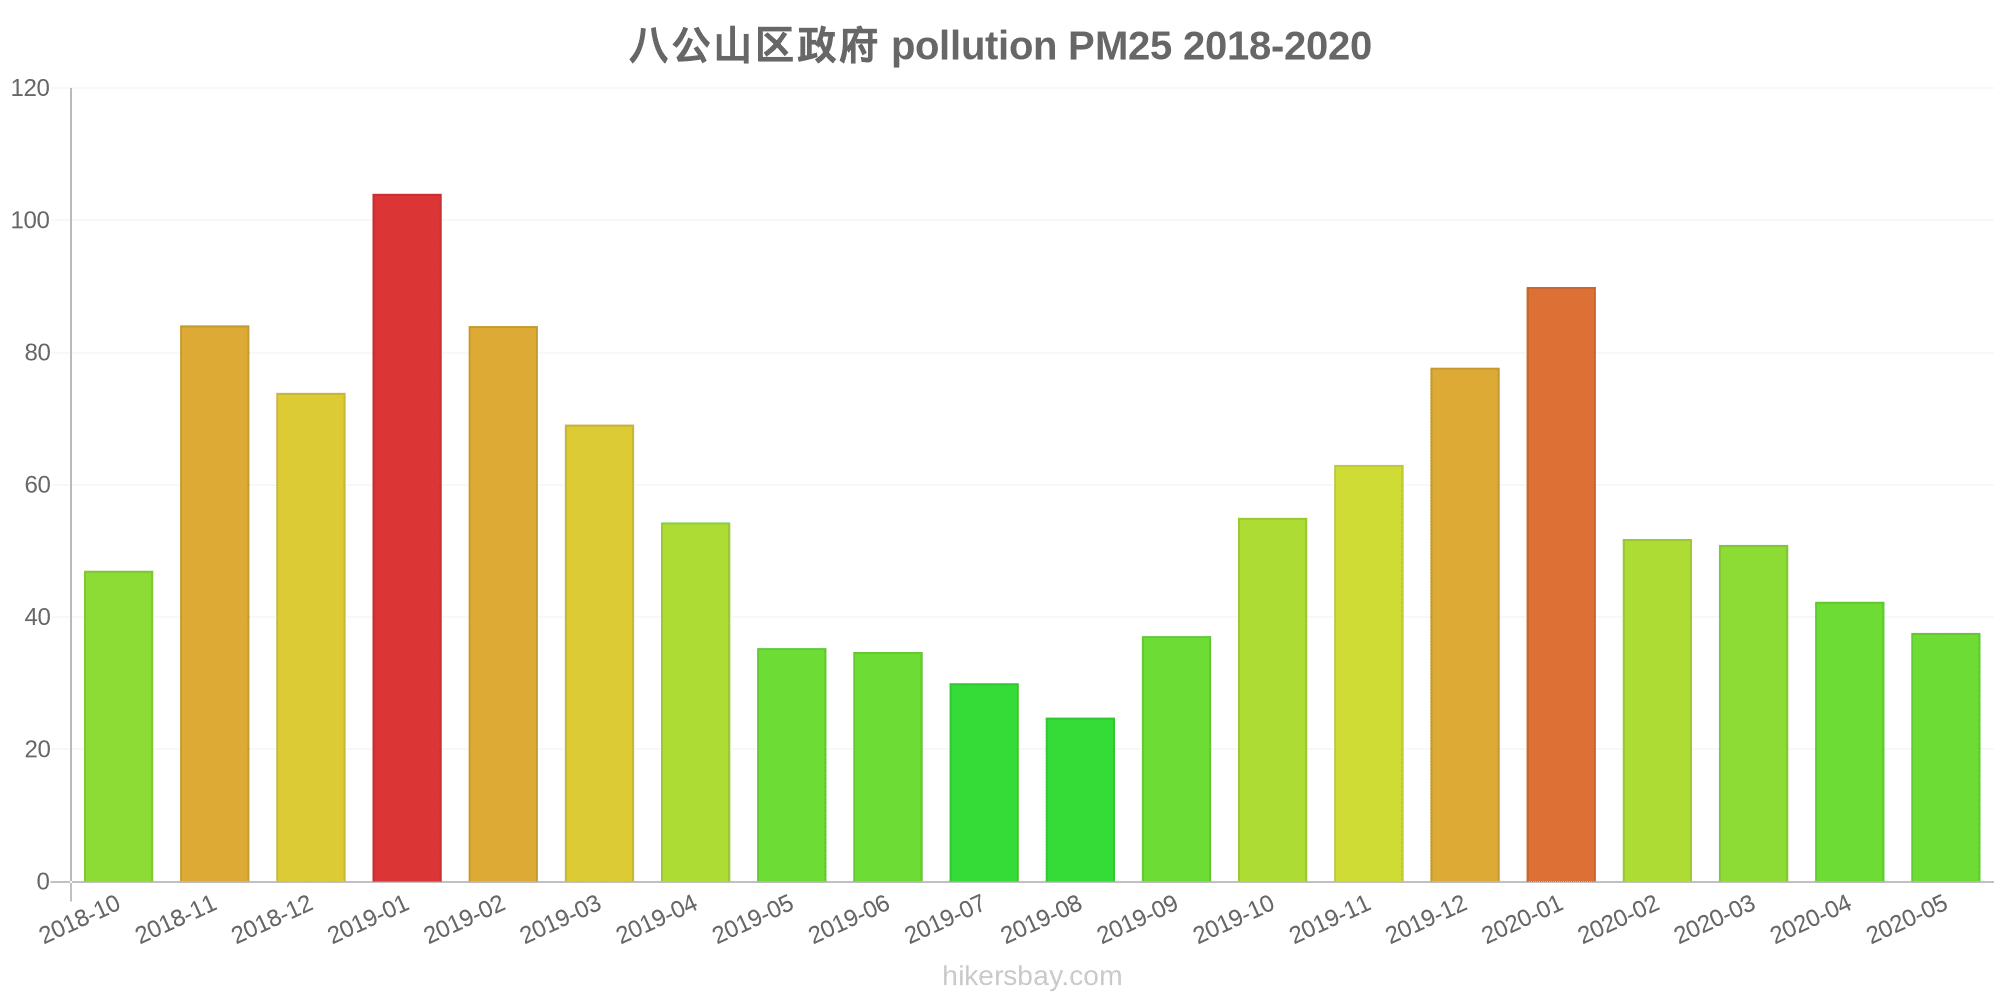
八公山区政府
2018-10 2020-05

index
2020-05
2020-04
2020-03
2020-02
2020-01
2019-12
2019-11
2019-10
2019-09
2019-08
2019-07
2019-06
2019-05
2019-04
2019-03
2019-02
2019-01
2018-12
2018-11
2018-10
pm25
38
42
51
52
90
78
63
55
37
25
30
35
35
54
69
84
104
74
84
47
co
589
510
607
575
974
814
629
609
816
644
724
757
629
722
623
866
980
848
876
662
no2
20
25
26
18
29
44
35
27
21
16
16
14
18
22
28
23
35
35
33
25
o3
133
133
107
92
67
66
102
123
157
152
146
172
150
124
118
82
70
62
99
127
pm10
57
72
84
66
106
103
103
110
77
63
68
89
99
109
120
97
123
96
116
86
so2
7.1
11
9.7
7.6
9.8
12
17
14
14
16
17
15
13
10
17
18
17
15
15
16
* Pollution data source:
https://openaq.org
(ChinaAQIData)
The data is licensed under CC-By 4.0
PM2,5 61 (Unhealthy)
NO2 22 (Good)
PM10 69 (Unhealthy for Sensitive Groups)
CO 219 (Good)
O3 0 (Good)
SO2 8 (Good)
Data on air pollution from recent days in Shenjiaxiang
| index | 2022-05-27 |
|---|---|
| pm25 | 28 Moderate |
| no2 | 22 Good |
| pm10 | 35 Moderate |
| co | 579 Good |
| o3 | 22 Good |
| so2 | 5 Good |

| index | 2020-05 | 2020-04 | 2020-03 | 2020-02 | 2020-01 | 2019-12 | 2019-11 | 2019-10 | 2019-09 | 2019-08 | 2019-07 | 2019-06 | 2019-05 | 2019-04 | 2019-03 | 2019-02 | 2019-01 | 2018-12 | 2018-11 | 2018-10 |
|---|---|---|---|---|---|---|---|---|---|---|---|---|---|---|---|---|---|---|---|---|
| pm25 | 38 (Unhealthy for Sensitive Groups) | 42 (Unhealthy for Sensitive Groups) | 51 (Unhealthy for Sensitive Groups) | 52 (Unhealthy for Sensitive Groups) | 90 (Very Unhealthy) | 78 (Very Unhealthy) | 63 (Unhealthy) | 55 (Unhealthy) | 37 (Unhealthy for Sensitive Groups) | 25 (Moderate) | 30 (Moderate) | 35 (Moderate) | 35 (Unhealthy for Sensitive Groups) | 54 (Unhealthy for Sensitive Groups) | 69 (Unhealthy) | 84 (Very Unhealthy) | 104 (Very Unhealthy) | 74 (Unhealthy) | 84 (Very Unhealthy) | 47 (Unhealthy for Sensitive Groups) |
| co | 589 (Good) | 510 (Good) | 607 (Good) | 575 (Good) | 974 (Good) | 814 (Good) | 629 (Good) | 609 (Good) | 816 (Good) | 644 (Good) | 724 (Good) | 757 (Good) | 629 (Good) | 722 (Good) | 623 (Good) | 866 (Good) | 980 (Good) | 848 (Good) | 876 (Good) | 662 (Good) |
| no2 | 20 (Good) | 25 (Good) | 26 (Good) | 18 (Good) | 29 (Good) | 44 (Moderate) | 35 (Good) | 27 (Good) | 21 (Good) | 16 (Good) | 16 (Good) | 14 (Good) | 18 (Good) | 22 (Good) | 28 (Good) | 23 (Good) | 35 (Good) | 35 (Good) | 33 (Good) | 25 (Good) |
| o3 | 133 (Unhealthy for Sensitive Groups) | 133 (Unhealthy for Sensitive Groups) | 107 (Moderate) | 92 (Moderate) | 67 (Good) | 66 (Good) | 102 (Moderate) | 123 (Unhealthy for Sensitive Groups) | 157 (Unhealthy) | 152 (Unhealthy) | 146 (Unhealthy for Sensitive Groups) | 172 (Unhealthy) | 150 (Unhealthy) | 124 (Unhealthy for Sensitive Groups) | 118 (Moderate) | 82 (Moderate) | 70 (Good) | 62 (Good) | 99 (Moderate) | 127 (Unhealthy for Sensitive Groups) |
| pm10 | 57 (Unhealthy for Sensitive Groups) | 72 (Unhealthy for Sensitive Groups) | 84 (Unhealthy) | 66 (Unhealthy for Sensitive Groups) | 106 (Unhealthy) | 103 (Unhealthy) | 103 (Unhealthy) | 110 (Very Unhealthy) | 77 (Unhealthy for Sensitive Groups) | 63 (Unhealthy for Sensitive Groups) | 68 (Unhealthy for Sensitive Groups) | 89 (Unhealthy) | 99 (Unhealthy) | 109 (Unhealthy) | 120 (Very Unhealthy) | 97 (Unhealthy) | 123 (Very Unhealthy) | 96 (Unhealthy) | 116 (Very Unhealthy) | 86 (Unhealthy) |
| so2 | 7.1 (Good) | 11 (Good) | 9.7 (Good) | 7.6 (Good) | 9.8 (Good) | 12 (Good) | 17 (Good) | 14 (Good) | 14 (Good) | 16 (Good) | 17 (Good) | 15 (Good) | 13 (Good) | 10 (Good) | 17 (Good) | 18 (Good) | 17 (Good) | 15 (Good) | 15 (Good) | 16 (Good) |
PM2,5 61 (Unhealthy)
particulate matter (PM2.5) dustNO2 22 (Good)
nitrogen dioxide (NO2)PM10 69 (Unhealthy for Sensitive Groups)
particulate matter (PM10) suspended dustCO 219 (Good)
carbon monoxide (CO)O3 0.05 (Good)
ozone (O3)SO2 7.7 (Good)
sulfur dioxide (SO2)Huainan Ba Gong Shan Qu Zheng Fu
| index | 2022-05-27 |
|---|---|
| pm25 | 28 |
| no2 | 22 |
| pm10 | 35 |
| co | 579 |
| o3 | 22 |
| so2 | 4.6 |
八公山区政府
| index | 2020-05 | 2020-04 | 2020-03 | 2020-02 | 2020-01 | 2019-12 | 2019-11 | 2019-10 | 2019-09 | 2019-08 | 2019-07 | 2019-06 | 2019-05 | 2019-04 | 2019-03 | 2019-02 | 2019-01 | 2018-12 | 2018-11 | 2018-10 |
|---|---|---|---|---|---|---|---|---|---|---|---|---|---|---|---|---|---|---|---|---|
| pm25 | 38 | 42 | 51 | 52 | 90 | 78 | 63 | 55 | 37 | 25 | 30 | 35 | 35 | 54 | 69 | 84 | 104 | 74 | 84 | 47 |
| co | 589 | 510 | 607 | 575 | 974 | 814 | 629 | 609 | 816 | 644 | 724 | 757 | 629 | 722 | 623 | 866 | 980 | 848 | 876 | 662 |
| no2 | 20 | 25 | 26 | 18 | 29 | 44 | 35 | 27 | 21 | 16 | 16 | 14 | 18 | 22 | 28 | 23 | 35 | 35 | 33 | 25 |
| o3 | 133 | 133 | 107 | 92 | 67 | 66 | 102 | 123 | 157 | 152 | 146 | 172 | 150 | 124 | 118 | 82 | 70 | 62 | 99 | 127 |
| pm10 | 57 | 72 | 84 | 66 | 106 | 103 | 103 | 110 | 77 | 63 | 68 | 89 | 99 | 109 | 120 | 97 | 123 | 96 | 116 | 86 |
| so2 | 7.1 | 11 | 9.7 | 7.6 | 9.8 | 12 | 17 | 14 | 14 | 16 | 17 | 15 | 13 | 10 | 17 | 18 | 17 | 15 | 15 | 16 |