Air Pollution in Tongchuanshi: Real-time Air Quality Index and smog alert.
Pollution and air quality forecast for Tongchuanshi. Today is Tuesday, June 2, 2026. The following air pollution values have been recorded for Tongchuanshi:- particulate matter (PM2.5) dust - 61 (Unhealthy)
- nitrogen dioxide (NO2) - 22 (Good)
- particulate matter (PM10) suspended dust - 69 (Unhealthy for Sensitive Groups)
- carbon monoxide (CO) - 219 (Good)
- ozone (O3) - 0 (Good)
- sulfur dioxide (SO2) - 8 (Good)

What is the air quality in Tongchuanshi today? Is the air polluted in Tongchuanshi?. Is there smog?
What is the current level of PM2.5 in Tongchuanshi? (particulate matter (PM2.5) dust)
Today's PM2.5 level is:
61 (Unhealthy)
For comparison, the highest level of PM2.5 in Tongchuanshi in the last 7 days was: 28 (Friday, May 27, 2022) and the lowest: 28 (Friday, May 27, 2022).
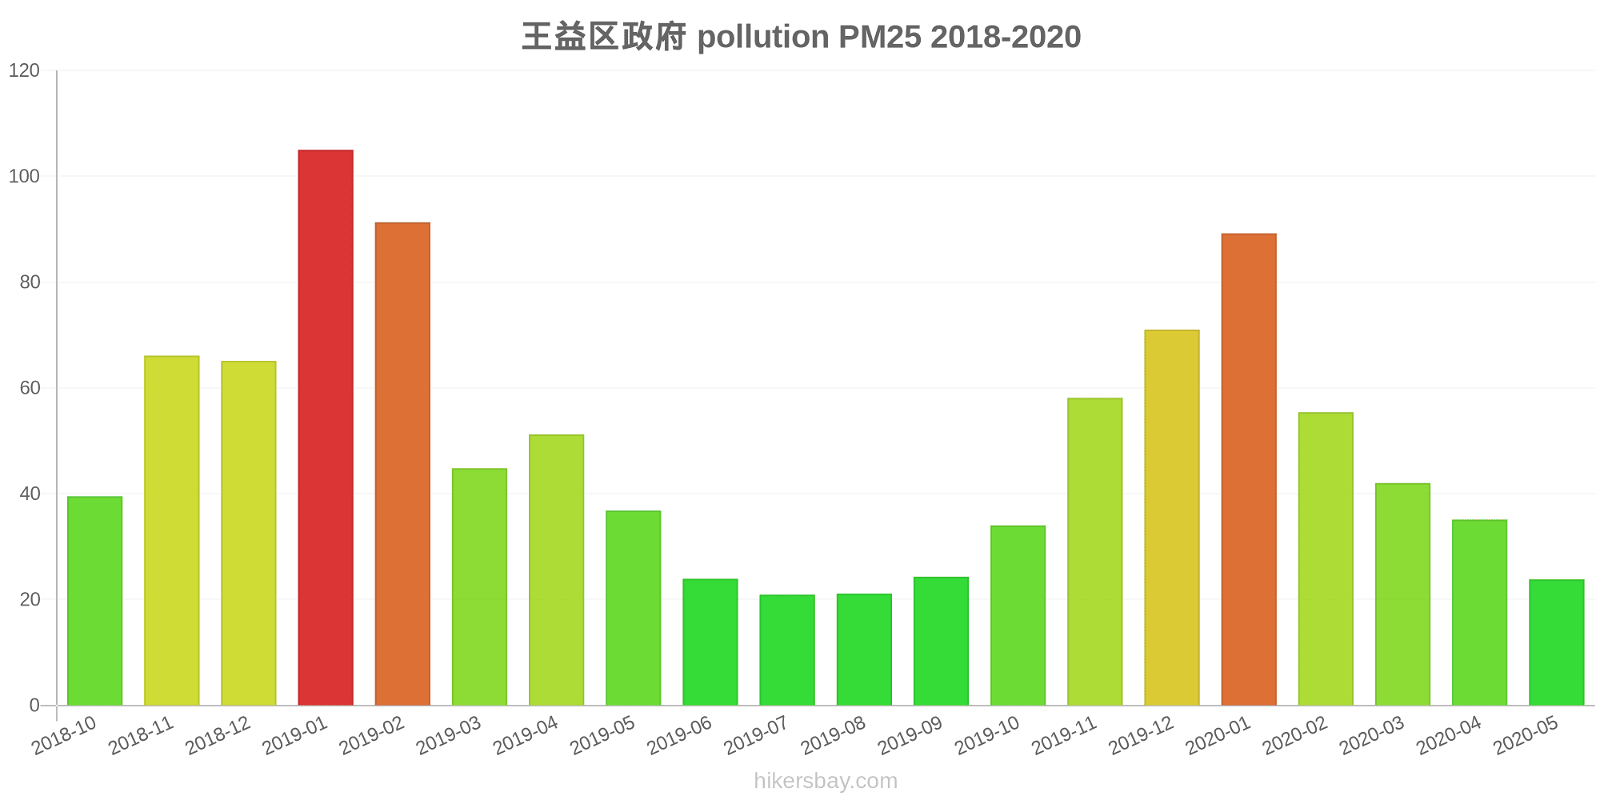
The highest PM2.5 values were recorded: 105 (January 2019).
The lowest level of particulate matter PM2.5 pollution occurs in month: July (21).
How high is the level of NO2? (nitrogen dioxide (NO2))
22 (Good)
What is the level of PM10 today in Tongchuanshi? (particulate matter (PM10) suspended dust)
The current level of particulate matter PM10 in Tongchuanshi is:
69 (Unhealthy for Sensitive Groups)
The highest PM10 values usually occur in month: 139 (January 2019).
The lowest value of particulate matter PM10 pollution in Tongchuanshi is usually recorded in: August (44).
How high is the CO level? (carbon monoxide (CO))
219 (Good)
How is the O3 level today in Tongchuanshi? (ozone (O3))
0 (Good)
What is the level of SO2 pollution? (sulfur dioxide (SO2))
8 (Good)
Current data Friday, May 27, 2022, 3:00 PM
PM2,5 61 (Unhealthy)
NO2 22 (Good)
PM10 69 (Unhealthy for Sensitive Groups)
CO 219 (Good)
O3 0 (Good)
SO2 8 (Good)
Data on air pollution from recent days in Tongchuanshi
index
2022-05-27
pm25
28
Moderate
no2
22
Good
pm10
35
Moderate
co
579
Good
o3
22
Good
so2
5
Good
data source »
Air pollution in Tongchuanshi from October 2018 to May 2020

index
2020-05
2020-04
2020-03
2020-02
2020-01
2019-12
2019-11
2019-10
2019-09
2019-08
2019-07
2019-06
2019-05
2019-04
2019-03
2019-02
2019-01
2018-12
2018-11
2018-10
pm25
24 (Moderate)
35 (Unhealthy for Sensitive Groups)
42 (Unhealthy for Sensitive Groups)
55 (Unhealthy)
89 (Very Unhealthy)
71 (Unhealthy)
58 (Unhealthy)
34 (Moderate)
24 (Moderate)
21 (Moderate)
21 (Moderate)
24 (Moderate)
37 (Unhealthy for Sensitive Groups)
51 (Unhealthy for Sensitive Groups)
45 (Unhealthy for Sensitive Groups)
91 (Very Unhealthy)
105 (Very Unhealthy)
65 (Unhealthy)
66 (Unhealthy)
40 (Unhealthy for Sensitive Groups)
co
562 (Good)
622 (Good)
650 (Good)
1 (Good)
1 (Good)
1 (Good)
975 (Good)
843 (Good)
690 (Good)
678 (Good)
601 (Good)
599 (Good)
543 (Good)
798 (Good)
775 (Good)
1 (Good)
1 (Good)
1 (Good)
1 (Good)
984 (Good)
no2
24 (Good)
36 (Good)
31 (Good)
27 (Good)
38 (Good)
50 (Moderate)
44 (Moderate)
35 (Good)
32 (Good)
25 (Good)
27 (Good)
28 (Good)
32 (Good)
36 (Good)
40 (Good)
30 (Good)
64 (Moderate)
50 (Moderate)
53 (Moderate)
40 (Moderate)
o3
150 (Unhealthy)
128 (Unhealthy for Sensitive Groups)
107 (Moderate)
103 (Moderate)
82 (Moderate)
70 (Moderate)
73 (Moderate)
87 (Moderate)
129 (Unhealthy for Sensitive Groups)
136 (Unhealthy for Sensitive Groups)
159 (Unhealthy)
160 (Unhealthy)
140 (Unhealthy for Sensitive Groups)
131 (Unhealthy for Sensitive Groups)
123 (Unhealthy for Sensitive Groups)
100 (Moderate)
74 (Moderate)
56 (Good)
74 (Moderate)
93 (Moderate)
pm10
55 (Unhealthy for Sensitive Groups)
68 (Unhealthy for Sensitive Groups)
84 (Unhealthy)
79 (Unhealthy for Sensitive Groups)
98 (Unhealthy)
98 (Unhealthy)
93 (Unhealthy)
69 (Unhealthy for Sensitive Groups)
46 (Moderate)
44 (Moderate)
47 (Moderate)
53 (Unhealthy for Sensitive Groups)
108 (Unhealthy)
101 (Unhealthy)
95 (Unhealthy)
117 (Very Unhealthy)
139 (Very Unhealthy)
131 (Very Unhealthy)
121 (Very Unhealthy)
76 (Unhealthy for Sensitive Groups)
so2
15 (Good)
22 (Good)
12 (Good)
10 (Good)
15 (Good)
20 (Good)
15 (Good)
8.2 (Good)
8.2 (Good)
8 (Good)
9.4 (Good)
12 (Good)
12 (Good)
12 (Good)
14 (Good)
17 (Good)
26 (Good)
30 (Good)
26 (Good)
22 (Good)
data source »
王益区政府
Friday, May 27, 2022, 3:00 PM
PM2,5 61 (Unhealthy)
particulate matter (PM2.5) dust
NO2 22 (Good)
nitrogen dioxide (NO2)
PM10 69 (Unhealthy for Sensitive Groups)
particulate matter (PM10) suspended dust
CO 219 (Good)
carbon monoxide (CO)
O3 0.05 (Good)
ozone (O3)
SO2 7.7 (Good)
sulfur dioxide (SO2)
王益区政府
index
2022-05-27
pm25
28
no2
22
pm10
35
co
579
o3
22
so2
4.6
王益区政府
2018-10 2020-05
index
2020-05
2020-04
2020-03
2020-02
2020-01
2019-12
2019-11
2019-10
2019-09
2019-08
2019-07
2019-06
2019-05
2019-04
2019-03
2019-02
2019-01
2018-12
2018-11
2018-10
pm25
24
35
42
55
89
71
58
34
24
21
21
24
37
51
45
91
105
65
66
40
co
562
622
650
1
1
1
975
843
690
678
601
599
543
798
775
1
1
1
1
984
no2
24
36
31
27
38
50
44
35
32
25
27
28
32
36
40
30
64
50
53
40
o3
150
128
107
103
82
70
73
87
129
136
159
160
140
131
123
100
74
56
74
93
pm10
55
68
84
79
98
98
93
69
46
44
47
53
108
101
95
117
139
131
121
76
so2
15
22
12
10
15
20
15
8.2
8.2
8
9.4
12
12
12
14
17
26
30
26
22
* Pollution data source:
https://openaq.org
(ChinaAQIData)
The data is licensed under CC-By 4.0
PM2,5 61 (Unhealthy)
NO2 22 (Good)
PM10 69 (Unhealthy for Sensitive Groups)
CO 219 (Good)
O3 0 (Good)
SO2 8 (Good)
Data on air pollution from recent days in Tongchuanshi
| index | 2022-05-27 |
|---|---|
| pm25 | 28 Moderate |
| no2 | 22 Good |
| pm10 | 35 Moderate |
| co | 579 Good |
| o3 | 22 Good |
| so2 | 5 Good |

| index | 2020-05 | 2020-04 | 2020-03 | 2020-02 | 2020-01 | 2019-12 | 2019-11 | 2019-10 | 2019-09 | 2019-08 | 2019-07 | 2019-06 | 2019-05 | 2019-04 | 2019-03 | 2019-02 | 2019-01 | 2018-12 | 2018-11 | 2018-10 |
|---|---|---|---|---|---|---|---|---|---|---|---|---|---|---|---|---|---|---|---|---|
| pm25 | 24 (Moderate) | 35 (Unhealthy for Sensitive Groups) | 42 (Unhealthy for Sensitive Groups) | 55 (Unhealthy) | 89 (Very Unhealthy) | 71 (Unhealthy) | 58 (Unhealthy) | 34 (Moderate) | 24 (Moderate) | 21 (Moderate) | 21 (Moderate) | 24 (Moderate) | 37 (Unhealthy for Sensitive Groups) | 51 (Unhealthy for Sensitive Groups) | 45 (Unhealthy for Sensitive Groups) | 91 (Very Unhealthy) | 105 (Very Unhealthy) | 65 (Unhealthy) | 66 (Unhealthy) | 40 (Unhealthy for Sensitive Groups) |
| co | 562 (Good) | 622 (Good) | 650 (Good) | 1 (Good) | 1 (Good) | 1 (Good) | 975 (Good) | 843 (Good) | 690 (Good) | 678 (Good) | 601 (Good) | 599 (Good) | 543 (Good) | 798 (Good) | 775 (Good) | 1 (Good) | 1 (Good) | 1 (Good) | 1 (Good) | 984 (Good) |
| no2 | 24 (Good) | 36 (Good) | 31 (Good) | 27 (Good) | 38 (Good) | 50 (Moderate) | 44 (Moderate) | 35 (Good) | 32 (Good) | 25 (Good) | 27 (Good) | 28 (Good) | 32 (Good) | 36 (Good) | 40 (Good) | 30 (Good) | 64 (Moderate) | 50 (Moderate) | 53 (Moderate) | 40 (Moderate) |
| o3 | 150 (Unhealthy) | 128 (Unhealthy for Sensitive Groups) | 107 (Moderate) | 103 (Moderate) | 82 (Moderate) | 70 (Moderate) | 73 (Moderate) | 87 (Moderate) | 129 (Unhealthy for Sensitive Groups) | 136 (Unhealthy for Sensitive Groups) | 159 (Unhealthy) | 160 (Unhealthy) | 140 (Unhealthy for Sensitive Groups) | 131 (Unhealthy for Sensitive Groups) | 123 (Unhealthy for Sensitive Groups) | 100 (Moderate) | 74 (Moderate) | 56 (Good) | 74 (Moderate) | 93 (Moderate) |
| pm10 | 55 (Unhealthy for Sensitive Groups) | 68 (Unhealthy for Sensitive Groups) | 84 (Unhealthy) | 79 (Unhealthy for Sensitive Groups) | 98 (Unhealthy) | 98 (Unhealthy) | 93 (Unhealthy) | 69 (Unhealthy for Sensitive Groups) | 46 (Moderate) | 44 (Moderate) | 47 (Moderate) | 53 (Unhealthy for Sensitive Groups) | 108 (Unhealthy) | 101 (Unhealthy) | 95 (Unhealthy) | 117 (Very Unhealthy) | 139 (Very Unhealthy) | 131 (Very Unhealthy) | 121 (Very Unhealthy) | 76 (Unhealthy for Sensitive Groups) |
| so2 | 15 (Good) | 22 (Good) | 12 (Good) | 10 (Good) | 15 (Good) | 20 (Good) | 15 (Good) | 8.2 (Good) | 8.2 (Good) | 8 (Good) | 9.4 (Good) | 12 (Good) | 12 (Good) | 12 (Good) | 14 (Good) | 17 (Good) | 26 (Good) | 30 (Good) | 26 (Good) | 22 (Good) |
PM2,5 61 (Unhealthy)
particulate matter (PM2.5) dustNO2 22 (Good)
nitrogen dioxide (NO2)PM10 69 (Unhealthy for Sensitive Groups)
particulate matter (PM10) suspended dustCO 219 (Good)
carbon monoxide (CO)O3 0.05 (Good)
ozone (O3)SO2 7.7 (Good)
sulfur dioxide (SO2)王益区政府
| index | 2022-05-27 |
|---|---|
| pm25 | 28 |
| no2 | 22 |
| pm10 | 35 |
| co | 579 |
| o3 | 22 |
| so2 | 4.6 |
王益区政府

| index | 2020-05 | 2020-04 | 2020-03 | 2020-02 | 2020-01 | 2019-12 | 2019-11 | 2019-10 | 2019-09 | 2019-08 | 2019-07 | 2019-06 | 2019-05 | 2019-04 | 2019-03 | 2019-02 | 2019-01 | 2018-12 | 2018-11 | 2018-10 |
|---|---|---|---|---|---|---|---|---|---|---|---|---|---|---|---|---|---|---|---|---|
| pm25 | 24 | 35 | 42 | 55 | 89 | 71 | 58 | 34 | 24 | 21 | 21 | 24 | 37 | 51 | 45 | 91 | 105 | 65 | 66 | 40 |
| co | 562 | 622 | 650 | 1 | 1 | 1 | 975 | 843 | 690 | 678 | 601 | 599 | 543 | 798 | 775 | 1 | 1 | 1 | 1 | 984 |
| no2 | 24 | 36 | 31 | 27 | 38 | 50 | 44 | 35 | 32 | 25 | 27 | 28 | 32 | 36 | 40 | 30 | 64 | 50 | 53 | 40 |
| o3 | 150 | 128 | 107 | 103 | 82 | 70 | 73 | 87 | 129 | 136 | 159 | 160 | 140 | 131 | 123 | 100 | 74 | 56 | 74 | 93 |
| pm10 | 55 | 68 | 84 | 79 | 98 | 98 | 93 | 69 | 46 | 44 | 47 | 53 | 108 | 101 | 95 | 117 | 139 | 131 | 121 | 76 |
| so2 | 15 | 22 | 12 | 10 | 15 | 20 | 15 | 8.2 | 8.2 | 8 | 9.4 | 12 | 12 | 12 | 14 | 17 | 26 | 30 | 26 | 22 |