Air Pollution in Shiyan Shi: Real-time Air Quality Index and smog alert.
Pollution and air quality forecast for Shiyan Shi. Today is Tuesday, June 2, 2026. The following air pollution values have been recorded for Shiyan Shi:- particulate matter (PM2.5) dust - 61 (Unhealthy)
- nitrogen dioxide (NO2) - 22 (Good)
- particulate matter (PM10) suspended dust - 69 (Unhealthy for Sensitive Groups)
- carbon monoxide (CO) - 219 (Good)
- ozone (O3) - 0 (Good)
- sulfur dioxide (SO2) - 8 (Good)

What is the air quality in Shiyan Shi today? Is the air polluted in Shiyan Shi?. Is there smog?
What is the current level of PM2.5 in Shiyan Shi? (particulate matter (PM2.5) dust)
Today's PM2.5 level is:
61 (Unhealthy)
For comparison, the highest level of PM2.5 in Shiyan Shi in the last 7 days was: 28 (Friday, May 27, 2022) and the lowest: 28 (Friday, May 27, 2022).
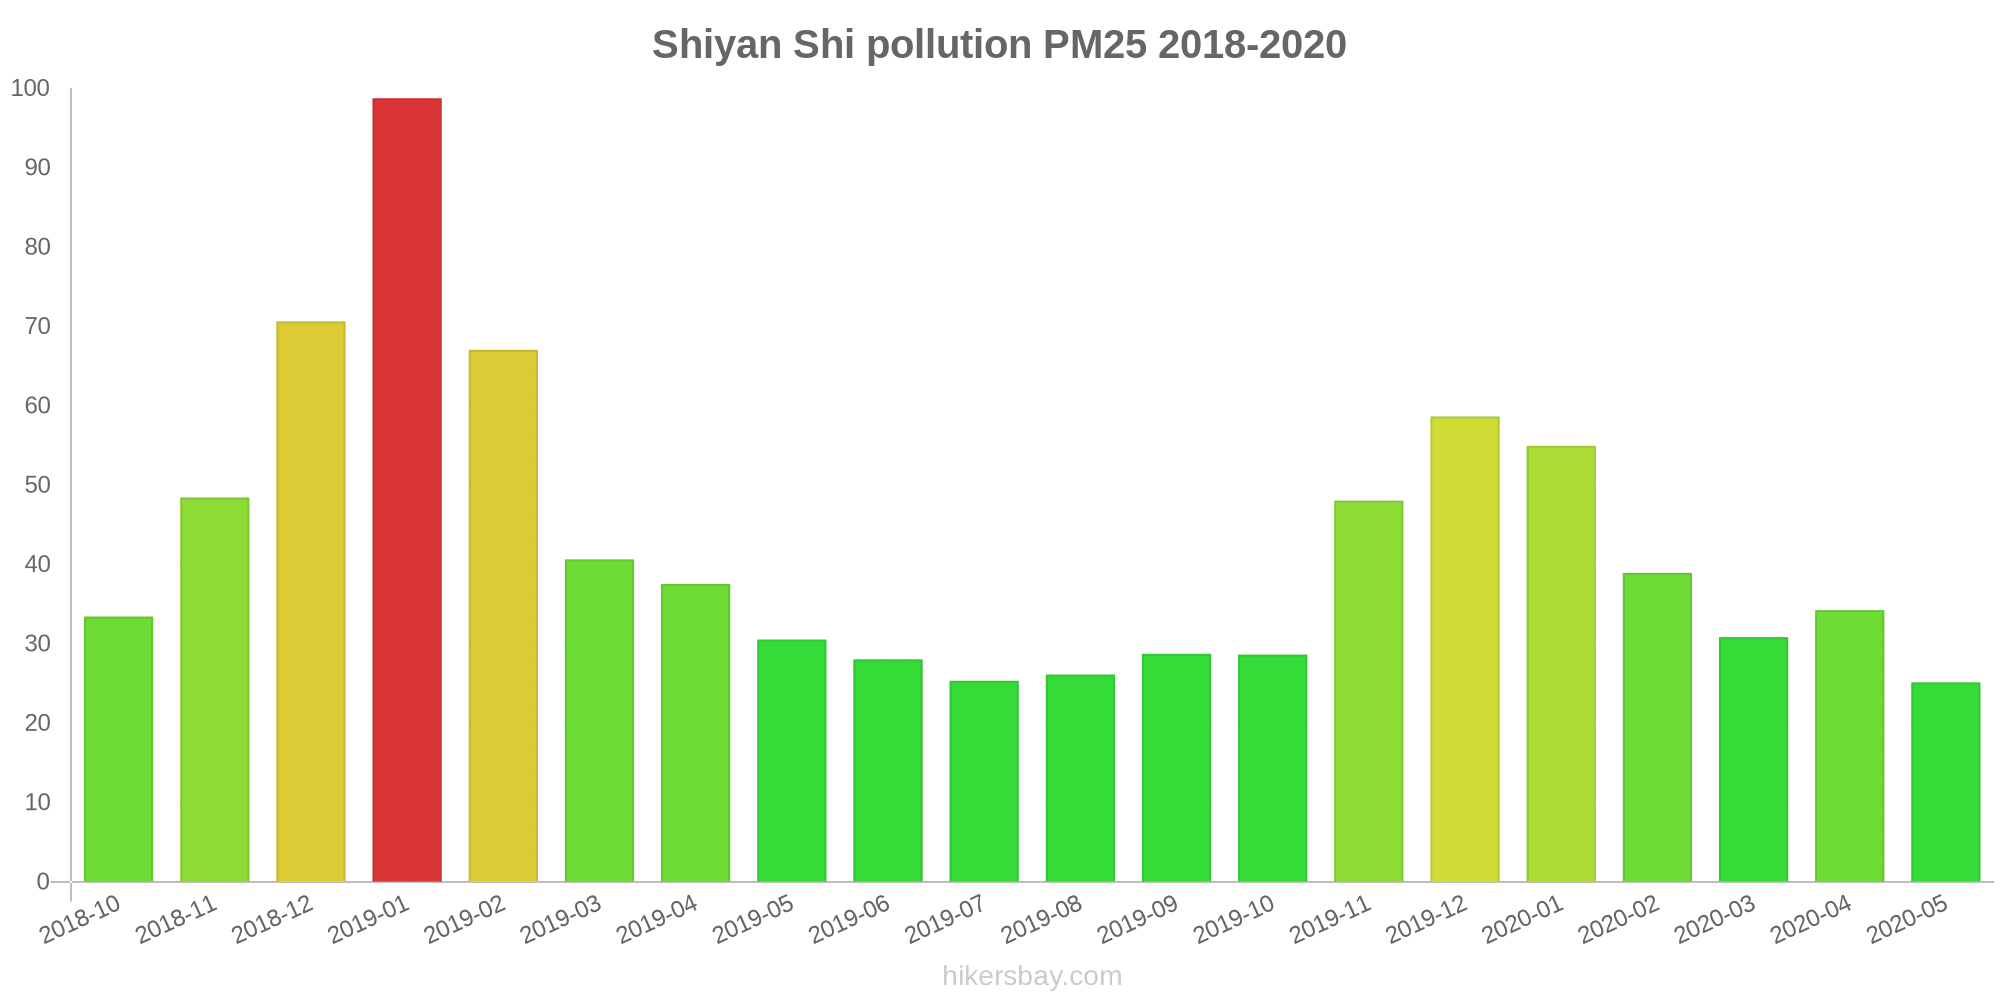
The highest PM2.5 values were recorded: 99 (January 2019).
The lowest level of particulate matter PM2.5 pollution occurs in month: May (25).
How high is the level of NO2? (nitrogen dioxide (NO2))
22 (Good)
What is the level of PM10 today in Shiyan Shi? (particulate matter (PM10) suspended dust)
The current level of particulate matter PM10 in Shiyan Shi is:
69 (Unhealthy for Sensitive Groups)
The highest PM10 values usually occur in month: 147 (January 2019).
The lowest value of particulate matter PM10 pollution in Shiyan Shi is usually recorded in: July (43).
How high is the CO level? (carbon monoxide (CO))
219 (Good)
How is the O3 level today in Shiyan Shi? (ozone (O3))
0 (Good)
What is the level of SO2 pollution? (sulfur dioxide (SO2))
8 (Good)
Current data Friday, May 27, 2022, 3:00 PM
PM2,5 61 (Unhealthy)
NO2 22 (Good)
PM10 69 (Unhealthy for Sensitive Groups)
CO 219 (Good)
O3 0 (Good)
SO2 8 (Good)
Data on air pollution from recent days in Shiyan Shi
index
2022-05-27
pm25
28
Moderate
no2
22
Good
pm10
35
Moderate
co
579
Good
o3
22
Good
so2
5
Good
data source »
Air pollution in Shiyan Shi from October 2018 to May 2020

index
2020-05
2020-04
2020-03
2020-02
2020-01
2019-12
2019-11
2019-10
2019-09
2019-08
2019-07
2019-06
2019-05
2019-04
2019-03
2019-02
2019-01
2018-12
2018-11
2018-10
pm25
25 (Moderate)
34 (Moderate)
31 (Moderate)
39 (Unhealthy for Sensitive Groups)
55 (Unhealthy for Sensitive Groups)
59 (Unhealthy)
48 (Unhealthy for Sensitive Groups)
29 (Moderate)
29 (Moderate)
26 (Moderate)
25 (Moderate)
28 (Moderate)
31 (Moderate)
38 (Unhealthy for Sensitive Groups)
41 (Unhealthy for Sensitive Groups)
67 (Unhealthy)
99 (Very Unhealthy)
71 (Unhealthy)
48 (Unhealthy for Sensitive Groups)
33 (Moderate)
co
863 (Good)
952 (Good)
1 (Good)
1 (Good)
1 (Good)
1 (Good)
1 (Good)
1 (Good)
1 (Good)
935 (Good)
787 (Good)
815 (Good)
853 (Good)
904 (Good)
1 (Good)
1 (Good)
1 (Good)
1 (Good)
1 (Good)
890 (Good)
no2
20 (Good)
27 (Good)
18 (Good)
12 (Good)
27 (Good)
41 (Moderate)
38 (Good)
28 (Good)
28 (Good)
24 (Good)
22 (Good)
25 (Good)
27 (Good)
32 (Good)
36 (Good)
31 (Good)
53 (Moderate)
45 (Moderate)
42 (Moderate)
38 (Good)
o3
126 (Unhealthy for Sensitive Groups)
115 (Moderate)
108 (Moderate)
87 (Moderate)
66 (Good)
57 (Good)
70 (Good)
81 (Moderate)
118 (Moderate)
132 (Unhealthy for Sensitive Groups)
141 (Unhealthy for Sensitive Groups)
136 (Unhealthy for Sensitive Groups)
129 (Unhealthy for Sensitive Groups)
98 (Moderate)
90 (Moderate)
75 (Moderate)
58 (Good)
46 (Good)
67 (Good)
82 (Moderate)
pm10
49 (Moderate)
59 (Unhealthy for Sensitive Groups)
61 (Unhealthy for Sensitive Groups)
52 (Unhealthy for Sensitive Groups)
74 (Unhealthy for Sensitive Groups)
96 (Unhealthy)
87 (Unhealthy)
50 (Moderate)
52 (Unhealthy for Sensitive Groups)
50 (Unhealthy for Sensitive Groups)
43 (Moderate)
50 (Unhealthy for Sensitive Groups)
68 (Unhealthy for Sensitive Groups)
73 (Unhealthy for Sensitive Groups)
86 (Unhealthy)
105 (Unhealthy)
147 (Very Unhealthy)
129 (Very Unhealthy)
96 (Unhealthy)
66 (Unhealthy for Sensitive Groups)
so2
6.4 (Good)
7.4 (Good)
6.1 (Good)
4.7 (Good)
6.5 (Good)
8.7 (Good)
7.3 (Good)
5.6 (Good)
4.9 (Good)
7.3 (Good)
8.1 (Good)
7.8 (Good)
8.5 (Good)
11 (Good)
13 (Good)
12 (Good)
16 (Good)
16 (Good)
14 (Good)
15 (Good)
data source »
Quality of life in Shiyan Shi
Green and Parks in the City
Shiyan Shi
35%
Mongolia: 27%
Bhutan: 82%
Hong Kong: 52%
Myanmar: 33%
particulate matter PM2.5
Shiyan Shi
70 (Unhealthy)
Pleasure of spending time in the city
Shiyan Shi
17%
Mongolia: 22%
Bhutan: 61%
Hong Kong: 43%
Myanmar: 24%
particulate matter PM10
Shiyan Shi
130 (Very Unhealthy)
Air Pollution
Shiyan Shi
94%
Mongolia: 87%
Bhutan: 45%
Hong Kong: 67%
Myanmar: 83%
Garbage Disposal
Shiyan Shi
50%
Mongolia: 27%
Bhutan: 47%
Hong Kong: 52%
Myanmar: 12%
Availability and quality of drinking water
Shiyan Shi
35%
Mongolia: 46%
Bhutan: 64%
Hong Kong: 66%
Myanmar: 34%
Cleanliness and tidiness
Shiyan Shi
29%
Mongolia: 29%
Bhutan: 57%
Hong Kong: 54%
Myanmar: 18%
Noise and Light pollution
Shiyan Shi
65%
Mongolia: 48%
Bhutan: 55%
Hong Kong: 66%
Myanmar: 52%
Water Pollution
Shiyan Shi
72%
Mongolia: 68%
Bhutan: 56%
Hong Kong: 53%
Myanmar: 74%
Source: Numbeo
滨河新村
Friday, May 27, 2022, 3:00 PM
PM2,5 61 (Unhealthy)
particulate matter (PM2.5) dust
NO2 22 (Good)
nitrogen dioxide (NO2)
PM10 69 (Unhealthy for Sensitive Groups)
particulate matter (PM10) suspended dust
CO 219 (Good)
carbon monoxide (CO)
O3 0.05 (Good)
ozone (O3)
SO2 7.7 (Good)
sulfur dioxide (SO2)
滨河新村
index
2022-05-27
pm25
28
no2
22
pm10
35
co
579
o3
22
so2
4.6
滨河新村
2018-10 2020-05

index
2020-05
2020-04
2020-03
2020-02
2020-01
2019-12
2019-11
2019-10
2019-09
2019-08
2019-07
2019-06
2019-05
2019-04
2019-03
2019-02
2019-01
2018-12
2018-11
2018-10
pm25
25
34
31
39
55
59
48
29
29
26
25
28
31
38
41
67
99
71
48
33
co
863
952
1
1
1
1
1
1
1
935
787
815
853
904
1
1
1
1
1
890
no2
20
27
18
12
27
41
38
28
28
24
22
25
27
32
36
31
53
45
42
38
o3
126
115
108
87
66
57
70
81
118
132
141
136
129
98
90
75
58
46
67
82
pm10
49
59
61
52
74
96
87
50
52
50
43
50
68
73
86
105
147
129
96
66
so2
6.4
7.4
6.1
4.7
6.5
8.7
7.3
5.6
4.9
7.3
8.1
7.8
8.5
11
13
12
16
16
14
15
* Pollution data source:
https://openaq.org
(ChinaAQIData)
The data is licensed under CC-By 4.0
PM2,5 61 (Unhealthy)
NO2 22 (Good)
PM10 69 (Unhealthy for Sensitive Groups)
CO 219 (Good)
O3 0 (Good)
SO2 8 (Good)
Data on air pollution from recent days in Shiyan Shi
| index | 2022-05-27 |
|---|---|
| pm25 | 28 Moderate |
| no2 | 22 Good |
| pm10 | 35 Moderate |
| co | 579 Good |
| o3 | 22 Good |
| so2 | 5 Good |
| index | 2020-05 | 2020-04 | 2020-03 | 2020-02 | 2020-01 | 2019-12 | 2019-11 | 2019-10 | 2019-09 | 2019-08 | 2019-07 | 2019-06 | 2019-05 | 2019-04 | 2019-03 | 2019-02 | 2019-01 | 2018-12 | 2018-11 | 2018-10 |
|---|---|---|---|---|---|---|---|---|---|---|---|---|---|---|---|---|---|---|---|---|
| pm25 | 25 (Moderate) | 34 (Moderate) | 31 (Moderate) | 39 (Unhealthy for Sensitive Groups) | 55 (Unhealthy for Sensitive Groups) | 59 (Unhealthy) | 48 (Unhealthy for Sensitive Groups) | 29 (Moderate) | 29 (Moderate) | 26 (Moderate) | 25 (Moderate) | 28 (Moderate) | 31 (Moderate) | 38 (Unhealthy for Sensitive Groups) | 41 (Unhealthy for Sensitive Groups) | 67 (Unhealthy) | 99 (Very Unhealthy) | 71 (Unhealthy) | 48 (Unhealthy for Sensitive Groups) | 33 (Moderate) |
| co | 863 (Good) | 952 (Good) | 1 (Good) | 1 (Good) | 1 (Good) | 1 (Good) | 1 (Good) | 1 (Good) | 1 (Good) | 935 (Good) | 787 (Good) | 815 (Good) | 853 (Good) | 904 (Good) | 1 (Good) | 1 (Good) | 1 (Good) | 1 (Good) | 1 (Good) | 890 (Good) |
| no2 | 20 (Good) | 27 (Good) | 18 (Good) | 12 (Good) | 27 (Good) | 41 (Moderate) | 38 (Good) | 28 (Good) | 28 (Good) | 24 (Good) | 22 (Good) | 25 (Good) | 27 (Good) | 32 (Good) | 36 (Good) | 31 (Good) | 53 (Moderate) | 45 (Moderate) | 42 (Moderate) | 38 (Good) |
| o3 | 126 (Unhealthy for Sensitive Groups) | 115 (Moderate) | 108 (Moderate) | 87 (Moderate) | 66 (Good) | 57 (Good) | 70 (Good) | 81 (Moderate) | 118 (Moderate) | 132 (Unhealthy for Sensitive Groups) | 141 (Unhealthy for Sensitive Groups) | 136 (Unhealthy for Sensitive Groups) | 129 (Unhealthy for Sensitive Groups) | 98 (Moderate) | 90 (Moderate) | 75 (Moderate) | 58 (Good) | 46 (Good) | 67 (Good) | 82 (Moderate) |
| pm10 | 49 (Moderate) | 59 (Unhealthy for Sensitive Groups) | 61 (Unhealthy for Sensitive Groups) | 52 (Unhealthy for Sensitive Groups) | 74 (Unhealthy for Sensitive Groups) | 96 (Unhealthy) | 87 (Unhealthy) | 50 (Moderate) | 52 (Unhealthy for Sensitive Groups) | 50 (Unhealthy for Sensitive Groups) | 43 (Moderate) | 50 (Unhealthy for Sensitive Groups) | 68 (Unhealthy for Sensitive Groups) | 73 (Unhealthy for Sensitive Groups) | 86 (Unhealthy) | 105 (Unhealthy) | 147 (Very Unhealthy) | 129 (Very Unhealthy) | 96 (Unhealthy) | 66 (Unhealthy for Sensitive Groups) |
| so2 | 6.4 (Good) | 7.4 (Good) | 6.1 (Good) | 4.7 (Good) | 6.5 (Good) | 8.7 (Good) | 7.3 (Good) | 5.6 (Good) | 4.9 (Good) | 7.3 (Good) | 8.1 (Good) | 7.8 (Good) | 8.5 (Good) | 11 (Good) | 13 (Good) | 12 (Good) | 16 (Good) | 16 (Good) | 14 (Good) | 15 (Good) |
Green and Parks in the City
Shiyan Shi 35%
Mongolia: 27% Bhutan: 82% Hong Kong: 52% Myanmar: 33%particulate matter PM2.5
Shiyan Shi 70 (Unhealthy)
Pleasure of spending time in the city
Shiyan Shi 17%
Mongolia: 22% Bhutan: 61% Hong Kong: 43% Myanmar: 24%particulate matter PM10
Shiyan Shi 130 (Very Unhealthy)
Air Pollution
Shiyan Shi 94%
Mongolia: 87% Bhutan: 45% Hong Kong: 67% Myanmar: 83%Garbage Disposal
Shiyan Shi 50%
Mongolia: 27% Bhutan: 47% Hong Kong: 52% Myanmar: 12%Availability and quality of drinking water
Shiyan Shi 35%
Mongolia: 46% Bhutan: 64% Hong Kong: 66% Myanmar: 34%Cleanliness and tidiness
Shiyan Shi 29%
Mongolia: 29% Bhutan: 57% Hong Kong: 54% Myanmar: 18%Noise and Light pollution
Shiyan Shi 65%
Mongolia: 48% Bhutan: 55% Hong Kong: 66% Myanmar: 52%Water Pollution
Shiyan Shi 72%
Mongolia: 68% Bhutan: 56% Hong Kong: 53% Myanmar: 74%PM2,5 61 (Unhealthy)
particulate matter (PM2.5) dustNO2 22 (Good)
nitrogen dioxide (NO2)PM10 69 (Unhealthy for Sensitive Groups)
particulate matter (PM10) suspended dustCO 219 (Good)
carbon monoxide (CO)O3 0.05 (Good)
ozone (O3)SO2 7.7 (Good)
sulfur dioxide (SO2)滨河新村
| index | 2022-05-27 |
|---|---|
| pm25 | 28 |
| no2 | 22 |
| pm10 | 35 |
| co | 579 |
| o3 | 22 |
| so2 | 4.6 |
滨河新村

| index | 2020-05 | 2020-04 | 2020-03 | 2020-02 | 2020-01 | 2019-12 | 2019-11 | 2019-10 | 2019-09 | 2019-08 | 2019-07 | 2019-06 | 2019-05 | 2019-04 | 2019-03 | 2019-02 | 2019-01 | 2018-12 | 2018-11 | 2018-10 |
|---|---|---|---|---|---|---|---|---|---|---|---|---|---|---|---|---|---|---|---|---|
| pm25 | 25 | 34 | 31 | 39 | 55 | 59 | 48 | 29 | 29 | 26 | 25 | 28 | 31 | 38 | 41 | 67 | 99 | 71 | 48 | 33 |
| co | 863 | 952 | 1 | 1 | 1 | 1 | 1 | 1 | 1 | 935 | 787 | 815 | 853 | 904 | 1 | 1 | 1 | 1 | 1 | 890 |
| no2 | 20 | 27 | 18 | 12 | 27 | 41 | 38 | 28 | 28 | 24 | 22 | 25 | 27 | 32 | 36 | 31 | 53 | 45 | 42 | 38 |
| o3 | 126 | 115 | 108 | 87 | 66 | 57 | 70 | 81 | 118 | 132 | 141 | 136 | 129 | 98 | 90 | 75 | 58 | 46 | 67 | 82 |
| pm10 | 49 | 59 | 61 | 52 | 74 | 96 | 87 | 50 | 52 | 50 | 43 | 50 | 68 | 73 | 86 | 105 | 147 | 129 | 96 | 66 |
| so2 | 6.4 | 7.4 | 6.1 | 4.7 | 6.5 | 8.7 | 7.3 | 5.6 | 4.9 | 7.3 | 8.1 | 7.8 | 8.5 | 11 | 13 | 12 | 16 | 16 | 14 | 15 |