Air Pollution in Sucao: Real-time Air Quality Index and smog alert.
Pollution and air quality forecast for Sucao. Today is Tuesday, June 2, 2026. The following air pollution values have been recorded for Sucao:- particulate matter (PM2.5) dust - 61 (Unhealthy)
- nitrogen dioxide (NO2) - 22 (Good)
- particulate matter (PM10) suspended dust - 69 (Unhealthy for Sensitive Groups)
- carbon monoxide (CO) - 219 (Good)
- ozone (O3) - 0 (Good)
- sulfur dioxide (SO2) - 8 (Good)

What is the air quality in Sucao today? Is the air polluted in Sucao?. Is there smog?
What is the current level of PM2.5 in Sucao? (particulate matter (PM2.5) dust)
Today's PM2.5 level is:
61 (Unhealthy)
For comparison, the highest level of PM2.5 in Sucao in the last 7 days was: 28 (Friday, May 27, 2022) and the lowest: 28 (Friday, May 27, 2022).
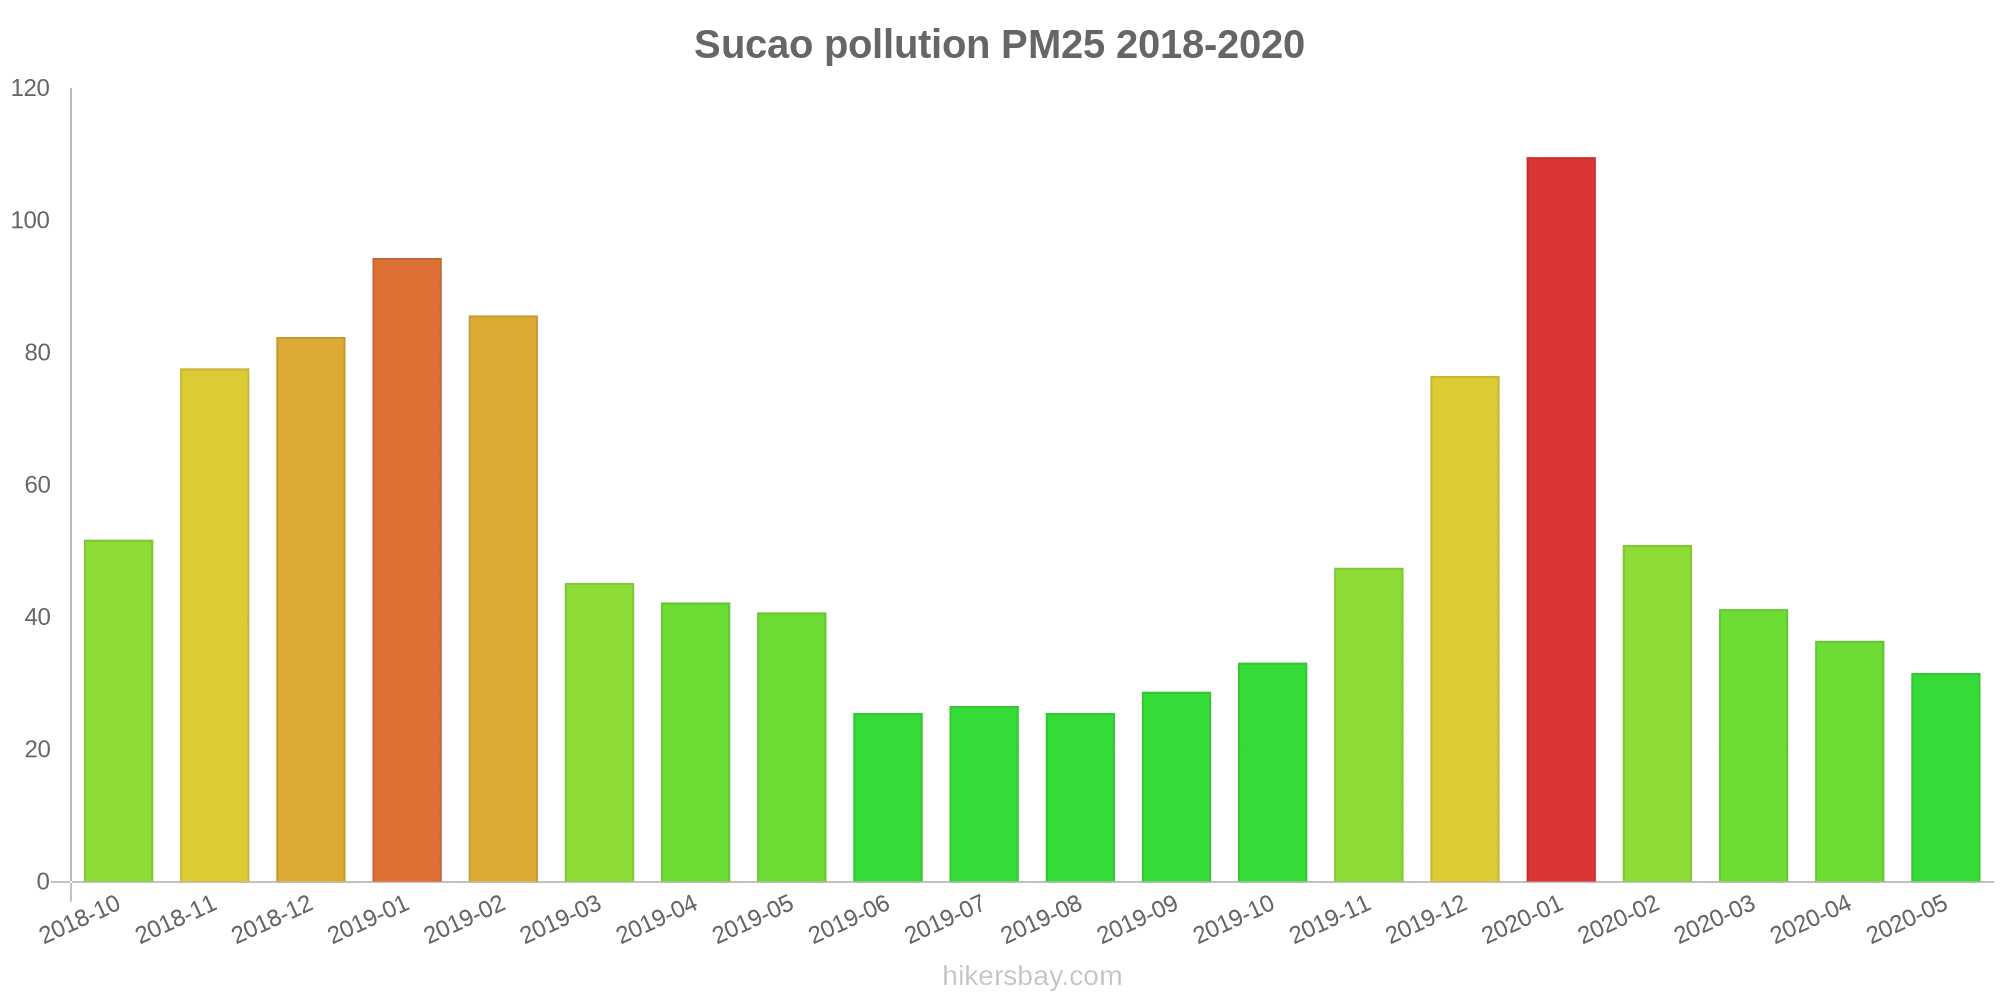
The highest PM2.5 values were recorded: 110 (January 2020).
The lowest level of particulate matter PM2.5 pollution occurs in month: August (26).
How high is the level of NO2? (nitrogen dioxide (NO2))
22 (Good)
What is the level of PM10 today in Sucao? (particulate matter (PM10) suspended dust)
The current level of particulate matter PM10 in Sucao is:
69 (Unhealthy for Sensitive Groups)
The highest PM10 values usually occur in month: 154 (November 2018).
The lowest value of particulate matter PM10 pollution in Sucao is usually recorded in: August (52).
How high is the CO level? (carbon monoxide (CO))
219 (Good)
How is the O3 level today in Sucao? (ozone (O3))
0 (Good)
What is the level of SO2 pollution? (sulfur dioxide (SO2))
8 (Good)
Current data Friday, May 27, 2022, 3:00 PM
PM2,5 61 (Unhealthy)
NO2 22 (Good)
PM10 69 (Unhealthy for Sensitive Groups)
CO 219 (Good)
O3 0 (Good)
SO2 8 (Good)
Data on air pollution from recent days in Sucao
index
2022-05-27
pm25
28
Moderate
no2
22
Good
pm10
35
Moderate
co
579
Good
o3
22
Good
so2
5
Good
data source »
Air pollution in Sucao from October 2018 to May 2020

index
2020-05
2020-04
2020-03
2020-02
2020-01
2019-12
2019-11
2019-10
2019-09
2019-08
2019-07
2019-06
2019-05
2019-04
2019-03
2019-02
2019-01
2018-12
2018-11
2018-10
pm25
32 (Moderate)
36 (Unhealthy for Sensitive Groups)
41 (Unhealthy for Sensitive Groups)
51 (Unhealthy for Sensitive Groups)
110 (Very Unhealthy)
76 (Very Unhealthy)
47 (Unhealthy for Sensitive Groups)
33 (Moderate)
29 (Moderate)
26 (Moderate)
27 (Moderate)
26 (Moderate)
41 (Unhealthy for Sensitive Groups)
42 (Unhealthy for Sensitive Groups)
45 (Unhealthy for Sensitive Groups)
86 (Very Unhealthy)
94 (Very Unhealthy)
82 (Very Unhealthy)
78 (Very Unhealthy)
52 (Unhealthy for Sensitive Groups)
co
656 (Good)
678 (Good)
766 (Good)
1 (Good)
1 (Good)
1.5 (Good)
1 (Good)
475 (Good)
310 (Good)
721 (Good)
547 (Good)
578 (Good)
665 (Good)
780 (Good)
484 (Good)
1 (Good)
1.5 (Good)
1 (Good)
1 (Good)
1 (Good)
no2
21 (Good)
29 (Good)
30 (Good)
24 (Good)
45 (Moderate)
50 (Moderate)
45 (Moderate)
35 (Good)
28 (Good)
21 (Good)
20 (Good)
20 (Good)
22 (Good)
29 (Good)
31 (Good)
34 (Good)
51 (Moderate)
47 (Moderate)
47 (Moderate)
42 (Moderate)
o3
150 (Unhealthy for Sensitive Groups)
132 (Unhealthy for Sensitive Groups)
115 (Moderate)
96 (Moderate)
76 (Moderate)
61 (Good)
82 (Moderate)
92 (Moderate)
138 (Unhealthy for Sensitive Groups)
137 (Unhealthy for Sensitive Groups)
164 (Unhealthy)
170 (Unhealthy)
156 (Unhealthy)
133 (Unhealthy for Sensitive Groups)
123 (Unhealthy for Sensitive Groups)
88 (Moderate)
71 (Moderate)
56 (Good)
79 (Moderate)
97 (Moderate)
pm10
65 (Unhealthy for Sensitive Groups)
83 (Unhealthy)
96 (Unhealthy)
90 (Unhealthy)
150 (Very bad Hazardous)
127 (Very Unhealthy)
110 (Very Unhealthy)
79 (Unhealthy for Sensitive Groups)
62 (Unhealthy for Sensitive Groups)
52 (Unhealthy for Sensitive Groups)
60 (Unhealthy for Sensitive Groups)
65 (Unhealthy for Sensitive Groups)
109 (Unhealthy)
97 (Unhealthy)
103 (Unhealthy)
142 (Very Unhealthy)
153 (Very bad Hazardous)
147 (Very Unhealthy)
154 (Very bad Hazardous)
110 (Very Unhealthy)
so2
14 (Good)
13 (Good)
12 (Good)
13 (Good)
20 (Good)
17 (Good)
14 (Good)
13 (Good)
12 (Good)
7.3 (Good)
8.6 (Good)
11 (Good)
14 (Good)
13 (Good)
13 (Good)
17 (Good)
31 (Good)
30 (Good)
25 (Good)
19 (Good)
data source »
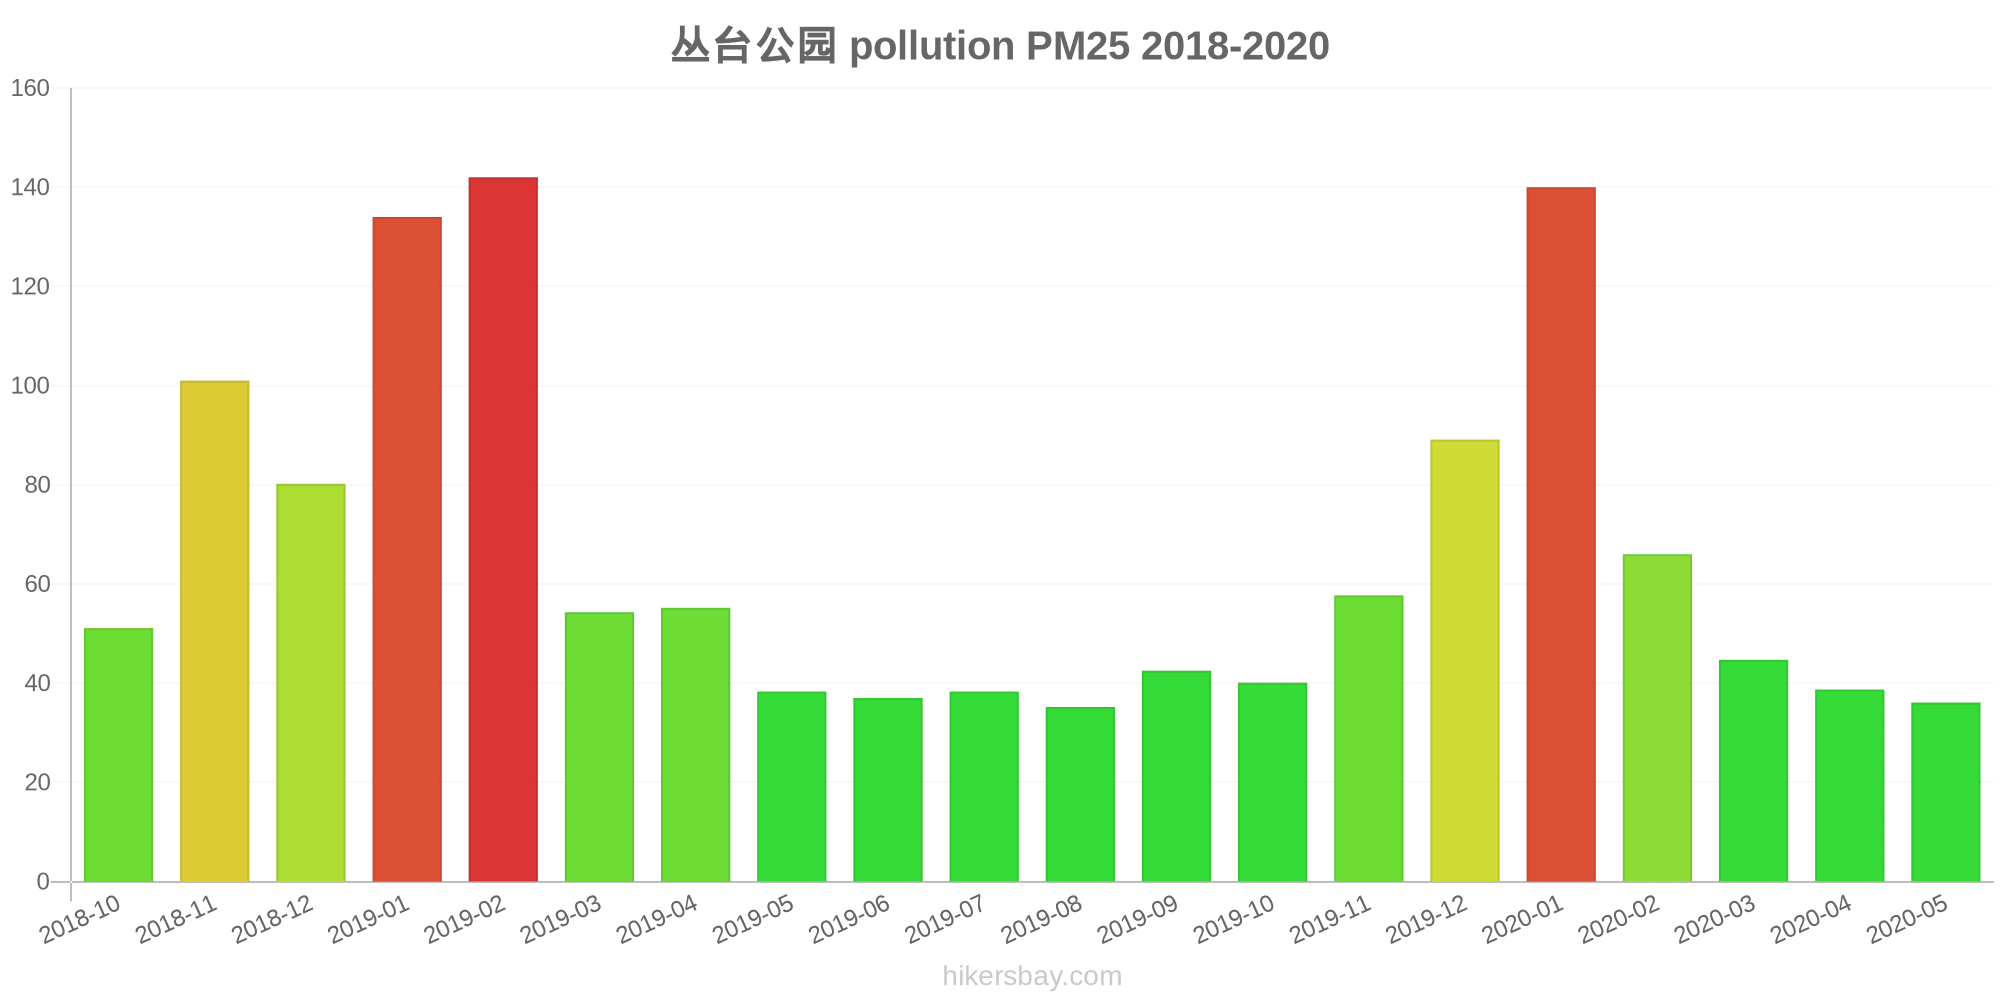
丛台公园
Friday, May 27, 2022, 3:00 PM
PM2,5 61 (Unhealthy)
particulate matter (PM2.5) dust
NO2 22 (Good)
nitrogen dioxide (NO2)
PM10 69 (Unhealthy for Sensitive Groups)
particulate matter (PM10) suspended dust
CO 219 (Good)
carbon monoxide (CO)
O3 0.05 (Good)
ozone (O3)
SO2 7.7 (Good)
sulfur dioxide (SO2)
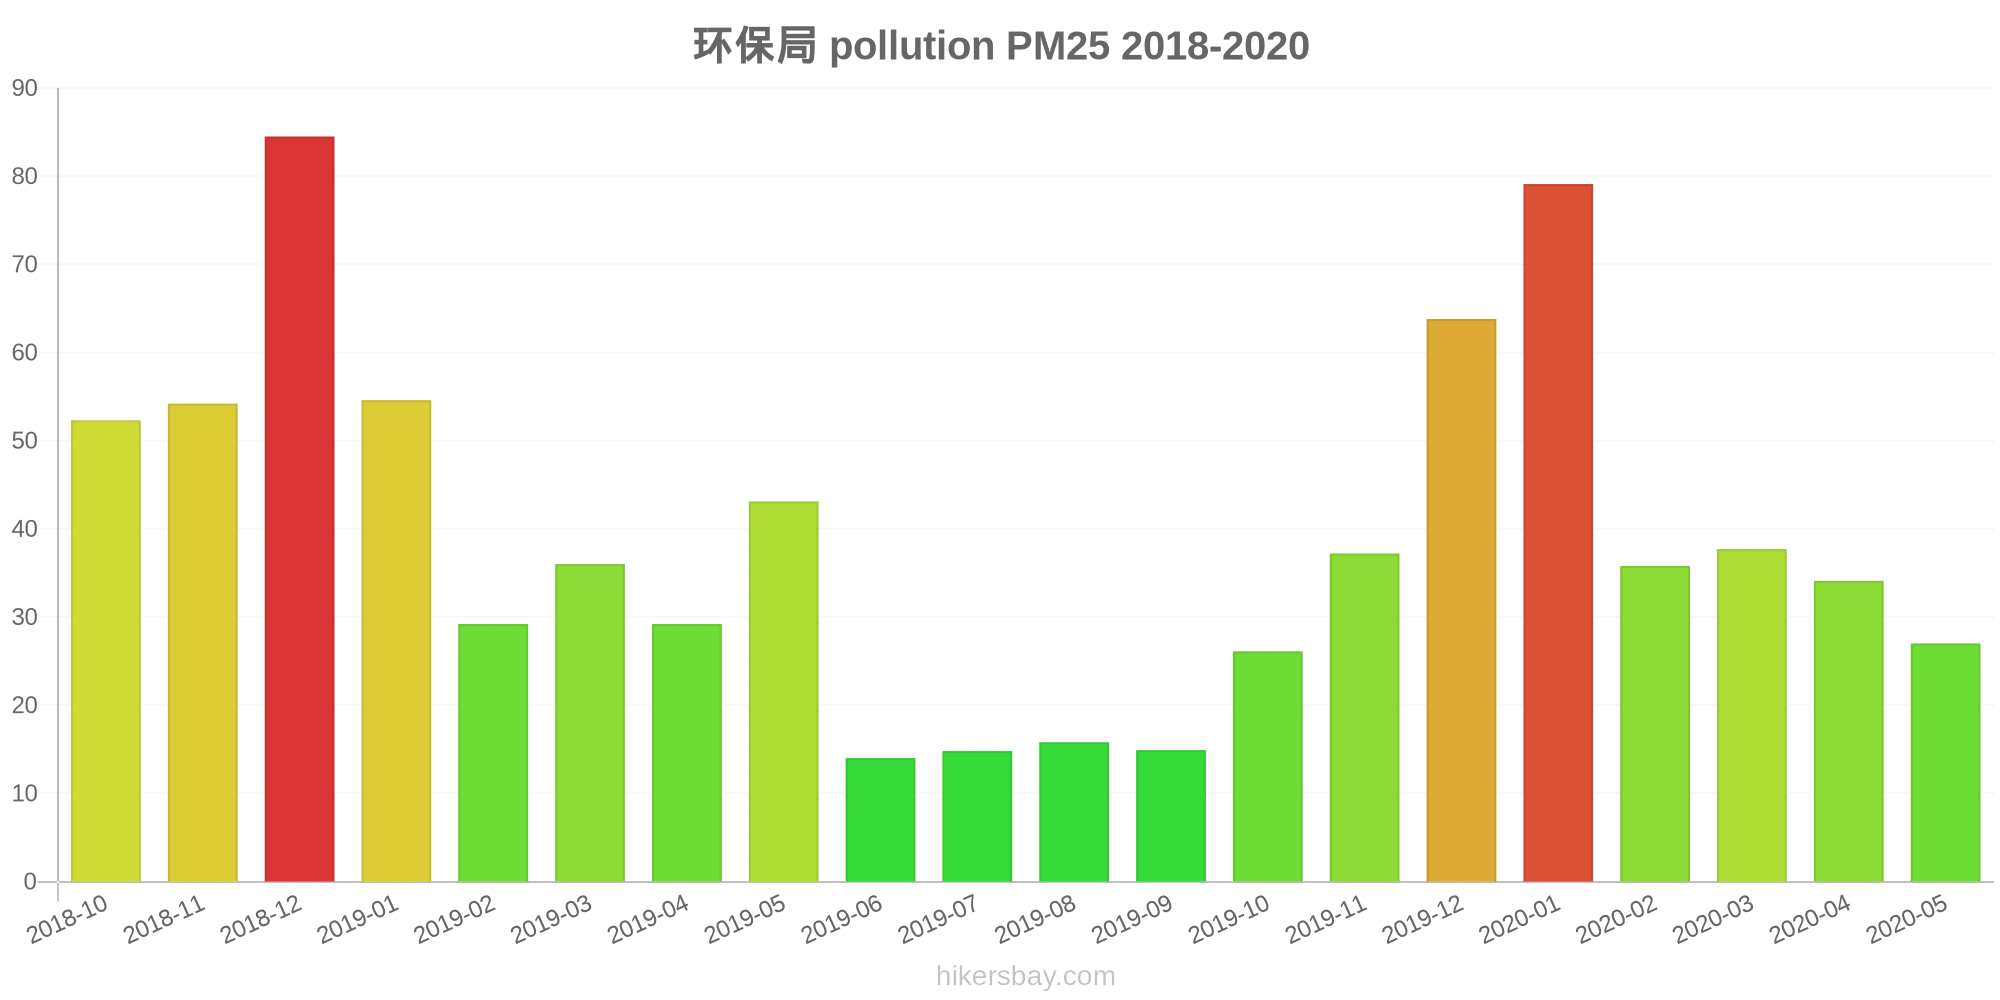
环保局
Friday, May 27, 2022, 3:00 PM
PM2,5 61 (Unhealthy)
particulate matter (PM2.5) dust
NO2 22 (Good)
nitrogen dioxide (NO2)
PM10 69 (Unhealthy for Sensitive Groups)
particulate matter (PM10) suspended dust
CO 219 (Good)
carbon monoxide (CO)
O3 0.05 (Good)
ozone (O3)
SO2 7.7 (Good)
sulfur dioxide (SO2)
丛台公园
index
2022-05-27
pm25
28
no2
22
pm10
35
co
579
o3
22
so2
4.6
环保局
index
2022-05-27
pm25
28
no2
22
pm10
35
co
579
o3
22
so2
4.6
丛台公园
2018-10 2020-05

index
2020-05
2020-04
2020-03
2020-02
2020-01
2019-12
2019-11
2019-10
2019-09
2019-08
2019-07
2019-06
2019-05
2019-04
2019-03
2019-02
2019-01
2018-12
2018-11
2018-10
pm25
36
39
45
66
140
89
58
40
43
35
38
37
38
55
54
142
134
80
101
51
co
725
774
689
1
1
1
1
1
1
815
657
715
746
846
966
1
2
1
1
1
no2
21
34
33
24
54
57
55
45
38
28
25
27
28
35
34
44
64
62
63
62
o3
157
136
115
88
62
38
70
109
175
155
206
218
182
148
131
87
56
45
76
108
pm10
75
85
93
90
176
140
141
104
85
65
79
92
99
124
121
209
210
154
199
128
so2
17
16
12
11
21
14
12
16
17
7.5
10
13
18
15
15
18
31
30
20
21
环保局
2018-10 2020-05

index
2020-05
2020-04
2020-03
2020-02
2020-01
2019-12
2019-11
2019-10
2019-09
2019-08
2019-07
2019-06
2019-05
2019-04
2019-03
2019-02
2019-01
2018-12
2018-11
2018-10
pm25
27
34
38
36
79
64
37
26
15
16
15
14
43
29
36
29
55
85
54
52
co
586
581
842
1
1
2
1
948
618
626
436
440
583
713
1
1
1
1
1
1
no2
20
24
27
25
37
44
35
26
18
14
15
13
17
22
28
24
38
32
31
22
o3
142
127
114
103
89
84
94
75
100
119
122
121
130
118
115
90
85
67
83
86
pm10
55
81
100
90
124
113
79
55
39
39
41
39
118
70
85
74
97
140
109
92
so2
9.9
9.9
12
15
19
19
15
9.1
6.8
7.1
6.8
8.1
9
11
12
16
31
30
30
16
* Pollution data source:
https://openaq.org
(ChinaAQIData)
The data is licensed under CC-By 4.0
PM2,5 61 (Unhealthy)
NO2 22 (Good)
PM10 69 (Unhealthy for Sensitive Groups)
CO 219 (Good)
O3 0 (Good)
SO2 8 (Good)
Data on air pollution from recent days in Sucao
| index | 2022-05-27 |
|---|---|
| pm25 | 28 Moderate |
| no2 | 22 Good |
| pm10 | 35 Moderate |
| co | 579 Good |
| o3 | 22 Good |
| so2 | 5 Good |
| index | 2020-05 | 2020-04 | 2020-03 | 2020-02 | 2020-01 | 2019-12 | 2019-11 | 2019-10 | 2019-09 | 2019-08 | 2019-07 | 2019-06 | 2019-05 | 2019-04 | 2019-03 | 2019-02 | 2019-01 | 2018-12 | 2018-11 | 2018-10 |
|---|---|---|---|---|---|---|---|---|---|---|---|---|---|---|---|---|---|---|---|---|
| pm25 | 32 (Moderate) | 36 (Unhealthy for Sensitive Groups) | 41 (Unhealthy for Sensitive Groups) | 51 (Unhealthy for Sensitive Groups) | 110 (Very Unhealthy) | 76 (Very Unhealthy) | 47 (Unhealthy for Sensitive Groups) | 33 (Moderate) | 29 (Moderate) | 26 (Moderate) | 27 (Moderate) | 26 (Moderate) | 41 (Unhealthy for Sensitive Groups) | 42 (Unhealthy for Sensitive Groups) | 45 (Unhealthy for Sensitive Groups) | 86 (Very Unhealthy) | 94 (Very Unhealthy) | 82 (Very Unhealthy) | 78 (Very Unhealthy) | 52 (Unhealthy for Sensitive Groups) |
| co | 656 (Good) | 678 (Good) | 766 (Good) | 1 (Good) | 1 (Good) | 1.5 (Good) | 1 (Good) | 475 (Good) | 310 (Good) | 721 (Good) | 547 (Good) | 578 (Good) | 665 (Good) | 780 (Good) | 484 (Good) | 1 (Good) | 1.5 (Good) | 1 (Good) | 1 (Good) | 1 (Good) |
| no2 | 21 (Good) | 29 (Good) | 30 (Good) | 24 (Good) | 45 (Moderate) | 50 (Moderate) | 45 (Moderate) | 35 (Good) | 28 (Good) | 21 (Good) | 20 (Good) | 20 (Good) | 22 (Good) | 29 (Good) | 31 (Good) | 34 (Good) | 51 (Moderate) | 47 (Moderate) | 47 (Moderate) | 42 (Moderate) |
| o3 | 150 (Unhealthy for Sensitive Groups) | 132 (Unhealthy for Sensitive Groups) | 115 (Moderate) | 96 (Moderate) | 76 (Moderate) | 61 (Good) | 82 (Moderate) | 92 (Moderate) | 138 (Unhealthy for Sensitive Groups) | 137 (Unhealthy for Sensitive Groups) | 164 (Unhealthy) | 170 (Unhealthy) | 156 (Unhealthy) | 133 (Unhealthy for Sensitive Groups) | 123 (Unhealthy for Sensitive Groups) | 88 (Moderate) | 71 (Moderate) | 56 (Good) | 79 (Moderate) | 97 (Moderate) |
| pm10 | 65 (Unhealthy for Sensitive Groups) | 83 (Unhealthy) | 96 (Unhealthy) | 90 (Unhealthy) | 150 (Very bad Hazardous) | 127 (Very Unhealthy) | 110 (Very Unhealthy) | 79 (Unhealthy for Sensitive Groups) | 62 (Unhealthy for Sensitive Groups) | 52 (Unhealthy for Sensitive Groups) | 60 (Unhealthy for Sensitive Groups) | 65 (Unhealthy for Sensitive Groups) | 109 (Unhealthy) | 97 (Unhealthy) | 103 (Unhealthy) | 142 (Very Unhealthy) | 153 (Very bad Hazardous) | 147 (Very Unhealthy) | 154 (Very bad Hazardous) | 110 (Very Unhealthy) |
| so2 | 14 (Good) | 13 (Good) | 12 (Good) | 13 (Good) | 20 (Good) | 17 (Good) | 14 (Good) | 13 (Good) | 12 (Good) | 7.3 (Good) | 8.6 (Good) | 11 (Good) | 14 (Good) | 13 (Good) | 13 (Good) | 17 (Good) | 31 (Good) | 30 (Good) | 25 (Good) | 19 (Good) |
PM2,5 61 (Unhealthy)
particulate matter (PM2.5) dustNO2 22 (Good)
nitrogen dioxide (NO2)PM10 69 (Unhealthy for Sensitive Groups)
particulate matter (PM10) suspended dustCO 219 (Good)
carbon monoxide (CO)O3 0.05 (Good)
ozone (O3)SO2 7.7 (Good)
sulfur dioxide (SO2)PM2,5 61 (Unhealthy)
particulate matter (PM2.5) dustNO2 22 (Good)
nitrogen dioxide (NO2)PM10 69 (Unhealthy for Sensitive Groups)
particulate matter (PM10) suspended dustCO 219 (Good)
carbon monoxide (CO)O3 0.05 (Good)
ozone (O3)SO2 7.7 (Good)
sulfur dioxide (SO2)丛台公园
| index | 2022-05-27 |
|---|---|
| pm25 | 28 |
| no2 | 22 |
| pm10 | 35 |
| co | 579 |
| o3 | 22 |
| so2 | 4.6 |
环保局
| index | 2022-05-27 |
|---|---|
| pm25 | 28 |
| no2 | 22 |
| pm10 | 35 |
| co | 579 |
| o3 | 22 |
| so2 | 4.6 |
丛台公园
| index | 2020-05 | 2020-04 | 2020-03 | 2020-02 | 2020-01 | 2019-12 | 2019-11 | 2019-10 | 2019-09 | 2019-08 | 2019-07 | 2019-06 | 2019-05 | 2019-04 | 2019-03 | 2019-02 | 2019-01 | 2018-12 | 2018-11 | 2018-10 |
|---|---|---|---|---|---|---|---|---|---|---|---|---|---|---|---|---|---|---|---|---|
| pm25 | 36 | 39 | 45 | 66 | 140 | 89 | 58 | 40 | 43 | 35 | 38 | 37 | 38 | 55 | 54 | 142 | 134 | 80 | 101 | 51 |
| co | 725 | 774 | 689 | 1 | 1 | 1 | 1 | 1 | 1 | 815 | 657 | 715 | 746 | 846 | 966 | 1 | 2 | 1 | 1 | 1 |
| no2 | 21 | 34 | 33 | 24 | 54 | 57 | 55 | 45 | 38 | 28 | 25 | 27 | 28 | 35 | 34 | 44 | 64 | 62 | 63 | 62 |
| o3 | 157 | 136 | 115 | 88 | 62 | 38 | 70 | 109 | 175 | 155 | 206 | 218 | 182 | 148 | 131 | 87 | 56 | 45 | 76 | 108 |
| pm10 | 75 | 85 | 93 | 90 | 176 | 140 | 141 | 104 | 85 | 65 | 79 | 92 | 99 | 124 | 121 | 209 | 210 | 154 | 199 | 128 |
| so2 | 17 | 16 | 12 | 11 | 21 | 14 | 12 | 16 | 17 | 7.5 | 10 | 13 | 18 | 15 | 15 | 18 | 31 | 30 | 20 | 21 |
环保局
| index | 2020-05 | 2020-04 | 2020-03 | 2020-02 | 2020-01 | 2019-12 | 2019-11 | 2019-10 | 2019-09 | 2019-08 | 2019-07 | 2019-06 | 2019-05 | 2019-04 | 2019-03 | 2019-02 | 2019-01 | 2018-12 | 2018-11 | 2018-10 |
|---|---|---|---|---|---|---|---|---|---|---|---|---|---|---|---|---|---|---|---|---|
| pm25 | 27 | 34 | 38 | 36 | 79 | 64 | 37 | 26 | 15 | 16 | 15 | 14 | 43 | 29 | 36 | 29 | 55 | 85 | 54 | 52 |
| co | 586 | 581 | 842 | 1 | 1 | 2 | 1 | 948 | 618 | 626 | 436 | 440 | 583 | 713 | 1 | 1 | 1 | 1 | 1 | 1 |
| no2 | 20 | 24 | 27 | 25 | 37 | 44 | 35 | 26 | 18 | 14 | 15 | 13 | 17 | 22 | 28 | 24 | 38 | 32 | 31 | 22 |
| o3 | 142 | 127 | 114 | 103 | 89 | 84 | 94 | 75 | 100 | 119 | 122 | 121 | 130 | 118 | 115 | 90 | 85 | 67 | 83 | 86 |
| pm10 | 55 | 81 | 100 | 90 | 124 | 113 | 79 | 55 | 39 | 39 | 41 | 39 | 118 | 70 | 85 | 74 | 97 | 140 | 109 | 92 |
| so2 | 9.9 | 9.9 | 12 | 15 | 19 | 19 | 15 | 9.1 | 6.8 | 7.1 | 6.8 | 8.1 | 9 | 11 | 12 | 16 | 31 | 30 | 30 | 16 |