Air Pollution in Tai’erzhuang: Real-time Air Quality Index and smog alert.
Pollution and air quality forecast for Tai’erzhuang. Today is Sunday, June 21, 2026. The following air pollution values have been recorded for Tai’erzhuang:- particulate matter (PM2.5) dust - 61 (Unhealthy)
- nitrogen dioxide (NO2) - 22 (Good)
- particulate matter (PM10) suspended dust - 69 (Unhealthy for Sensitive Groups)
- carbon monoxide (CO) - 219 (Good)
- ozone (O3) - 0 (Good)
- sulfur dioxide (SO2) - 8 (Good)

What is the air quality in Tai’erzhuang today? Is the air polluted in Tai’erzhuang?. Is there smog?
What is the current level of PM2.5 in Tai’erzhuang? (particulate matter (PM2.5) dust)
Today's PM2.5 level is:
61 (Unhealthy)
For comparison, the highest level of PM2.5 in Tai’erzhuang in the last 7 days was: 28 (Friday, May 27, 2022) and the lowest: 28 (Friday, May 27, 2022).
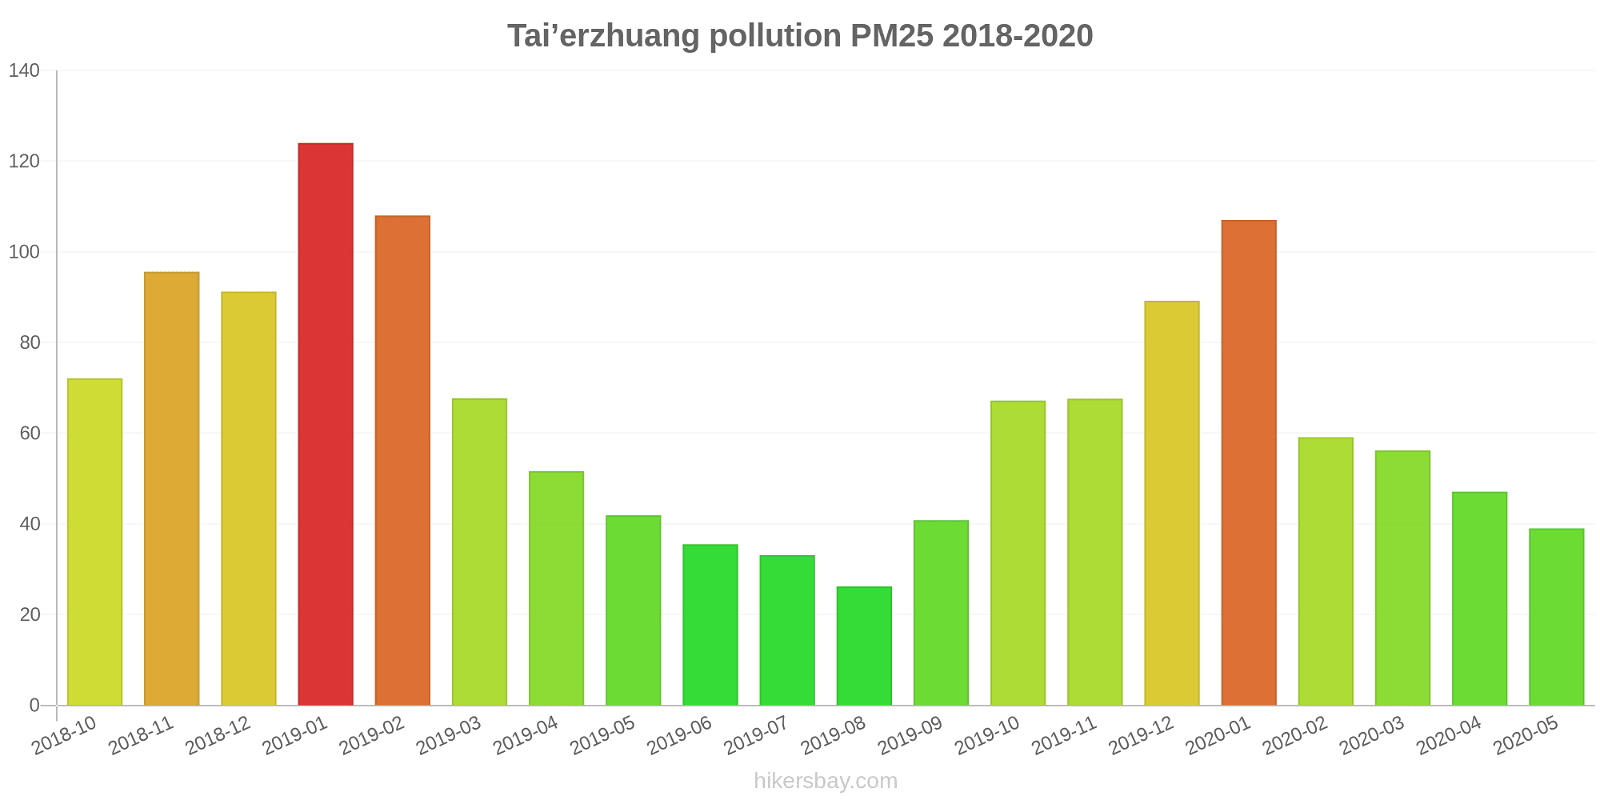
The highest PM2.5 values were recorded: 124 (January 2019).
The lowest level of particulate matter PM2.5 pollution occurs in month: August (26).
How high is the level of NO2? (nitrogen dioxide (NO2))
22 (Good)
What is the level of PM10 today in Tai’erzhuang? (particulate matter (PM10) suspended dust)
The current level of particulate matter PM10 in Tai’erzhuang is:
69 (Unhealthy for Sensitive Groups)
The highest PM10 values usually occur in month: 200 (January 2019).
The lowest value of particulate matter PM10 pollution in Tai’erzhuang is usually recorded in: August (44).
How high is the CO level? (carbon monoxide (CO))
219 (Good)
How is the O3 level today in Tai’erzhuang? (ozone (O3))
0 (Good)
What is the level of SO2 pollution? (sulfur dioxide (SO2))
8 (Good)
Current data Friday, May 27, 2022, 3:00 PM
PM2,5 61 (Unhealthy)
NO2 22 (Good)
PM10 69 (Unhealthy for Sensitive Groups)
CO 219 (Good)
O3 0 (Good)
SO2 8 (Good)
Data on air pollution from recent days in Tai’erzhuang
index
2022-05-27
pm25
28
Moderate
no2
22
Good
pm10
35
Moderate
co
579
Good
o3
22
Good
so2
5
Good
data source »
Air pollution in Tai’erzhuang from October 2018 to May 2020
index
2020-05
2020-04
2020-03
2020-02
2020-01
2019-12
2019-11
2019-10
2019-09
2019-08
2019-07
2019-06
2019-05
2019-04
2019-03
2019-02
2019-01
2018-12
2018-11
2018-10
pm25
39 (Unhealthy for Sensitive Groups)
47 (Unhealthy for Sensitive Groups)
56 (Unhealthy)
59 (Unhealthy)
107 (Very Unhealthy)
89 (Very Unhealthy)
68 (Unhealthy)
67 (Unhealthy)
41 (Unhealthy for Sensitive Groups)
26 (Moderate)
33 (Moderate)
36 (Unhealthy for Sensitive Groups)
42 (Unhealthy for Sensitive Groups)
52 (Unhealthy for Sensitive Groups)
68 (Unhealthy)
108 (Very Unhealthy)
124 (Very bad Hazardous)
91 (Very Unhealthy)
96 (Very Unhealthy)
72 (Unhealthy)
co
635 (Good)
598 (Good)
778 (Good)
793 (Good)
1 (Good)
1 (Good)
872 (Good)
850 (Good)
597 (Good)
557 (Good)
808 (Good)
789 (Good)
746 (Good)
818 (Good)
817 (Good)
1 (Good)
1 (Good)
949 (Good)
936 (Good)
691 (Good)
no2
17 (Good)
29 (Good)
33 (Good)
19 (Good)
37 (Good)
48 (Moderate)
48 (Moderate)
46 (Moderate)
33 (Good)
22 (Good)
18 (Good)
19 (Good)
26 (Good)
29 (Good)
45 (Moderate)
30 (Good)
43 (Moderate)
53 (Moderate)
51 (Moderate)
58 (Moderate)
o3
130 (Unhealthy for Sensitive Groups)
135 (Unhealthy for Sensitive Groups)
104 (Moderate)
91 (Moderate)
76 (Moderate)
64 (Good)
92 (Moderate)
135 (Unhealthy for Sensitive Groups)
177 (Unhealthy)
136 (Unhealthy for Sensitive Groups)
171 (Unhealthy)
195 (Very Unhealthy)
158 (Unhealthy)
125 (Unhealthy for Sensitive Groups)
121 (Unhealthy for Sensitive Groups)
97 (Moderate)
67 (Good)
49 (Good)
90 (Moderate)
105 (Moderate)
pm10
71 (Unhealthy for Sensitive Groups)
93 (Unhealthy)
97 (Unhealthy)
79 (Unhealthy for Sensitive Groups)
142 (Very Unhealthy)
129 (Very Unhealthy)
133 (Very Unhealthy)
131 (Very Unhealthy)
79 (Unhealthy for Sensitive Groups)
44 (Moderate)
51 (Unhealthy for Sensitive Groups)
69 (Unhealthy for Sensitive Groups)
92 (Unhealthy)
93 (Unhealthy)
133 (Very Unhealthy)
167 (Very bad Hazardous)
200 (Very bad Hazardous)
155 (Very bad Hazardous)
152 (Very bad Hazardous)
139 (Very Unhealthy)
so2
11 (Good)
14 (Good)
11 (Good)
7.8 (Good)
16 (Good)
13 (Good)
13 (Good)
11 (Good)
12 (Good)
9.6 (Good)
7.8 (Good)
8.6 (Good)
11 (Good)
9.2 (Good)
11 (Good)
12 (Good)
18 (Good)
16 (Good)
8.5 (Good)
10 (Good)
data source »
台儿庄区环保局
Friday, May 27, 2022, 3:00 PM
PM2,5 61 (Unhealthy)
particulate matter (PM2.5) dust
NO2 22 (Good)
nitrogen dioxide (NO2)
PM10 69 (Unhealthy for Sensitive Groups)
particulate matter (PM10) suspended dust
CO 219 (Good)
carbon monoxide (CO)
O3 0.05 (Good)
ozone (O3)
SO2 7.7 (Good)
sulfur dioxide (SO2)
台儿庄区环保局
index
2022-05-27
pm25
28
no2
22
pm10
35
co
579
o3
22
so2
4.6
台儿庄区环保局
2018-10 2020-05

index
2020-05
2020-04
2020-03
2020-02
2020-01
2019-12
2019-11
2019-10
2019-09
2019-08
2019-07
2019-06
2019-05
2019-04
2019-03
2019-02
2019-01
2018-12
2018-11
2018-10
pm25
39
47
56
59
107
89
68
67
41
26
33
36
42
52
68
108
124
91
96
72
co
635
598
778
793
1
1
872
850
597
557
808
789
746
818
817
1
1
949
936
691
no2
17
29
33
19
37
48
48
46
33
22
18
19
26
29
45
30
43
53
51
58
o3
130
135
104
91
76
64
92
135
177
136
171
195
158
125
121
97
67
49
90
105
pm10
71
93
97
79
142
129
133
131
79
44
51
69
92
93
133
167
200
155
152
139
so2
11
14
11
7.8
16
13
13
11
12
9.6
7.8
8.6
11
9.2
11
12
18
16
8.5
10
* Pollution data source:
https://openaq.org
(ChinaAQIData)
The data is licensed under CC-By 4.0
PM2,5 61 (Unhealthy)
NO2 22 (Good)
PM10 69 (Unhealthy for Sensitive Groups)
CO 219 (Good)
O3 0 (Good)
SO2 8 (Good)
Data on air pollution from recent days in Tai’erzhuang
| index | 2022-05-27 |
|---|---|
| pm25 | 28 Moderate |
| no2 | 22 Good |
| pm10 | 35 Moderate |
| co | 579 Good |
| o3 | 22 Good |
| so2 | 5 Good |

| index | 2020-05 | 2020-04 | 2020-03 | 2020-02 | 2020-01 | 2019-12 | 2019-11 | 2019-10 | 2019-09 | 2019-08 | 2019-07 | 2019-06 | 2019-05 | 2019-04 | 2019-03 | 2019-02 | 2019-01 | 2018-12 | 2018-11 | 2018-10 |
|---|---|---|---|---|---|---|---|---|---|---|---|---|---|---|---|---|---|---|---|---|
| pm25 | 39 (Unhealthy for Sensitive Groups) | 47 (Unhealthy for Sensitive Groups) | 56 (Unhealthy) | 59 (Unhealthy) | 107 (Very Unhealthy) | 89 (Very Unhealthy) | 68 (Unhealthy) | 67 (Unhealthy) | 41 (Unhealthy for Sensitive Groups) | 26 (Moderate) | 33 (Moderate) | 36 (Unhealthy for Sensitive Groups) | 42 (Unhealthy for Sensitive Groups) | 52 (Unhealthy for Sensitive Groups) | 68 (Unhealthy) | 108 (Very Unhealthy) | 124 (Very bad Hazardous) | 91 (Very Unhealthy) | 96 (Very Unhealthy) | 72 (Unhealthy) |
| co | 635 (Good) | 598 (Good) | 778 (Good) | 793 (Good) | 1 (Good) | 1 (Good) | 872 (Good) | 850 (Good) | 597 (Good) | 557 (Good) | 808 (Good) | 789 (Good) | 746 (Good) | 818 (Good) | 817 (Good) | 1 (Good) | 1 (Good) | 949 (Good) | 936 (Good) | 691 (Good) |
| no2 | 17 (Good) | 29 (Good) | 33 (Good) | 19 (Good) | 37 (Good) | 48 (Moderate) | 48 (Moderate) | 46 (Moderate) | 33 (Good) | 22 (Good) | 18 (Good) | 19 (Good) | 26 (Good) | 29 (Good) | 45 (Moderate) | 30 (Good) | 43 (Moderate) | 53 (Moderate) | 51 (Moderate) | 58 (Moderate) |
| o3 | 130 (Unhealthy for Sensitive Groups) | 135 (Unhealthy for Sensitive Groups) | 104 (Moderate) | 91 (Moderate) | 76 (Moderate) | 64 (Good) | 92 (Moderate) | 135 (Unhealthy for Sensitive Groups) | 177 (Unhealthy) | 136 (Unhealthy for Sensitive Groups) | 171 (Unhealthy) | 195 (Very Unhealthy) | 158 (Unhealthy) | 125 (Unhealthy for Sensitive Groups) | 121 (Unhealthy for Sensitive Groups) | 97 (Moderate) | 67 (Good) | 49 (Good) | 90 (Moderate) | 105 (Moderate) |
| pm10 | 71 (Unhealthy for Sensitive Groups) | 93 (Unhealthy) | 97 (Unhealthy) | 79 (Unhealthy for Sensitive Groups) | 142 (Very Unhealthy) | 129 (Very Unhealthy) | 133 (Very Unhealthy) | 131 (Very Unhealthy) | 79 (Unhealthy for Sensitive Groups) | 44 (Moderate) | 51 (Unhealthy for Sensitive Groups) | 69 (Unhealthy for Sensitive Groups) | 92 (Unhealthy) | 93 (Unhealthy) | 133 (Very Unhealthy) | 167 (Very bad Hazardous) | 200 (Very bad Hazardous) | 155 (Very bad Hazardous) | 152 (Very bad Hazardous) | 139 (Very Unhealthy) |
| so2 | 11 (Good) | 14 (Good) | 11 (Good) | 7.8 (Good) | 16 (Good) | 13 (Good) | 13 (Good) | 11 (Good) | 12 (Good) | 9.6 (Good) | 7.8 (Good) | 8.6 (Good) | 11 (Good) | 9.2 (Good) | 11 (Good) | 12 (Good) | 18 (Good) | 16 (Good) | 8.5 (Good) | 10 (Good) |
PM2,5 61 (Unhealthy)
particulate matter (PM2.5) dustNO2 22 (Good)
nitrogen dioxide (NO2)PM10 69 (Unhealthy for Sensitive Groups)
particulate matter (PM10) suspended dustCO 219 (Good)
carbon monoxide (CO)O3 0.05 (Good)
ozone (O3)SO2 7.7 (Good)
sulfur dioxide (SO2)台儿庄区环保局
| index | 2022-05-27 |
|---|---|
| pm25 | 28 |
| no2 | 22 |
| pm10 | 35 |
| co | 579 |
| o3 | 22 |
| so2 | 4.6 |
台儿庄区环保局

| index | 2020-05 | 2020-04 | 2020-03 | 2020-02 | 2020-01 | 2019-12 | 2019-11 | 2019-10 | 2019-09 | 2019-08 | 2019-07 | 2019-06 | 2019-05 | 2019-04 | 2019-03 | 2019-02 | 2019-01 | 2018-12 | 2018-11 | 2018-10 |
|---|---|---|---|---|---|---|---|---|---|---|---|---|---|---|---|---|---|---|---|---|
| pm25 | 39 | 47 | 56 | 59 | 107 | 89 | 68 | 67 | 41 | 26 | 33 | 36 | 42 | 52 | 68 | 108 | 124 | 91 | 96 | 72 |
| co | 635 | 598 | 778 | 793 | 1 | 1 | 872 | 850 | 597 | 557 | 808 | 789 | 746 | 818 | 817 | 1 | 1 | 949 | 936 | 691 |
| no2 | 17 | 29 | 33 | 19 | 37 | 48 | 48 | 46 | 33 | 22 | 18 | 19 | 26 | 29 | 45 | 30 | 43 | 53 | 51 | 58 |
| o3 | 130 | 135 | 104 | 91 | 76 | 64 | 92 | 135 | 177 | 136 | 171 | 195 | 158 | 125 | 121 | 97 | 67 | 49 | 90 | 105 |
| pm10 | 71 | 93 | 97 | 79 | 142 | 129 | 133 | 131 | 79 | 44 | 51 | 69 | 92 | 93 | 133 | 167 | 200 | 155 | 152 | 139 |
| so2 | 11 | 14 | 11 | 7.8 | 16 | 13 | 13 | 11 | 12 | 9.6 | 7.8 | 8.6 | 11 | 9.2 | 11 | 12 | 18 | 16 | 8.5 | 10 |