Air Pollution in Tangshan: Real-time Air Quality Index and smog alert.
Pollution and air quality forecast for Tangshan. Today is Saturday, June 20, 2026. The following air pollution values have been recorded for Tangshan:- particulate matter (PM2.5) dust - 61 (Unhealthy)
- nitrogen dioxide (NO2) - 22 (Good)
- particulate matter (PM10) suspended dust - 69 (Unhealthy for Sensitive Groups)
- carbon monoxide (CO) - 219 (Good)
- ozone (O3) - 0 (Good)
- sulfur dioxide (SO2) - 8 (Good)

What is the air quality in Tangshan today? Is the air polluted in Tangshan?. Is there smog?
What is the current level of PM2.5 in Tangshan? (particulate matter (PM2.5) dust)
Today's PM2.5 level is:
61 (Unhealthy)
For comparison, the highest level of PM2.5 in Tangshan in the last 7 days was: 28 (Friday, May 27, 2022) and the lowest: 28 (Friday, May 27, 2022).
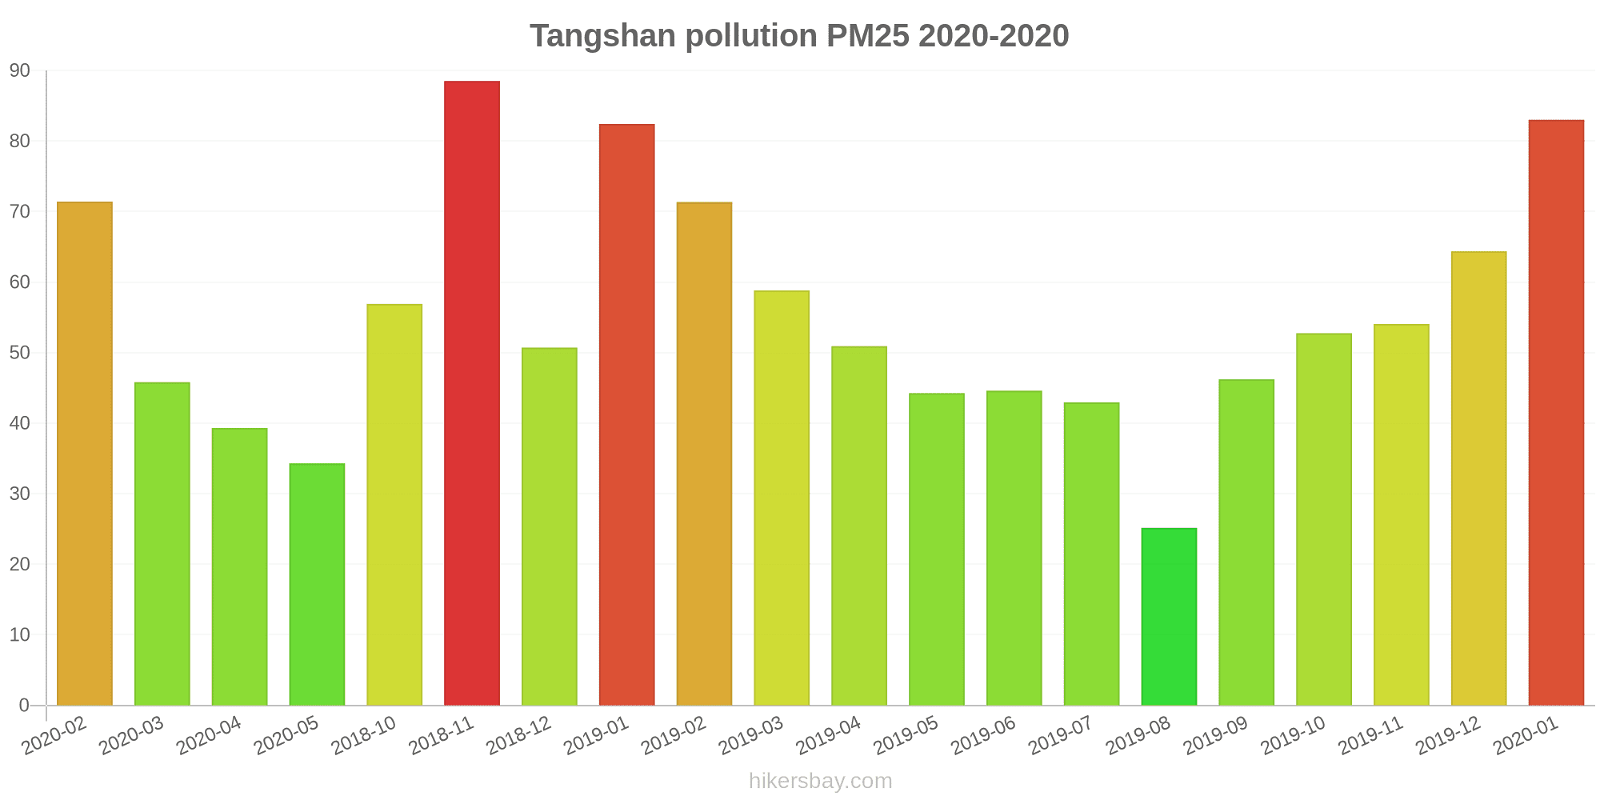
The highest PM2.5 values were recorded: 89 (November 2018).
The lowest level of particulate matter PM2.5 pollution occurs in month: August (25).
How high is the level of NO2? (nitrogen dioxide (NO2))
22 (Good)
What is the level of PM10 today in Tangshan? (particulate matter (PM10) suspended dust)
The current level of particulate matter PM10 in Tangshan is:
69 (Unhealthy for Sensitive Groups)
The highest PM10 values usually occur in month: 145 (November 2018).
The lowest value of particulate matter PM10 pollution in Tangshan is usually recorded in: August (55).
How high is the CO level? (carbon monoxide (CO))
219 (Good)
How is the O3 level today in Tangshan? (ozone (O3))
0 (Good)
What is the level of SO2 pollution? (sulfur dioxide (SO2))
8 (Good)
Current data Friday, May 27, 2022, 3:00 PM
PM2,5 61 (Unhealthy)
NO2 22 (Good)
PM10 69 (Unhealthy for Sensitive Groups)
CO 219 (Good)
O3 0 (Good)
SO2 8 (Good)
Data on air pollution from recent days in Tangshan
index
2022-05-27
pm25
28
Moderate
no2
22
Good
pm10
35
Moderate
co
579
Good
o3
22
Good
so2
5
Good
data source »
Air pollution in Tangshan from February 2020 to January 2020
index
2020-01
2019-12
2019-11
2019-10
2019-09
2019-08
2019-07
2019-06
2019-05
2019-04
2019-03
2019-02
2019-01
2018-12
2018-11
2018-10
2020-05
2020-04
2020-03
2020-02
pm25
83 (Very Unhealthy)
64 (Unhealthy)
54 (Unhealthy for Sensitive Groups)
53 (Unhealthy for Sensitive Groups)
46 (Unhealthy for Sensitive Groups)
25 (Moderate)
43 (Unhealthy for Sensitive Groups)
45 (Unhealthy for Sensitive Groups)
44 (Unhealthy for Sensitive Groups)
51 (Unhealthy for Sensitive Groups)
59 (Unhealthy)
71 (Unhealthy)
82 (Very Unhealthy)
51 (Unhealthy for Sensitive Groups)
89 (Very Unhealthy)
57 (Unhealthy)
34 (Moderate)
39 (Unhealthy for Sensitive Groups)
46 (Unhealthy for Sensitive Groups)
71 (Unhealthy)
co
1.5 (Good)
1 (Good)
1 (Good)
1 (Good)
1 (Good)
885 (Good)
1 (Good)
1 (Good)
960 (Good)
1 (Good)
1 (Good)
1 (Good)
1 (Good)
1 (Good)
1 (Good)
1 (Good)
1 (Good)
1 (Good)
1 (Good)
1 (Good)
no2
64 (Moderate)
59 (Moderate)
60 (Moderate)
60 (Moderate)
53 (Moderate)
40 (Good)
38 (Good)
44 (Moderate)
46 (Moderate)
47 (Moderate)
57 (Moderate)
51 (Moderate)
62 (Moderate)
49 (Moderate)
69 (Moderate)
56 (Moderate)
39 (Good)
45 (Moderate)
44 (Moderate)
40 (Moderate)
o3
50 (Good)
41 (Good)
50 (Good)
94 (Moderate)
180 (Unhealthy)
139 (Unhealthy for Sensitive Groups)
191 (Very Unhealthy)
206 (Very Unhealthy)
180 (Very Unhealthy)
127 (Unhealthy for Sensitive Groups)
103 (Moderate)
75 (Moderate)
47 (Good)
47 (Good)
57 (Good)
82 (Moderate)
158 (Unhealthy)
141 (Unhealthy for Sensitive Groups)
97 (Moderate)
81 (Moderate)
pm10
128 (Very Unhealthy)
109 (Unhealthy)
112 (Very Unhealthy)
100 (Unhealthy)
94 (Unhealthy)
55 (Unhealthy for Sensitive Groups)
89 (Unhealthy)
93 (Unhealthy)
97 (Unhealthy)
106 (Unhealthy)
110 (Unhealthy)
114 (Very Unhealthy)
130 (Very Unhealthy)
97 (Unhealthy)
145 (Very Unhealthy)
102 (Unhealthy)
96 (Unhealthy)
103 (Unhealthy)
92 (Unhealthy)
102 (Unhealthy)
so2
29 (Good)
20 (Good)
22 (Good)
15 (Good)
19 (Good)
13 (Good)
14 (Good)
33 (Good)
22 (Good)
21 (Good)
19 (Good)
23 (Good)
24 (Good)
26 (Good)
37 (Good)
28 (Good)
19 (Good)
21 (Good)
17 (Good)
20 (Good)
data source »
物资局
Friday, May 27, 2022, 3:00 PM
PM2,5 61 (Unhealthy)
particulate matter (PM2.5) dust
NO2 22 (Good)
nitrogen dioxide (NO2)
PM10 69 (Unhealthy for Sensitive Groups)
particulate matter (PM10) suspended dust
CO 219 (Good)
carbon monoxide (CO)
O3 0.05 (Good)
ozone (O3)
SO2 7.7 (Good)
sulfur dioxide (SO2)
物资局
index
2022-05-27
pm25
28
no2
22
pm10
35
co
579
o3
22
so2
4.6
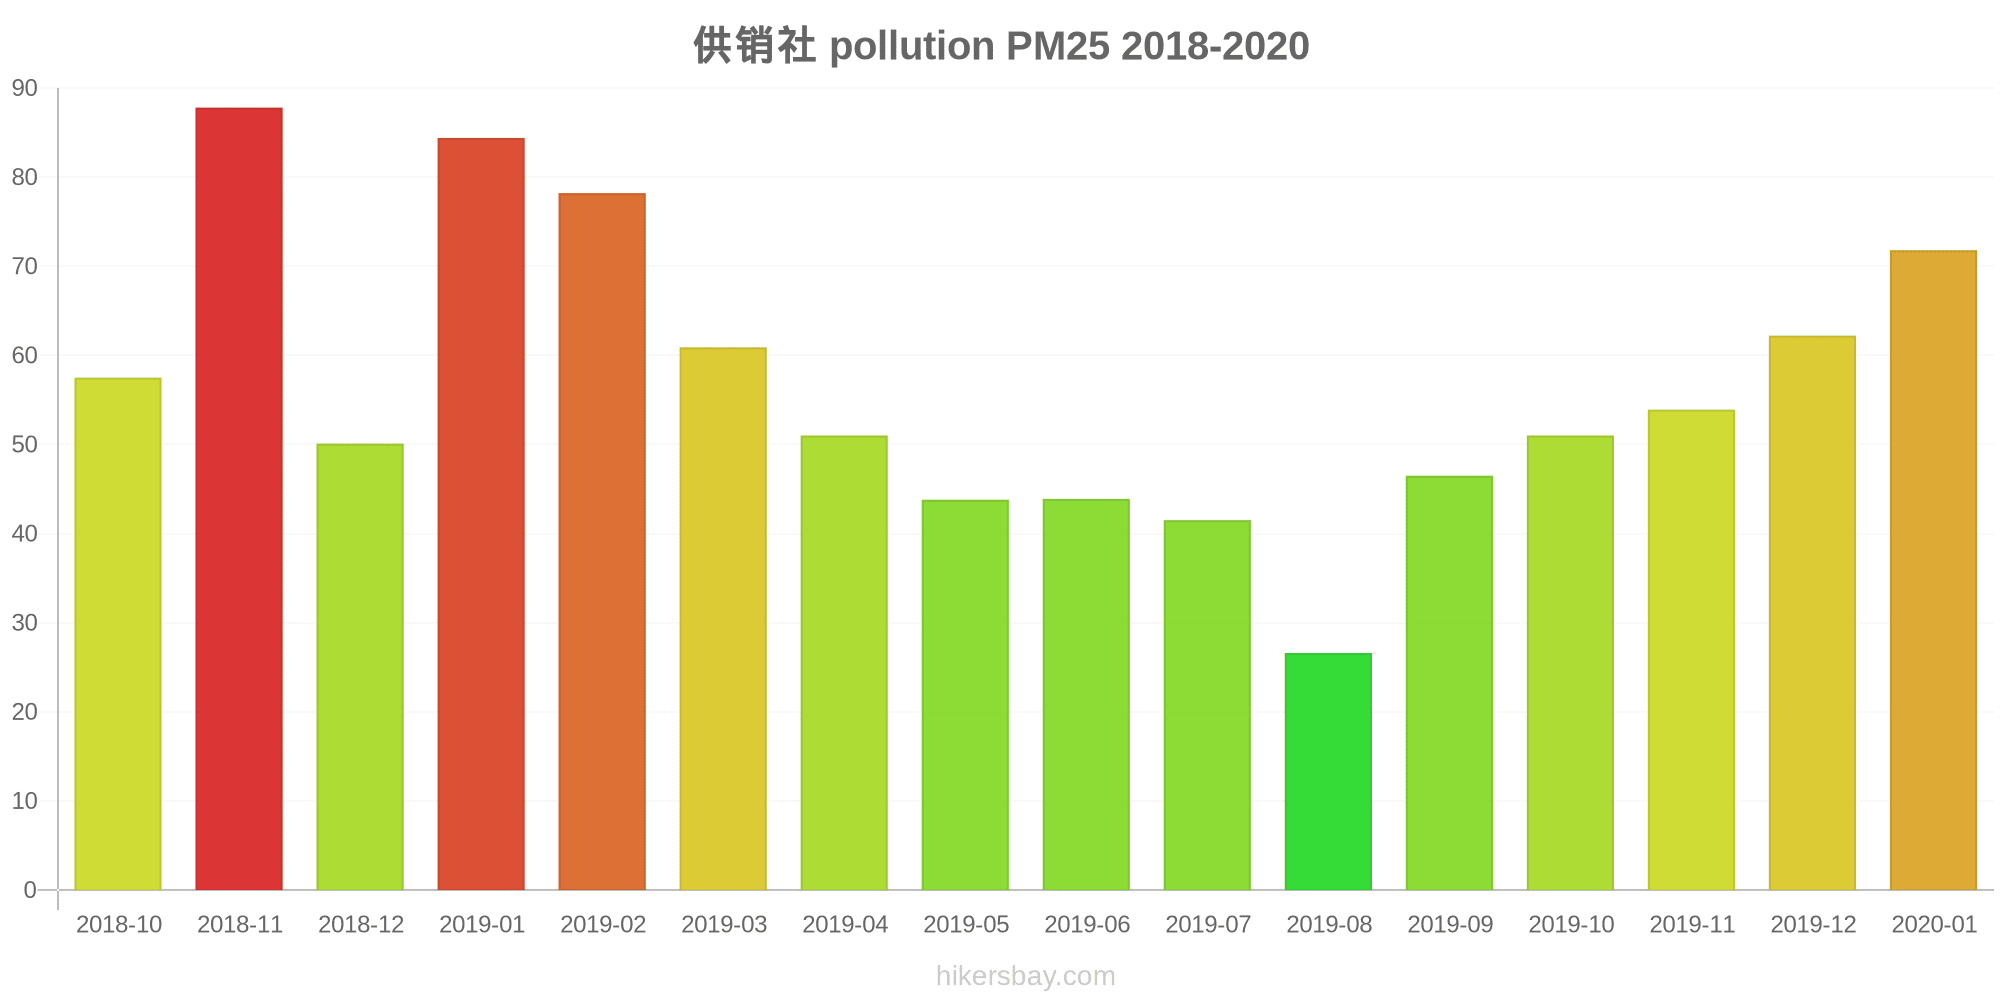
供销社
2018-10 2020-01

index
2020-01
2019-12
2019-11
2019-10
2019-09
2019-08
2019-07
2019-06
2019-05
2019-04
2019-03
2019-02
2019-01
2018-12
2018-11
2018-10
pm25
72
62
54
51
47
27
42
44
44
51
61
78
84
50
88
58
co
1
1
1
1
1
942
1
1
949
1
1
1
1
1
1
1
no2
67
59
61
60
53
43
40
46
45
45
58
56
66
52
71
52
o3
42
45
55
102
194
149
200
215
186
131
106
78
48
47
58
83
pm10
116
100
102
96
88
50
79
83
86
103
112
121
129
95
140
98
so2
31
20
22
15
17
12
13
34
22
20
19
22
23
27
36
25
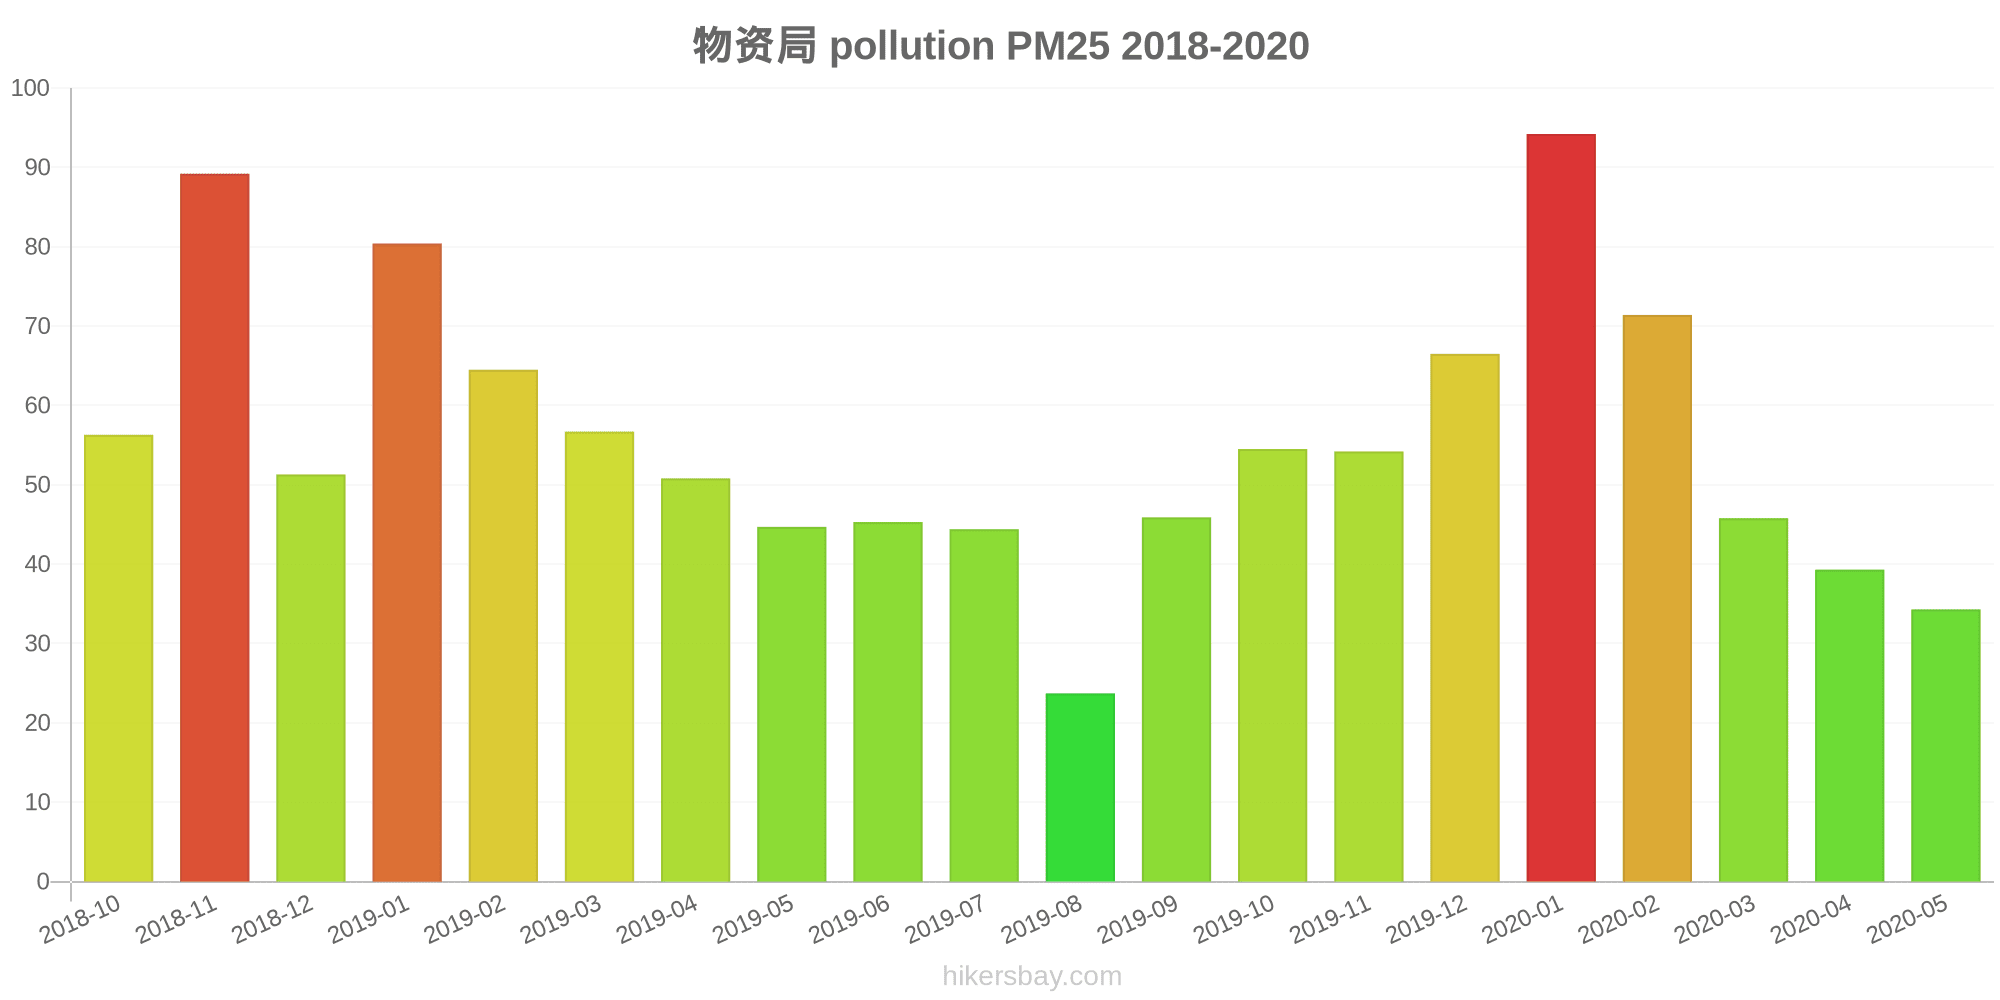
物资局
2018-10 2020-05

index
2020-05
2020-04
2020-03
2020-02
2020-01
2019-12
2019-11
2019-10
2019-09
2019-08
2019-07
2019-06
2019-05
2019-04
2019-03
2019-02
2019-01
2018-12
2018-11
2018-10
pm25
34
39
46
71
94
67
54
55
46
24
44
45
45
51
57
65
80
51
89
56
co
1
1
1
1
2
1
1
1
1
828
1
1
971
1
1
1
1
1
1
1
no2
39
45
44
40
60
58
59
60
52
37
35
42
46
49
57
47
58
46
67
60
o3
158
141
97
81
58
36
45
85
165
129
181
196
174
123
99
72
47
46
56
81
pm10
96
103
92
102
140
119
121
104
100
61
99
103
109
109
107
106
131
100
149
106
so2
19
21
17
20
27
21
22
15
22
14
14
32
21
21
19
24
24
24
39
30
* Pollution data source:
https://openaq.org
(ChinaAQIData)
The data is licensed under CC-By 4.0
PM2,5 61 (Unhealthy)
NO2 22 (Good)
PM10 69 (Unhealthy for Sensitive Groups)
CO 219 (Good)
O3 0 (Good)
SO2 8 (Good)
Data on air pollution from recent days in Tangshan
| index | 2022-05-27 |
|---|---|
| pm25 | 28 Moderate |
| no2 | 22 Good |
| pm10 | 35 Moderate |
| co | 579 Good |
| o3 | 22 Good |
| so2 | 5 Good |

| index | 2020-01 | 2019-12 | 2019-11 | 2019-10 | 2019-09 | 2019-08 | 2019-07 | 2019-06 | 2019-05 | 2019-04 | 2019-03 | 2019-02 | 2019-01 | 2018-12 | 2018-11 | 2018-10 | 2020-05 | 2020-04 | 2020-03 | 2020-02 |
|---|---|---|---|---|---|---|---|---|---|---|---|---|---|---|---|---|---|---|---|---|
| pm25 | 83 (Very Unhealthy) | 64 (Unhealthy) | 54 (Unhealthy for Sensitive Groups) | 53 (Unhealthy for Sensitive Groups) | 46 (Unhealthy for Sensitive Groups) | 25 (Moderate) | 43 (Unhealthy for Sensitive Groups) | 45 (Unhealthy for Sensitive Groups) | 44 (Unhealthy for Sensitive Groups) | 51 (Unhealthy for Sensitive Groups) | 59 (Unhealthy) | 71 (Unhealthy) | 82 (Very Unhealthy) | 51 (Unhealthy for Sensitive Groups) | 89 (Very Unhealthy) | 57 (Unhealthy) | 34 (Moderate) | 39 (Unhealthy for Sensitive Groups) | 46 (Unhealthy for Sensitive Groups) | 71 (Unhealthy) |
| co | 1.5 (Good) | 1 (Good) | 1 (Good) | 1 (Good) | 1 (Good) | 885 (Good) | 1 (Good) | 1 (Good) | 960 (Good) | 1 (Good) | 1 (Good) | 1 (Good) | 1 (Good) | 1 (Good) | 1 (Good) | 1 (Good) | 1 (Good) | 1 (Good) | 1 (Good) | 1 (Good) |
| no2 | 64 (Moderate) | 59 (Moderate) | 60 (Moderate) | 60 (Moderate) | 53 (Moderate) | 40 (Good) | 38 (Good) | 44 (Moderate) | 46 (Moderate) | 47 (Moderate) | 57 (Moderate) | 51 (Moderate) | 62 (Moderate) | 49 (Moderate) | 69 (Moderate) | 56 (Moderate) | 39 (Good) | 45 (Moderate) | 44 (Moderate) | 40 (Moderate) |
| o3 | 50 (Good) | 41 (Good) | 50 (Good) | 94 (Moderate) | 180 (Unhealthy) | 139 (Unhealthy for Sensitive Groups) | 191 (Very Unhealthy) | 206 (Very Unhealthy) | 180 (Very Unhealthy) | 127 (Unhealthy for Sensitive Groups) | 103 (Moderate) | 75 (Moderate) | 47 (Good) | 47 (Good) | 57 (Good) | 82 (Moderate) | 158 (Unhealthy) | 141 (Unhealthy for Sensitive Groups) | 97 (Moderate) | 81 (Moderate) |
| pm10 | 128 (Very Unhealthy) | 109 (Unhealthy) | 112 (Very Unhealthy) | 100 (Unhealthy) | 94 (Unhealthy) | 55 (Unhealthy for Sensitive Groups) | 89 (Unhealthy) | 93 (Unhealthy) | 97 (Unhealthy) | 106 (Unhealthy) | 110 (Unhealthy) | 114 (Very Unhealthy) | 130 (Very Unhealthy) | 97 (Unhealthy) | 145 (Very Unhealthy) | 102 (Unhealthy) | 96 (Unhealthy) | 103 (Unhealthy) | 92 (Unhealthy) | 102 (Unhealthy) |
| so2 | 29 (Good) | 20 (Good) | 22 (Good) | 15 (Good) | 19 (Good) | 13 (Good) | 14 (Good) | 33 (Good) | 22 (Good) | 21 (Good) | 19 (Good) | 23 (Good) | 24 (Good) | 26 (Good) | 37 (Good) | 28 (Good) | 19 (Good) | 21 (Good) | 17 (Good) | 20 (Good) |
PM2,5 61 (Unhealthy)
particulate matter (PM2.5) dustNO2 22 (Good)
nitrogen dioxide (NO2)PM10 69 (Unhealthy for Sensitive Groups)
particulate matter (PM10) suspended dustCO 219 (Good)
carbon monoxide (CO)O3 0.05 (Good)
ozone (O3)SO2 7.7 (Good)
sulfur dioxide (SO2)物资局
| index | 2022-05-27 |
|---|---|
| pm25 | 28 |
| no2 | 22 |
| pm10 | 35 |
| co | 579 |
| o3 | 22 |
| so2 | 4.6 |
供销社
| index | 2020-01 | 2019-12 | 2019-11 | 2019-10 | 2019-09 | 2019-08 | 2019-07 | 2019-06 | 2019-05 | 2019-04 | 2019-03 | 2019-02 | 2019-01 | 2018-12 | 2018-11 | 2018-10 |
|---|---|---|---|---|---|---|---|---|---|---|---|---|---|---|---|---|
| pm25 | 72 | 62 | 54 | 51 | 47 | 27 | 42 | 44 | 44 | 51 | 61 | 78 | 84 | 50 | 88 | 58 |
| co | 1 | 1 | 1 | 1 | 1 | 942 | 1 | 1 | 949 | 1 | 1 | 1 | 1 | 1 | 1 | 1 |
| no2 | 67 | 59 | 61 | 60 | 53 | 43 | 40 | 46 | 45 | 45 | 58 | 56 | 66 | 52 | 71 | 52 |
| o3 | 42 | 45 | 55 | 102 | 194 | 149 | 200 | 215 | 186 | 131 | 106 | 78 | 48 | 47 | 58 | 83 |
| pm10 | 116 | 100 | 102 | 96 | 88 | 50 | 79 | 83 | 86 | 103 | 112 | 121 | 129 | 95 | 140 | 98 |
| so2 | 31 | 20 | 22 | 15 | 17 | 12 | 13 | 34 | 22 | 20 | 19 | 22 | 23 | 27 | 36 | 25 |
物资局
| index | 2020-05 | 2020-04 | 2020-03 | 2020-02 | 2020-01 | 2019-12 | 2019-11 | 2019-10 | 2019-09 | 2019-08 | 2019-07 | 2019-06 | 2019-05 | 2019-04 | 2019-03 | 2019-02 | 2019-01 | 2018-12 | 2018-11 | 2018-10 |
|---|---|---|---|---|---|---|---|---|---|---|---|---|---|---|---|---|---|---|---|---|
| pm25 | 34 | 39 | 46 | 71 | 94 | 67 | 54 | 55 | 46 | 24 | 44 | 45 | 45 | 51 | 57 | 65 | 80 | 51 | 89 | 56 |
| co | 1 | 1 | 1 | 1 | 2 | 1 | 1 | 1 | 1 | 828 | 1 | 1 | 971 | 1 | 1 | 1 | 1 | 1 | 1 | 1 |
| no2 | 39 | 45 | 44 | 40 | 60 | 58 | 59 | 60 | 52 | 37 | 35 | 42 | 46 | 49 | 57 | 47 | 58 | 46 | 67 | 60 |
| o3 | 158 | 141 | 97 | 81 | 58 | 36 | 45 | 85 | 165 | 129 | 181 | 196 | 174 | 123 | 99 | 72 | 47 | 46 | 56 | 81 |
| pm10 | 96 | 103 | 92 | 102 | 140 | 119 | 121 | 104 | 100 | 61 | 99 | 103 | 109 | 109 | 107 | 106 | 131 | 100 | 149 | 106 |
| so2 | 19 | 21 | 17 | 20 | 27 | 21 | 22 | 15 | 22 | 14 | 14 | 32 | 21 | 21 | 19 | 24 | 24 | 24 | 39 | 30 |