Air Pollution in Taocun: Real-time Air Quality Index and smog alert.
Pollution and air quality forecast for Taocun. Today is Sunday, June 21, 2026. The following air pollution values have been recorded for Taocun:- particulate matter (PM2.5) dust - 61 (Unhealthy)
- nitrogen dioxide (NO2) - 22 (Good)
- particulate matter (PM10) suspended dust - 69 (Unhealthy for Sensitive Groups)
- carbon monoxide (CO) - 219 (Good)
- ozone (O3) - 0 (Good)
- sulfur dioxide (SO2) - 8 (Good)

What is the air quality in Taocun today? Is the air polluted in Taocun?. Is there smog?
What is the current level of PM2.5 in Taocun? (particulate matter (PM2.5) dust)
Today's PM2.5 level is:
61 (Unhealthy)
For comparison, the highest level of PM2.5 in Taocun in the last 7 days was: 28 (Friday, May 27, 2022) and the lowest: 28 (Friday, May 27, 2022).
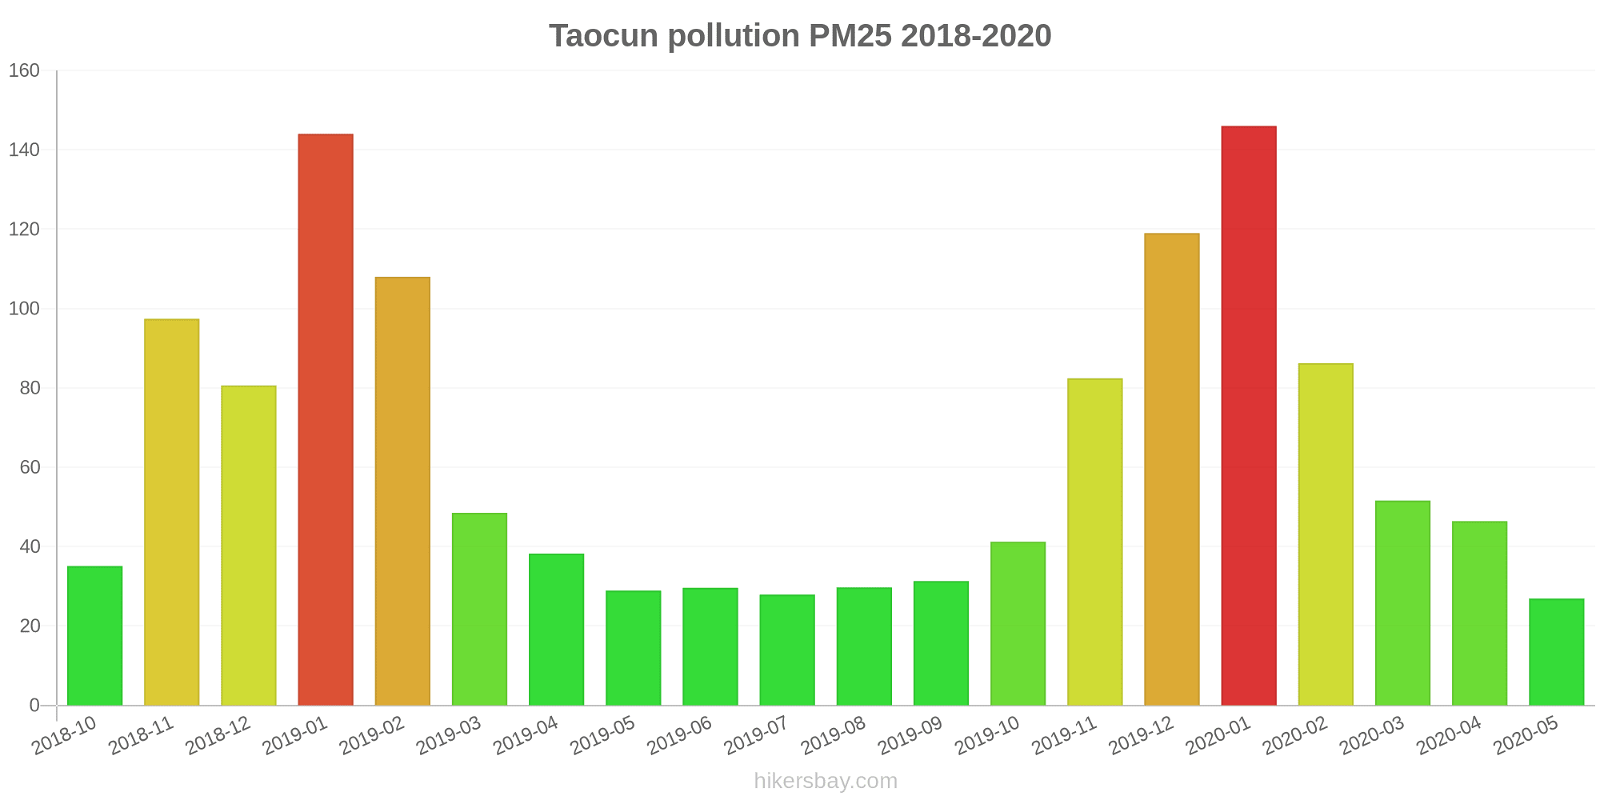
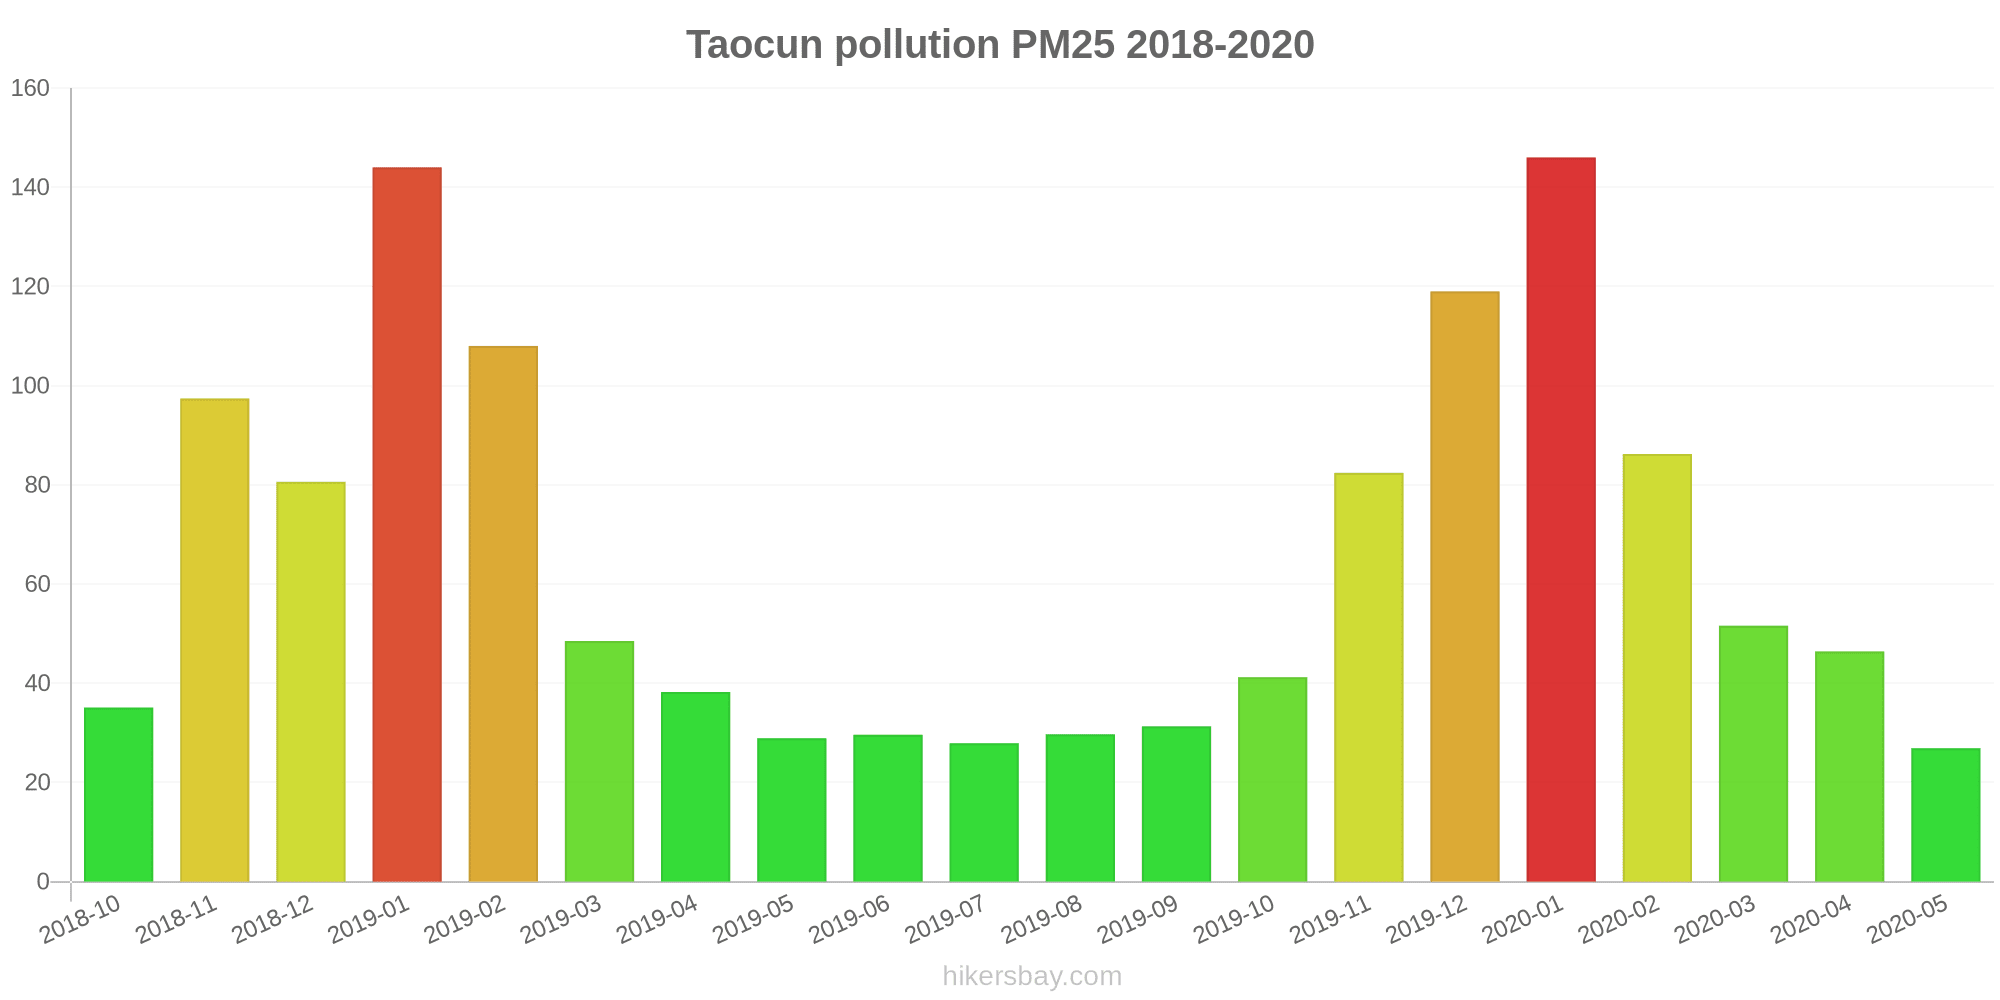
The highest PM2.5 values were recorded: 146 (January 2020).
The lowest level of particulate matter PM2.5 pollution occurs in month: May (27).
How high is the level of NO2? (nitrogen dioxide (NO2))
22 (Good)
What is the level of PM10 today in Taocun? (particulate matter (PM10) suspended dust)
The current level of particulate matter PM10 in Taocun is:
69 (Unhealthy for Sensitive Groups)
The highest PM10 values usually occur in month: 219 (January 2019).
The lowest value of particulate matter PM10 pollution in Taocun is usually recorded in: July (52).
How high is the CO level? (carbon monoxide (CO))
219 (Good)
How is the O3 level today in Taocun? (ozone (O3))
0 (Good)
What is the level of SO2 pollution? (sulfur dioxide (SO2))
8 (Good)
Current data Friday, May 27, 2022, 3:00 PM
PM2,5 61 (Unhealthy)
NO2 22 (Good)
PM10 69 (Unhealthy for Sensitive Groups)
CO 219 (Good)
O3 0 (Good)
SO2 8 (Good)
Data on air pollution from recent days in Taocun
index
2022-05-27
pm25
28
Moderate
no2
22
Good
pm10
35
Moderate
co
579
Good
o3
22
Good
so2
5
Good
data source »
Air pollution in Taocun from October 2018 to May 2020
index
2020-05
2020-04
2020-03
2020-02
2020-01
2019-12
2019-11
2019-10
2019-09
2019-08
2019-07
2019-06
2019-05
2019-04
2019-03
2019-02
2019-01
2018-12
2018-11
2018-10
pm25
27 (Moderate)
46 (Unhealthy for Sensitive Groups)
52 (Unhealthy for Sensitive Groups)
86 (Very Unhealthy)
146 (Very bad Hazardous)
119 (Very bad Hazardous)
82 (Very Unhealthy)
41 (Unhealthy for Sensitive Groups)
31 (Moderate)
30 (Moderate)
28 (Moderate)
30 (Moderate)
29 (Moderate)
38 (Unhealthy for Sensitive Groups)
49 (Unhealthy for Sensitive Groups)
108 (Very Unhealthy)
144 (Very bad Hazardous)
81 (Very Unhealthy)
97 (Very Unhealthy)
35 (Unhealthy for Sensitive Groups)
co
593 (Good)
864 (Good)
938 (Good)
1 (Good)
2 (Good)
1 (Good)
1 (Good)
1 (Good)
1 (Good)
1 (Good)
776 (Good)
764 (Good)
717 (Good)
1 (Good)
1 (Good)
1 (Good)
2 (Good)
1 (Good)
1 (Good)
1 (Good)
no2
23 (Good)
32 (Good)
28 (Good)
23 (Good)
40 (Moderate)
49 (Moderate)
41 (Moderate)
32 (Good)
26 (Good)
22 (Good)
19 (Good)
21 (Good)
25 (Good)
25 (Good)
35 (Good)
26 (Good)
51 (Moderate)
46 (Moderate)
49 (Moderate)
43 (Moderate)
o3
159 (Unhealthy)
144 (Unhealthy for Sensitive Groups)
116 (Moderate)
113 (Moderate)
81 (Moderate)
74 (Moderate)
82 (Moderate)
101 (Moderate)
157 (Unhealthy)
161 (Unhealthy)
174 (Unhealthy)
190 (Very Unhealthy)
159 (Unhealthy)
136 (Unhealthy for Sensitive Groups)
126 (Unhealthy for Sensitive Groups)
105 (Moderate)
68 (Good)
54 (Good)
82 (Moderate)
111 (Moderate)
pm10
65 (Unhealthy for Sensitive Groups)
82 (Unhealthy)
91 (Unhealthy)
112 (Very Unhealthy)
162 (Very bad Hazardous)
150 (Very bad Hazardous)
118 (Very Unhealthy)
80 (Unhealthy for Sensitive Groups)
56 (Unhealthy for Sensitive Groups)
53 (Unhealthy for Sensitive Groups)
52 (Unhealthy for Sensitive Groups)
62 (Unhealthy for Sensitive Groups)
100 (Unhealthy)
93 (Unhealthy)
114 (Very Unhealthy)
174 (Very bad Hazardous)
219 (Very bad Hazardous)
163 (Very bad Hazardous)
173 (Very bad Hazardous)
98 (Unhealthy)
so2
11 (Good)
15 (Good)
13 (Good)
14 (Good)
20 (Good)
24 (Good)
18 (Good)
6.3 (Good)
8.7 (Good)
9.5 (Good)
8.3 (Good)
9.4 (Good)
6.4 (Good)
8.3 (Good)
18 (Good)
19 (Good)
36 (Good)
35 (Good)
20 (Good)
14 (Good)
data source »
空港新区
Friday, May 27, 2022, 3:00 PM
PM2,5 61 (Unhealthy)
particulate matter (PM2.5) dust
NO2 22 (Good)
nitrogen dioxide (NO2)
PM10 69 (Unhealthy for Sensitive Groups)
particulate matter (PM10) suspended dust
CO 219 (Good)
carbon monoxide (CO)
O3 0.05 (Good)
ozone (O3)
SO2 7.7 (Good)
sulfur dioxide (SO2)
空港新区
index
2022-05-27
pm25
28
no2
22
pm10
35
co
579
o3
22
so2
4.6
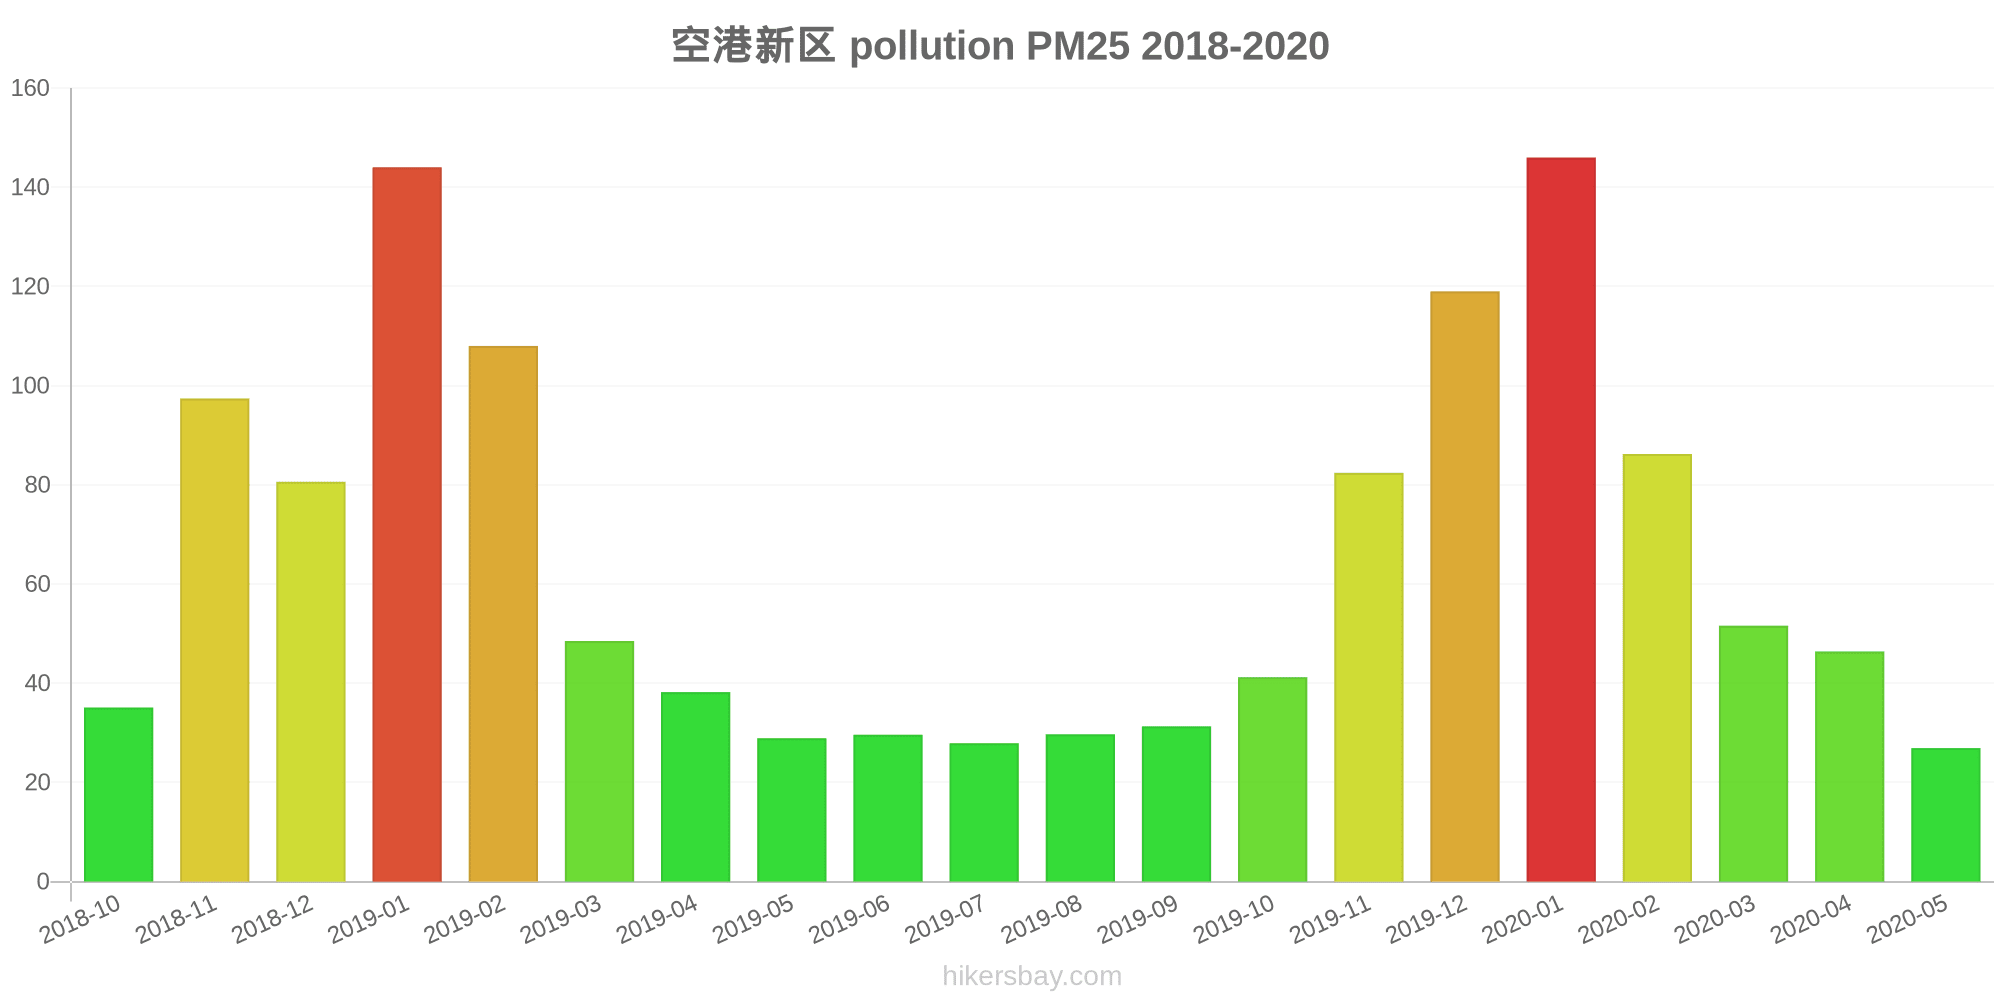
空港新区
2018-10 2020-05

index
2020-05
2020-04
2020-03
2020-02
2020-01
2019-12
2019-11
2019-10
2019-09
2019-08
2019-07
2019-06
2019-05
2019-04
2019-03
2019-02
2019-01
2018-12
2018-11
2018-10
pm25
27
46
52
86
146
119
82
41
31
30
28
30
29
38
49
108
144
81
97
35
co
593
864
938
1
2
1
1
1
1
1
776
764
717
1
1
1
2
1
1
1
no2
23
32
28
23
40
49
41
32
26
22
19
21
25
25
35
26
51
46
49
43
o3
159
144
116
113
81
74
82
101
157
161
174
190
159
136
126
105
68
54
82
111
pm10
65
82
91
112
162
150
118
80
56
53
52
62
100
93
114
174
219
163
173
98
so2
11
15
13
14
20
24
18
6.3
8.7
9.5
8.3
9.4
6.4
8.3
18
19
36
35
20
14
* Pollution data source:
https://openaq.org
(ChinaAQIData)
The data is licensed under CC-By 4.0
PM2,5 61 (Unhealthy)
NO2 22 (Good)
PM10 69 (Unhealthy for Sensitive Groups)
CO 219 (Good)
O3 0 (Good)
SO2 8 (Good)
Data on air pollution from recent days in Taocun
| index | 2022-05-27 |
|---|---|
| pm25 | 28 Moderate |
| no2 | 22 Good |
| pm10 | 35 Moderate |
| co | 579 Good |
| o3 | 22 Good |
| so2 | 5 Good |
| index | 2020-05 | 2020-04 | 2020-03 | 2020-02 | 2020-01 | 2019-12 | 2019-11 | 2019-10 | 2019-09 | 2019-08 | 2019-07 | 2019-06 | 2019-05 | 2019-04 | 2019-03 | 2019-02 | 2019-01 | 2018-12 | 2018-11 | 2018-10 |
|---|---|---|---|---|---|---|---|---|---|---|---|---|---|---|---|---|---|---|---|---|
| pm25 | 27 (Moderate) | 46 (Unhealthy for Sensitive Groups) | 52 (Unhealthy for Sensitive Groups) | 86 (Very Unhealthy) | 146 (Very bad Hazardous) | 119 (Very bad Hazardous) | 82 (Very Unhealthy) | 41 (Unhealthy for Sensitive Groups) | 31 (Moderate) | 30 (Moderate) | 28 (Moderate) | 30 (Moderate) | 29 (Moderate) | 38 (Unhealthy for Sensitive Groups) | 49 (Unhealthy for Sensitive Groups) | 108 (Very Unhealthy) | 144 (Very bad Hazardous) | 81 (Very Unhealthy) | 97 (Very Unhealthy) | 35 (Unhealthy for Sensitive Groups) |
| co | 593 (Good) | 864 (Good) | 938 (Good) | 1 (Good) | 2 (Good) | 1 (Good) | 1 (Good) | 1 (Good) | 1 (Good) | 1 (Good) | 776 (Good) | 764 (Good) | 717 (Good) | 1 (Good) | 1 (Good) | 1 (Good) | 2 (Good) | 1 (Good) | 1 (Good) | 1 (Good) |
| no2 | 23 (Good) | 32 (Good) | 28 (Good) | 23 (Good) | 40 (Moderate) | 49 (Moderate) | 41 (Moderate) | 32 (Good) | 26 (Good) | 22 (Good) | 19 (Good) | 21 (Good) | 25 (Good) | 25 (Good) | 35 (Good) | 26 (Good) | 51 (Moderate) | 46 (Moderate) | 49 (Moderate) | 43 (Moderate) |
| o3 | 159 (Unhealthy) | 144 (Unhealthy for Sensitive Groups) | 116 (Moderate) | 113 (Moderate) | 81 (Moderate) | 74 (Moderate) | 82 (Moderate) | 101 (Moderate) | 157 (Unhealthy) | 161 (Unhealthy) | 174 (Unhealthy) | 190 (Very Unhealthy) | 159 (Unhealthy) | 136 (Unhealthy for Sensitive Groups) | 126 (Unhealthy for Sensitive Groups) | 105 (Moderate) | 68 (Good) | 54 (Good) | 82 (Moderate) | 111 (Moderate) |
| pm10 | 65 (Unhealthy for Sensitive Groups) | 82 (Unhealthy) | 91 (Unhealthy) | 112 (Very Unhealthy) | 162 (Very bad Hazardous) | 150 (Very bad Hazardous) | 118 (Very Unhealthy) | 80 (Unhealthy for Sensitive Groups) | 56 (Unhealthy for Sensitive Groups) | 53 (Unhealthy for Sensitive Groups) | 52 (Unhealthy for Sensitive Groups) | 62 (Unhealthy for Sensitive Groups) | 100 (Unhealthy) | 93 (Unhealthy) | 114 (Very Unhealthy) | 174 (Very bad Hazardous) | 219 (Very bad Hazardous) | 163 (Very bad Hazardous) | 173 (Very bad Hazardous) | 98 (Unhealthy) |
| so2 | 11 (Good) | 15 (Good) | 13 (Good) | 14 (Good) | 20 (Good) | 24 (Good) | 18 (Good) | 6.3 (Good) | 8.7 (Good) | 9.5 (Good) | 8.3 (Good) | 9.4 (Good) | 6.4 (Good) | 8.3 (Good) | 18 (Good) | 19 (Good) | 36 (Good) | 35 (Good) | 20 (Good) | 14 (Good) |
PM2,5 61 (Unhealthy)
particulate matter (PM2.5) dustNO2 22 (Good)
nitrogen dioxide (NO2)PM10 69 (Unhealthy for Sensitive Groups)
particulate matter (PM10) suspended dustCO 219 (Good)
carbon monoxide (CO)O3 0.05 (Good)
ozone (O3)SO2 7.7 (Good)
sulfur dioxide (SO2)空港新区
| index | 2022-05-27 |
|---|---|
| pm25 | 28 |
| no2 | 22 |
| pm10 | 35 |
| co | 579 |
| o3 | 22 |
| so2 | 4.6 |
空港新区
| index | 2020-05 | 2020-04 | 2020-03 | 2020-02 | 2020-01 | 2019-12 | 2019-11 | 2019-10 | 2019-09 | 2019-08 | 2019-07 | 2019-06 | 2019-05 | 2019-04 | 2019-03 | 2019-02 | 2019-01 | 2018-12 | 2018-11 | 2018-10 |
|---|---|---|---|---|---|---|---|---|---|---|---|---|---|---|---|---|---|---|---|---|
| pm25 | 27 | 46 | 52 | 86 | 146 | 119 | 82 | 41 | 31 | 30 | 28 | 30 | 29 | 38 | 49 | 108 | 144 | 81 | 97 | 35 |
| co | 593 | 864 | 938 | 1 | 2 | 1 | 1 | 1 | 1 | 1 | 776 | 764 | 717 | 1 | 1 | 1 | 2 | 1 | 1 | 1 |
| no2 | 23 | 32 | 28 | 23 | 40 | 49 | 41 | 32 | 26 | 22 | 19 | 21 | 25 | 25 | 35 | 26 | 51 | 46 | 49 | 43 |
| o3 | 159 | 144 | 116 | 113 | 81 | 74 | 82 | 101 | 157 | 161 | 174 | 190 | 159 | 136 | 126 | 105 | 68 | 54 | 82 | 111 |
| pm10 | 65 | 82 | 91 | 112 | 162 | 150 | 118 | 80 | 56 | 53 | 52 | 62 | 100 | 93 | 114 | 174 | 219 | 163 | 173 | 98 |
| so2 | 11 | 15 | 13 | 14 | 20 | 24 | 18 | 6.3 | 8.7 | 9.5 | 8.3 | 9.4 | 6.4 | 8.3 | 18 | 19 | 36 | 35 | 20 | 14 |