Air Pollution in Tianshui: Real-time Air Quality Index and smog alert.
Pollution and air quality forecast for Tianshui. Today is Tuesday, June 2, 2026. The following air pollution values have been recorded for Tianshui:- particulate matter (PM2.5) dust - 61 (Unhealthy)
- nitrogen dioxide (NO2) - 22 (Good)
- particulate matter (PM10) suspended dust - 69 (Unhealthy for Sensitive Groups)
- carbon monoxide (CO) - 219 (Good)
- ozone (O3) - 0 (Good)
- sulfur dioxide (SO2) - 8 (Good)

What is the air quality in Tianshui today? Is the air polluted in Tianshui?. Is there smog?
What is the current level of PM2.5 in Tianshui? (particulate matter (PM2.5) dust)
Today's PM2.5 level is:
61 (Unhealthy)
For comparison, the highest level of PM2.5 in Tianshui in the last 7 days was: 28 (Friday, May 27, 2022) and the lowest: 28 (Friday, May 27, 2022).
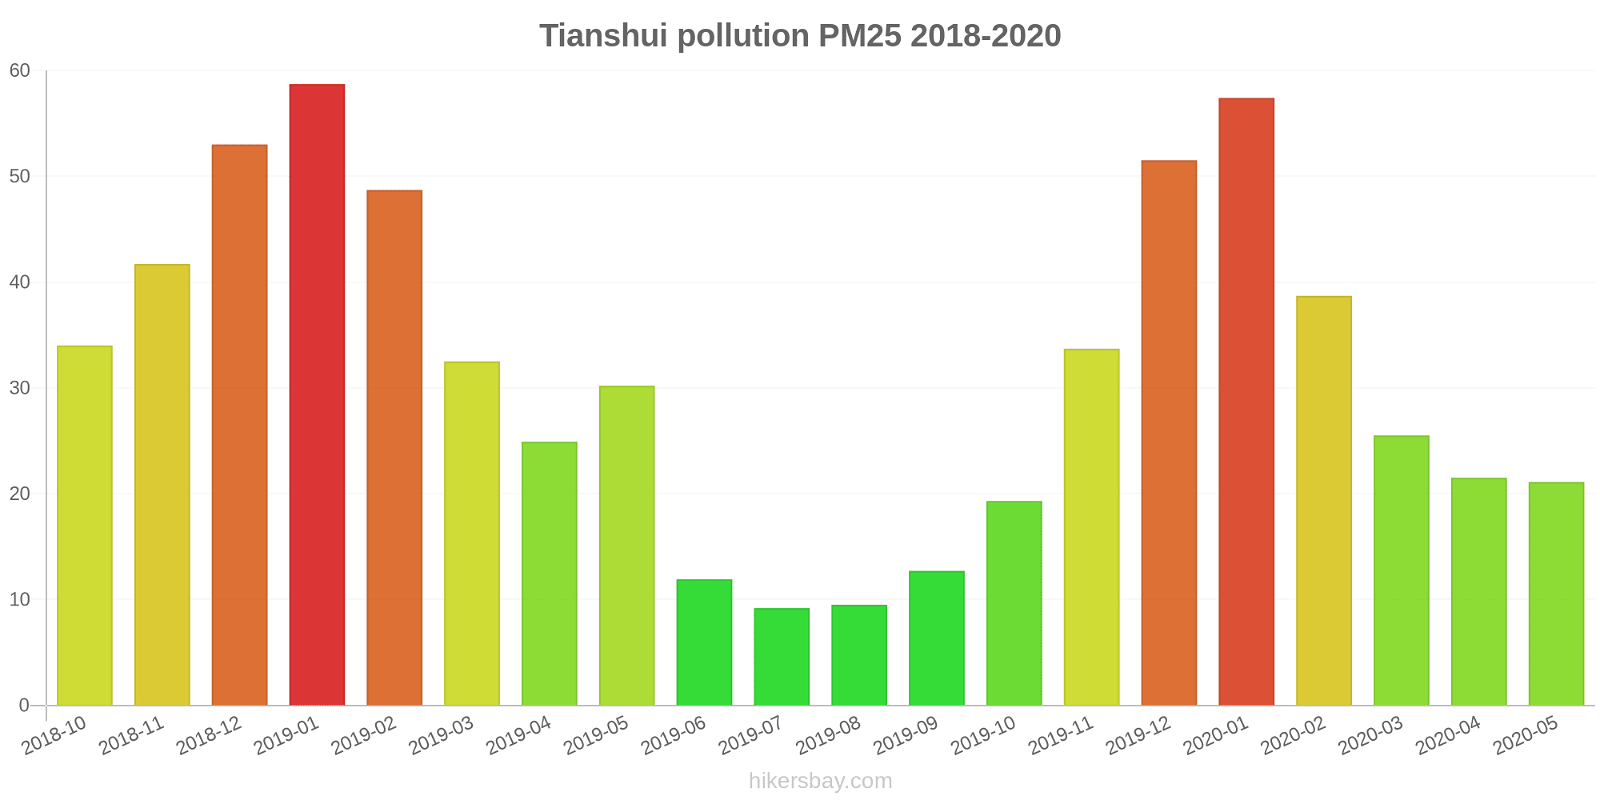
The highest PM2.5 values were recorded: 59 (January 2019).
The lowest level of particulate matter PM2.5 pollution occurs in month: July (9.2).
How high is the level of NO2? (nitrogen dioxide (NO2))
22 (Good)
What is the level of PM10 today in Tianshui? (particulate matter (PM10) suspended dust)
The current level of particulate matter PM10 in Tianshui is:
69 (Unhealthy for Sensitive Groups)
The highest PM10 values usually occur in month: 118 (December 2018).
The lowest value of particulate matter PM10 pollution in Tianshui is usually recorded in: July (22).
How high is the CO level? (carbon monoxide (CO))
219 (Good)
How is the O3 level today in Tianshui? (ozone (O3))
0 (Good)
What is the level of SO2 pollution? (sulfur dioxide (SO2))
8 (Good)
Current data Friday, May 27, 2022, 3:00 PM
PM2,5 61 (Unhealthy)
NO2 22 (Good)
PM10 69 (Unhealthy for Sensitive Groups)
CO 219 (Good)
O3 0 (Good)
SO2 8 (Good)
Data on air pollution from recent days in Tianshui
index
2022-05-27
pm25
28
Moderate
no2
22
Good
pm10
35
Moderate
co
579
Good
o3
22
Good
so2
5
Good
data source »
Air pollution in Tianshui from October 2018 to May 2020
index
2020-05
2020-04
2020-03
2020-02
2020-01
2019-12
2019-11
2019-10
2019-09
2019-08
2019-07
2019-06
2019-05
2019-04
2019-03
2019-02
2019-01
2018-12
2018-11
2018-10
pm25
21 (Moderate)
22 (Moderate)
26 (Moderate)
39 (Unhealthy for Sensitive Groups)
57 (Unhealthy)
52 (Unhealthy for Sensitive Groups)
34 (Moderate)
19 (Moderate)
13 (Good)
9.5 (Good)
9.2 (Good)
12 (Good)
30 (Moderate)
25 (Moderate)
33 (Moderate)
49 (Unhealthy for Sensitive Groups)
59 (Unhealthy)
53 (Unhealthy for Sensitive Groups)
42 (Unhealthy for Sensitive Groups)
34 (Moderate)
co
326 (Good)
384 (Good)
440 (Good)
698 (Good)
1 (Good)
990 (Good)
704 (Good)
463 (Good)
396 (Good)
377 (Good)
322 (Good)
535 (Good)
270 (Good)
449 (Good)
908 (Good)
1 (Good)
1 (Good)
1 (Good)
982 (Good)
593 (Good)
no2
25 (Good)
34 (Good)
31 (Good)
25 (Good)
37 (Good)
58 (Moderate)
42 (Moderate)
33 (Good)
29 (Good)
23 (Good)
20 (Good)
24 (Good)
24 (Good)
30 (Good)
35 (Good)
24 (Good)
45 (Moderate)
43 (Moderate)
38 (Good)
35 (Good)
o3
140 (Unhealthy for Sensitive Groups)
123 (Unhealthy for Sensitive Groups)
103 (Moderate)
93 (Moderate)
78 (Moderate)
65 (Good)
60 (Good)
79 (Moderate)
101 (Moderate)
127 (Unhealthy for Sensitive Groups)
129 (Unhealthy for Sensitive Groups)
120 (Unhealthy for Sensitive Groups)
116 (Moderate)
122 (Unhealthy for Sensitive Groups)
108 (Moderate)
85 (Moderate)
75 (Moderate)
52 (Good)
73 (Moderate)
90 (Moderate)
pm10
57 (Unhealthy for Sensitive Groups)
52 (Unhealthy for Sensitive Groups)
66 (Unhealthy for Sensitive Groups)
64 (Unhealthy for Sensitive Groups)
78 (Unhealthy for Sensitive Groups)
88 (Unhealthy)
68 (Unhealthy for Sensitive Groups)
37 (Moderate)
27 (Moderate)
24 (Moderate)
22 (Moderate)
28 (Moderate)
89 (Unhealthy)
58 (Unhealthy for Sensitive Groups)
75 (Unhealthy for Sensitive Groups)
82 (Unhealthy)
96 (Unhealthy)
118 (Very Unhealthy)
90 (Unhealthy)
73 (Unhealthy for Sensitive Groups)
so2
5.8 (Good)
6.2 (Good)
7.8 (Good)
11 (Good)
18 (Good)
18 (Good)
15 (Good)
12 (Good)
11 (Good)
9.8 (Good)
9.7 (Good)
11 (Good)
9.7 (Good)
11 (Good)
16 (Good)
19 (Good)
25 (Good)
24 (Good)
20 (Good)
13 (Good)
data source »
Quality of life in Tianshui
Green and Parks in the City
Tianshui
58%
Mongolia: 27%
Bhutan: 82%
Hong Kong: 52%
Myanmar: 33%
particulate matter PM2.5
Tianshui
53 (Unhealthy for Sensitive Groups)
Pleasure of spending time in the city
Tianshui
45%
Mongolia: 22%
Bhutan: 61%
Hong Kong: 43%
Myanmar: 24%
particulate matter PM10
Tianshui
130 (Very Unhealthy)
Air Pollution
Tianshui
68%
Mongolia: 87%
Bhutan: 45%
Hong Kong: 67%
Myanmar: 83%
Garbage Disposal
Tianshui
83%
Mongolia: 27%
Bhutan: 47%
Hong Kong: 52%
Myanmar: 12%
Availability and quality of drinking water
Tianshui
75%
Mongolia: 46%
Bhutan: 64%
Hong Kong: 66%
Myanmar: 34%
Cleanliness and tidiness
Tianshui
75%
Mongolia: 29%
Bhutan: 57%
Hong Kong: 54%
Myanmar: 18%
Noise and Light pollution
Tianshui
8.3%
Mongolia: 48%
Bhutan: 55%
Hong Kong: 66%
Myanmar: 52%
Water Pollution
Tianshui
33%
Mongolia: 68%
Bhutan: 56%
Hong Kong: 53%
Myanmar: 74%
Source: Numbeo
进步巷
Friday, May 27, 2022, 3:00 PM
PM2,5 61 (Unhealthy)
particulate matter (PM2.5) dust
NO2 22 (Good)
nitrogen dioxide (NO2)
PM10 69 (Unhealthy for Sensitive Groups)
particulate matter (PM10) suspended dust
CO 219 (Good)
carbon monoxide (CO)
O3 0.05 (Good)
ozone (O3)
SO2 7.7 (Good)
sulfur dioxide (SO2)
进步巷
index
2022-05-27
pm25
28
no2
22
pm10
35
co
579
o3
22
so2
4.6
进步巷
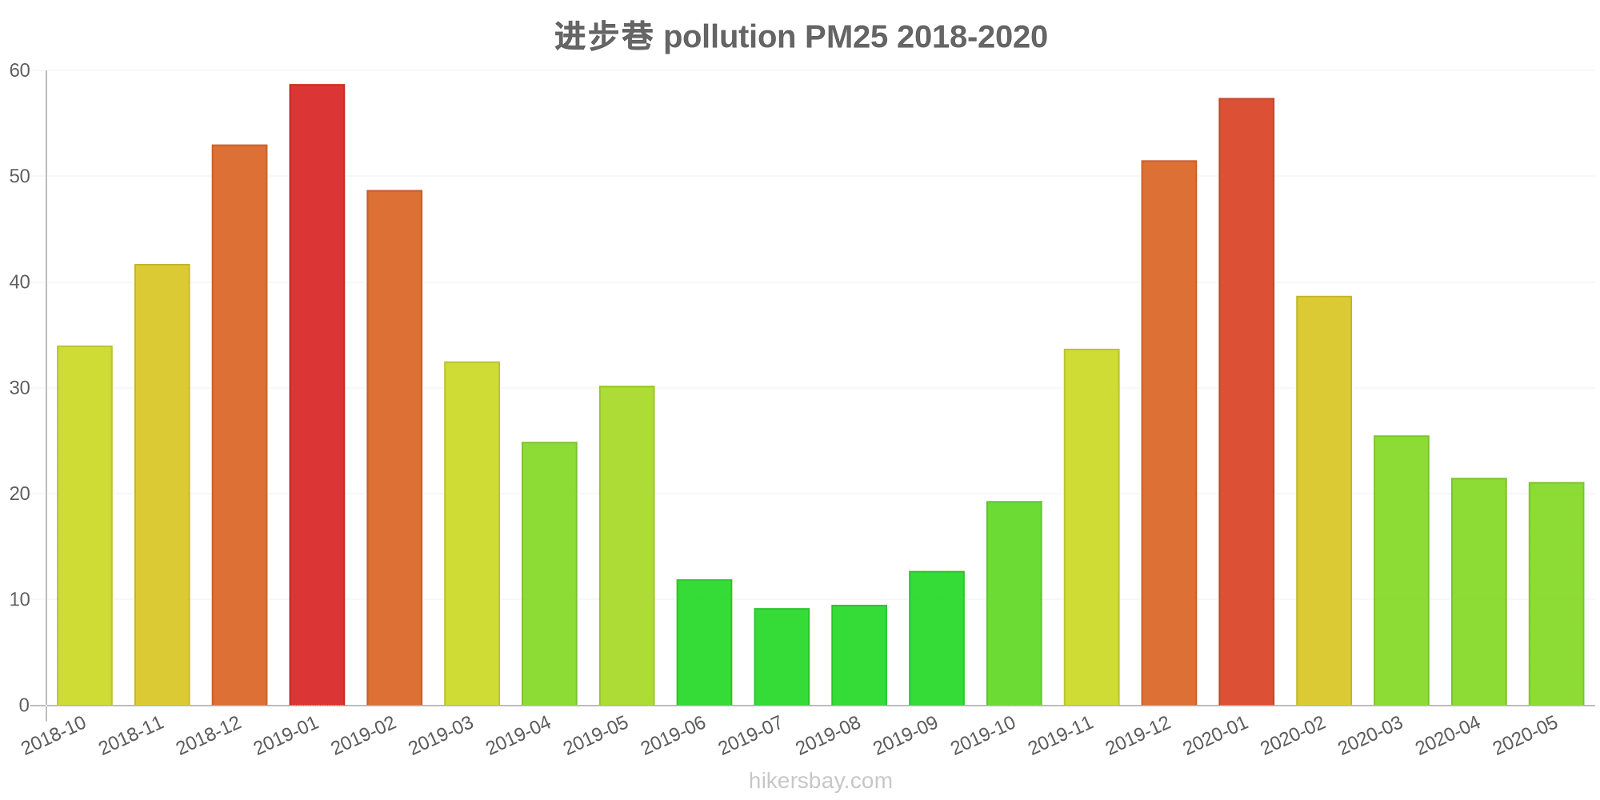
2018-10 2020-05
index
2020-05
2020-04
2020-03
2020-02
2020-01
2019-12
2019-11
2019-10
2019-09
2019-08
2019-07
2019-06
2019-05
2019-04
2019-03
2019-02
2019-01
2018-12
2018-11
2018-10
pm25
21
22
26
39
57
52
34
19
13
9.5
9.2
12
30
25
33
49
59
53
42
34
co
326
384
440
698
1
990
704
463
396
377
322
535
270
449
908
1
1
1
982
593
no2
25
34
31
25
37
58
42
33
29
23
20
24
24
30
35
24
45
43
38
35
o3
140
123
103
93
78
65
60
79
101
127
129
120
116
122
108
85
75
52
73
90
pm10
57
52
66
64
78
88
68
37
27
24
22
28
89
58
75
82
96
118
90
73
so2
5.8
6.2
7.8
11
18
18
15
12
11
9.8
9.7
11
9.7
11
16
19
25
24
20
13
* Pollution data source:
https://openaq.org
(ChinaAQIData)
The data is licensed under CC-By 4.0
PM2,5 61 (Unhealthy)
NO2 22 (Good)
PM10 69 (Unhealthy for Sensitive Groups)
CO 219 (Good)
O3 0 (Good)
SO2 8 (Good)
Data on air pollution from recent days in Tianshui
| index | 2022-05-27 |
|---|---|
| pm25 | 28 Moderate |
| no2 | 22 Good |
| pm10 | 35 Moderate |
| co | 579 Good |
| o3 | 22 Good |
| so2 | 5 Good |

| index | 2020-05 | 2020-04 | 2020-03 | 2020-02 | 2020-01 | 2019-12 | 2019-11 | 2019-10 | 2019-09 | 2019-08 | 2019-07 | 2019-06 | 2019-05 | 2019-04 | 2019-03 | 2019-02 | 2019-01 | 2018-12 | 2018-11 | 2018-10 |
|---|---|---|---|---|---|---|---|---|---|---|---|---|---|---|---|---|---|---|---|---|
| pm25 | 21 (Moderate) | 22 (Moderate) | 26 (Moderate) | 39 (Unhealthy for Sensitive Groups) | 57 (Unhealthy) | 52 (Unhealthy for Sensitive Groups) | 34 (Moderate) | 19 (Moderate) | 13 (Good) | 9.5 (Good) | 9.2 (Good) | 12 (Good) | 30 (Moderate) | 25 (Moderate) | 33 (Moderate) | 49 (Unhealthy for Sensitive Groups) | 59 (Unhealthy) | 53 (Unhealthy for Sensitive Groups) | 42 (Unhealthy for Sensitive Groups) | 34 (Moderate) |
| co | 326 (Good) | 384 (Good) | 440 (Good) | 698 (Good) | 1 (Good) | 990 (Good) | 704 (Good) | 463 (Good) | 396 (Good) | 377 (Good) | 322 (Good) | 535 (Good) | 270 (Good) | 449 (Good) | 908 (Good) | 1 (Good) | 1 (Good) | 1 (Good) | 982 (Good) | 593 (Good) |
| no2 | 25 (Good) | 34 (Good) | 31 (Good) | 25 (Good) | 37 (Good) | 58 (Moderate) | 42 (Moderate) | 33 (Good) | 29 (Good) | 23 (Good) | 20 (Good) | 24 (Good) | 24 (Good) | 30 (Good) | 35 (Good) | 24 (Good) | 45 (Moderate) | 43 (Moderate) | 38 (Good) | 35 (Good) |
| o3 | 140 (Unhealthy for Sensitive Groups) | 123 (Unhealthy for Sensitive Groups) | 103 (Moderate) | 93 (Moderate) | 78 (Moderate) | 65 (Good) | 60 (Good) | 79 (Moderate) | 101 (Moderate) | 127 (Unhealthy for Sensitive Groups) | 129 (Unhealthy for Sensitive Groups) | 120 (Unhealthy for Sensitive Groups) | 116 (Moderate) | 122 (Unhealthy for Sensitive Groups) | 108 (Moderate) | 85 (Moderate) | 75 (Moderate) | 52 (Good) | 73 (Moderate) | 90 (Moderate) |
| pm10 | 57 (Unhealthy for Sensitive Groups) | 52 (Unhealthy for Sensitive Groups) | 66 (Unhealthy for Sensitive Groups) | 64 (Unhealthy for Sensitive Groups) | 78 (Unhealthy for Sensitive Groups) | 88 (Unhealthy) | 68 (Unhealthy for Sensitive Groups) | 37 (Moderate) | 27 (Moderate) | 24 (Moderate) | 22 (Moderate) | 28 (Moderate) | 89 (Unhealthy) | 58 (Unhealthy for Sensitive Groups) | 75 (Unhealthy for Sensitive Groups) | 82 (Unhealthy) | 96 (Unhealthy) | 118 (Very Unhealthy) | 90 (Unhealthy) | 73 (Unhealthy for Sensitive Groups) |
| so2 | 5.8 (Good) | 6.2 (Good) | 7.8 (Good) | 11 (Good) | 18 (Good) | 18 (Good) | 15 (Good) | 12 (Good) | 11 (Good) | 9.8 (Good) | 9.7 (Good) | 11 (Good) | 9.7 (Good) | 11 (Good) | 16 (Good) | 19 (Good) | 25 (Good) | 24 (Good) | 20 (Good) | 13 (Good) |
Green and Parks in the City
Tianshui 58%
Mongolia: 27% Bhutan: 82% Hong Kong: 52% Myanmar: 33%particulate matter PM2.5
Tianshui 53 (Unhealthy for Sensitive Groups)
Pleasure of spending time in the city
Tianshui 45%
Mongolia: 22% Bhutan: 61% Hong Kong: 43% Myanmar: 24%particulate matter PM10
Tianshui 130 (Very Unhealthy)
Air Pollution
Tianshui 68%
Mongolia: 87% Bhutan: 45% Hong Kong: 67% Myanmar: 83%Garbage Disposal
Tianshui 83%
Mongolia: 27% Bhutan: 47% Hong Kong: 52% Myanmar: 12%Availability and quality of drinking water
Tianshui 75%
Mongolia: 46% Bhutan: 64% Hong Kong: 66% Myanmar: 34%Cleanliness and tidiness
Tianshui 75%
Mongolia: 29% Bhutan: 57% Hong Kong: 54% Myanmar: 18%Noise and Light pollution
Tianshui 8.3%
Mongolia: 48% Bhutan: 55% Hong Kong: 66% Myanmar: 52%Water Pollution
Tianshui 33%
Mongolia: 68% Bhutan: 56% Hong Kong: 53% Myanmar: 74%PM2,5 61 (Unhealthy)
particulate matter (PM2.5) dustNO2 22 (Good)
nitrogen dioxide (NO2)PM10 69 (Unhealthy for Sensitive Groups)
particulate matter (PM10) suspended dustCO 219 (Good)
carbon monoxide (CO)O3 0.05 (Good)
ozone (O3)SO2 7.7 (Good)
sulfur dioxide (SO2)进步巷
| index | 2022-05-27 |
|---|---|
| pm25 | 28 |
| no2 | 22 |
| pm10 | 35 |
| co | 579 |
| o3 | 22 |
| so2 | 4.6 |
进步巷

| index | 2020-05 | 2020-04 | 2020-03 | 2020-02 | 2020-01 | 2019-12 | 2019-11 | 2019-10 | 2019-09 | 2019-08 | 2019-07 | 2019-06 | 2019-05 | 2019-04 | 2019-03 | 2019-02 | 2019-01 | 2018-12 | 2018-11 | 2018-10 |
|---|---|---|---|---|---|---|---|---|---|---|---|---|---|---|---|---|---|---|---|---|
| pm25 | 21 | 22 | 26 | 39 | 57 | 52 | 34 | 19 | 13 | 9.5 | 9.2 | 12 | 30 | 25 | 33 | 49 | 59 | 53 | 42 | 34 |
| co | 326 | 384 | 440 | 698 | 1 | 990 | 704 | 463 | 396 | 377 | 322 | 535 | 270 | 449 | 908 | 1 | 1 | 1 | 982 | 593 |
| no2 | 25 | 34 | 31 | 25 | 37 | 58 | 42 | 33 | 29 | 23 | 20 | 24 | 24 | 30 | 35 | 24 | 45 | 43 | 38 | 35 |
| o3 | 140 | 123 | 103 | 93 | 78 | 65 | 60 | 79 | 101 | 127 | 129 | 120 | 116 | 122 | 108 | 85 | 75 | 52 | 73 | 90 |
| pm10 | 57 | 52 | 66 | 64 | 78 | 88 | 68 | 37 | 27 | 24 | 22 | 28 | 89 | 58 | 75 | 82 | 96 | 118 | 90 | 73 |
| so2 | 5.8 | 6.2 | 7.8 | 11 | 18 | 18 | 15 | 12 | 11 | 9.8 | 9.7 | 11 | 9.7 | 11 | 16 | 19 | 25 | 24 | 20 | 13 |