Air Pollution in Tongren Diqu: Real-time Air Quality Index and smog alert.
Pollution and air quality forecast for Tongren Diqu. Today is Tuesday, June 2, 2026. The following air pollution values have been recorded for Tongren Diqu:- particulate matter (PM2.5) dust - 61 (Unhealthy)
- nitrogen dioxide (NO2) - 22 (Good)
- particulate matter (PM10) suspended dust - 69 (Unhealthy for Sensitive Groups)
- carbon monoxide (CO) - 219 (Good)
- ozone (O3) - 0 (Good)
- sulfur dioxide (SO2) - 8 (Good)

What is the air quality in Tongren Diqu today? Is the air polluted in Tongren Diqu?. Is there smog?
What is the current level of PM2.5 in Tongren Diqu? (particulate matter (PM2.5) dust)
Today's PM2.5 level is:
61 (Unhealthy)
For comparison, the highest level of PM2.5 in Tongren Diqu in the last 7 days was: 28 (Friday, May 27, 2022) and the lowest: 28 (Friday, May 27, 2022).
The highest PM2.5 values were recorded: 75 (January 2019).
The lowest level of particulate matter PM2.5 pollution occurs in month: July (8.1).
How high is the level of NO2? (nitrogen dioxide (NO2))
22 (Good)
What is the level of PM10 today in Tongren Diqu? (particulate matter (PM10) suspended dust)
The current level of particulate matter PM10 in Tongren Diqu is:
69 (Unhealthy for Sensitive Groups)
The highest PM10 values usually occur in month: 92 (January 2019).
The lowest value of particulate matter PM10 pollution in Tongren Diqu is usually recorded in: July (20).
How high is the CO level? (carbon monoxide (CO))
219 (Good)
How is the O3 level today in Tongren Diqu? (ozone (O3))
0 (Good)
What is the level of SO2 pollution? (sulfur dioxide (SO2))
8 (Good)
Current data Friday, May 27, 2022, 3:00 PM
PM2,5 61 (Unhealthy)
NO2 22 (Good)
PM10 69 (Unhealthy for Sensitive Groups)
CO 219 (Good)
O3 0 (Good)
SO2 8 (Good)
Data on air pollution from recent days in Tongren Diqu
index
2022-05-27
pm25
28
Moderate
no2
22
Good
pm10
35
Moderate
co
579
Good
o3
22
Good
so2
5
Good
data source »
Air pollution in Tongren Diqu from October 2018 to May 2020
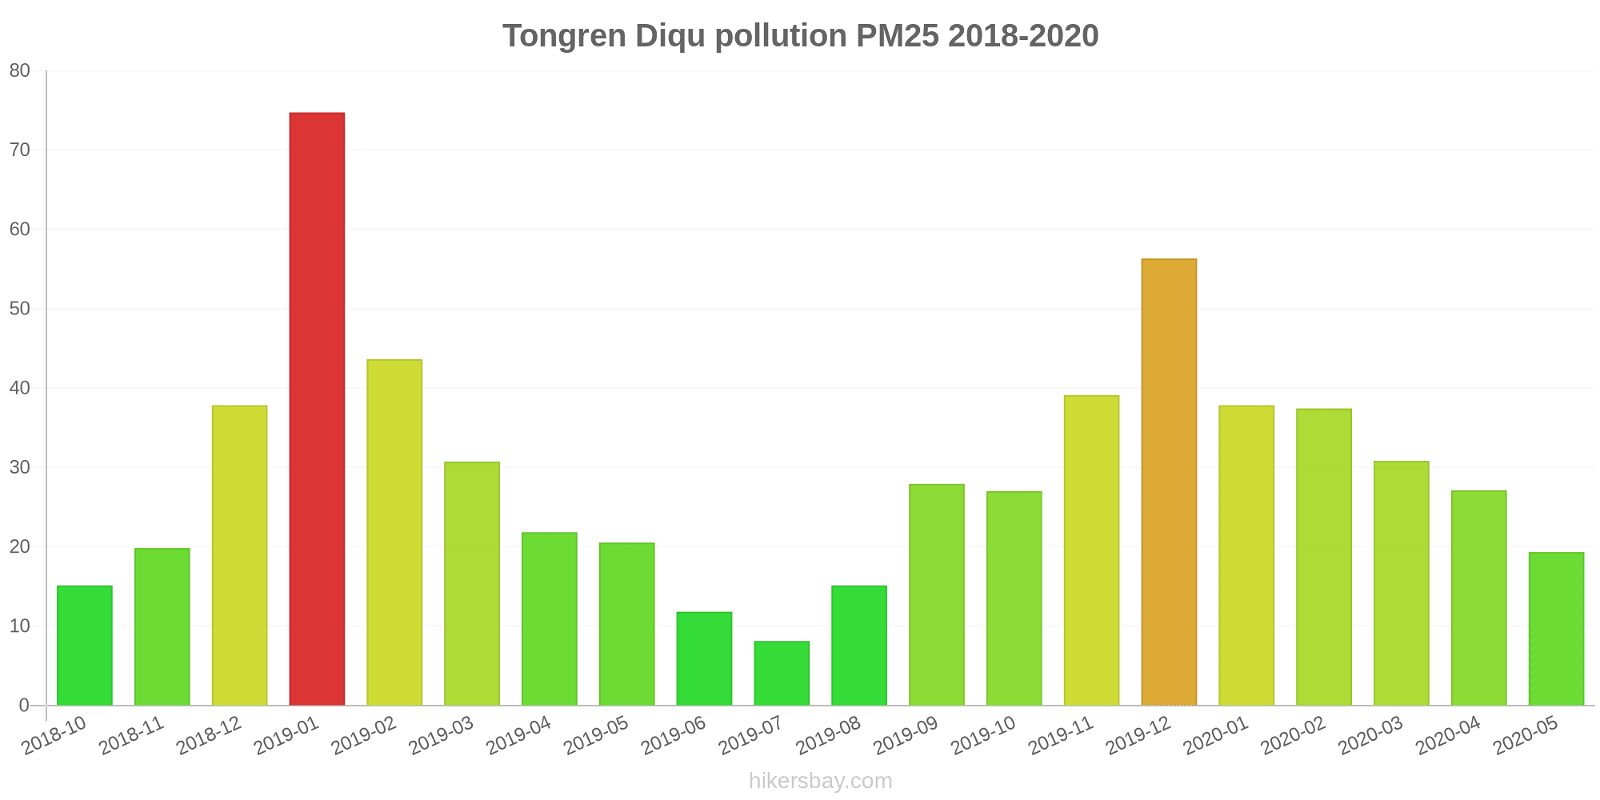
index
2020-05
2020-04
2020-03
2020-02
2020-01
2019-12
2019-11
2019-10
2019-09
2019-08
2019-07
2019-06
2019-05
2019-04
2019-03
2019-02
2019-01
2018-12
2018-11
2018-10
pm25
19 (Moderate)
27 (Moderate)
31 (Moderate)
37 (Unhealthy for Sensitive Groups)
38 (Unhealthy for Sensitive Groups)
56 (Unhealthy)
39 (Unhealthy for Sensitive Groups)
27 (Moderate)
28 (Moderate)
15 (Moderate)
8.1 (Good)
12 (Good)
21 (Moderate)
22 (Moderate)
31 (Moderate)
44 (Unhealthy for Sensitive Groups)
75 (Unhealthy)
38 (Unhealthy for Sensitive Groups)
20 (Moderate)
15 (Moderate)
co
701 (Good)
705 (Good)
634 (Good)
659 (Good)
1 (Good)
939 (Good)
668 (Good)
720 (Good)
584 (Good)
641 (Good)
580 (Good)
598 (Good)
608 (Good)
682 (Good)
691 (Good)
721 (Good)
1 (Good)
1 (Good)
1 (Good)
771 (Good)
no2
9.2 (Good)
16 (Good)
12 (Good)
7.1 (Good)
14 (Good)
29 (Good)
22 (Good)
15 (Good)
16 (Good)
16 (Good)
17 (Good)
17 (Good)
27 (Good)
23 (Good)
32 (Good)
15 (Good)
29 (Good)
26 (Good)
30 (Good)
30 (Good)
o3
91 (Moderate)
107 (Moderate)
81 (Moderate)
64 (Good)
60 (Good)
64 (Good)
78 (Moderate)
92 (Moderate)
135 (Unhealthy for Sensitive Groups)
126 (Unhealthy for Sensitive Groups)
90 (Moderate)
101 (Moderate)
94 (Moderate)
95 (Moderate)
94 (Moderate)
72 (Moderate)
68 (Good)
53 (Good)
76 (Moderate)
90 (Moderate)
pm10
35 (Moderate)
48 (Moderate)
48 (Moderate)
44 (Moderate)
45 (Moderate)
80 (Unhealthy)
63 (Unhealthy for Sensitive Groups)
46 (Moderate)
52 (Unhealthy for Sensitive Groups)
34 (Moderate)
20 (Good)
26 (Moderate)
52 (Unhealthy for Sensitive Groups)
46 (Moderate)
58 (Unhealthy for Sensitive Groups)
58 (Unhealthy for Sensitive Groups)
92 (Unhealthy)
70 (Unhealthy for Sensitive Groups)
52 (Unhealthy for Sensitive Groups)
51 (Unhealthy for Sensitive Groups)
so2
10 (Good)
7.9 (Good)
3.6 (Good)
3.3 (Good)
2.9 (Good)
3.9 (Good)
2.2 (Good)
2.7 (Good)
3.3 (Good)
3.1 (Good)
3.9 (Good)
7.8 (Good)
6.3 (Good)
6.5 (Good)
6 (Good)
4.7 (Good)
6 (Good)
6.1 (Good)
3.9 (Good)
5.1 (Good)
data source »
铜仁七中
Friday, May 27, 2022, 3:00 PM
PM2,5 61 (Unhealthy)
particulate matter (PM2.5) dust
NO2 22 (Good)
nitrogen dioxide (NO2)
PM10 69 (Unhealthy for Sensitive Groups)
particulate matter (PM10) suspended dust
CO 219 (Good)
carbon monoxide (CO)
O3 0.05 (Good)
ozone (O3)
SO2 7.7 (Good)
sulfur dioxide (SO2)
铜仁七中
index
2022-05-27
pm25
28
no2
22
pm10
35
co
579
o3
22
so2
4.6
铜仁七中
2018-10 2020-05

index
2020-05
2020-04
2020-03
2020-02
2020-01
2019-12
2019-11
2019-10
2019-09
2019-08
2019-07
2019-06
2019-05
2019-04
2019-03
2019-02
2019-01
2018-12
2018-11
2018-10
pm25
19
27
31
37
38
56
39
27
28
15
8.1
12
21
22
31
44
75
38
20
15
co
701
705
634
659
1
939
668
720
584
641
580
598
608
682
691
721
1
1
1
771
no2
9.2
16
12
7.1
14
29
22
15
16
16
17
17
27
23
32
15
29
26
30
30
o3
91
107
81
64
60
64
78
92
135
126
90
101
94
95
94
72
68
53
76
90
pm10
35
48
48
44
45
80
63
46
52
34
20
26
52
46
58
58
92
70
52
51
so2
10
7.9
3.6
3.3
2.9
3.9
2.2
2.7
3.3
3.1
3.9
7.8
6.3
6.5
6
4.7
6
6.1
3.9
5.1
* Pollution data source:
https://openaq.org
(ChinaAQIData)
The data is licensed under CC-By 4.0
PM2,5 61 (Unhealthy)
NO2 22 (Good)
PM10 69 (Unhealthy for Sensitive Groups)
CO 219 (Good)
O3 0 (Good)
SO2 8 (Good)
Data on air pollution from recent days in Tongren Diqu
| index | 2022-05-27 |
|---|---|
| pm25 | 28 Moderate |
| no2 | 22 Good |
| pm10 | 35 Moderate |
| co | 579 Good |
| o3 | 22 Good |
| so2 | 5 Good |

| index | 2020-05 | 2020-04 | 2020-03 | 2020-02 | 2020-01 | 2019-12 | 2019-11 | 2019-10 | 2019-09 | 2019-08 | 2019-07 | 2019-06 | 2019-05 | 2019-04 | 2019-03 | 2019-02 | 2019-01 | 2018-12 | 2018-11 | 2018-10 |
|---|---|---|---|---|---|---|---|---|---|---|---|---|---|---|---|---|---|---|---|---|
| pm25 | 19 (Moderate) | 27 (Moderate) | 31 (Moderate) | 37 (Unhealthy for Sensitive Groups) | 38 (Unhealthy for Sensitive Groups) | 56 (Unhealthy) | 39 (Unhealthy for Sensitive Groups) | 27 (Moderate) | 28 (Moderate) | 15 (Moderate) | 8.1 (Good) | 12 (Good) | 21 (Moderate) | 22 (Moderate) | 31 (Moderate) | 44 (Unhealthy for Sensitive Groups) | 75 (Unhealthy) | 38 (Unhealthy for Sensitive Groups) | 20 (Moderate) | 15 (Moderate) |
| co | 701 (Good) | 705 (Good) | 634 (Good) | 659 (Good) | 1 (Good) | 939 (Good) | 668 (Good) | 720 (Good) | 584 (Good) | 641 (Good) | 580 (Good) | 598 (Good) | 608 (Good) | 682 (Good) | 691 (Good) | 721 (Good) | 1 (Good) | 1 (Good) | 1 (Good) | 771 (Good) |
| no2 | 9.2 (Good) | 16 (Good) | 12 (Good) | 7.1 (Good) | 14 (Good) | 29 (Good) | 22 (Good) | 15 (Good) | 16 (Good) | 16 (Good) | 17 (Good) | 17 (Good) | 27 (Good) | 23 (Good) | 32 (Good) | 15 (Good) | 29 (Good) | 26 (Good) | 30 (Good) | 30 (Good) |
| o3 | 91 (Moderate) | 107 (Moderate) | 81 (Moderate) | 64 (Good) | 60 (Good) | 64 (Good) | 78 (Moderate) | 92 (Moderate) | 135 (Unhealthy for Sensitive Groups) | 126 (Unhealthy for Sensitive Groups) | 90 (Moderate) | 101 (Moderate) | 94 (Moderate) | 95 (Moderate) | 94 (Moderate) | 72 (Moderate) | 68 (Good) | 53 (Good) | 76 (Moderate) | 90 (Moderate) |
| pm10 | 35 (Moderate) | 48 (Moderate) | 48 (Moderate) | 44 (Moderate) | 45 (Moderate) | 80 (Unhealthy) | 63 (Unhealthy for Sensitive Groups) | 46 (Moderate) | 52 (Unhealthy for Sensitive Groups) | 34 (Moderate) | 20 (Good) | 26 (Moderate) | 52 (Unhealthy for Sensitive Groups) | 46 (Moderate) | 58 (Unhealthy for Sensitive Groups) | 58 (Unhealthy for Sensitive Groups) | 92 (Unhealthy) | 70 (Unhealthy for Sensitive Groups) | 52 (Unhealthy for Sensitive Groups) | 51 (Unhealthy for Sensitive Groups) |
| so2 | 10 (Good) | 7.9 (Good) | 3.6 (Good) | 3.3 (Good) | 2.9 (Good) | 3.9 (Good) | 2.2 (Good) | 2.7 (Good) | 3.3 (Good) | 3.1 (Good) | 3.9 (Good) | 7.8 (Good) | 6.3 (Good) | 6.5 (Good) | 6 (Good) | 4.7 (Good) | 6 (Good) | 6.1 (Good) | 3.9 (Good) | 5.1 (Good) |
PM2,5 61 (Unhealthy)
particulate matter (PM2.5) dustNO2 22 (Good)
nitrogen dioxide (NO2)PM10 69 (Unhealthy for Sensitive Groups)
particulate matter (PM10) suspended dustCO 219 (Good)
carbon monoxide (CO)O3 0.05 (Good)
ozone (O3)SO2 7.7 (Good)
sulfur dioxide (SO2)铜仁七中
| index | 2022-05-27 |
|---|---|
| pm25 | 28 |
| no2 | 22 |
| pm10 | 35 |
| co | 579 |
| o3 | 22 |
| so2 | 4.6 |
铜仁七中

| index | 2020-05 | 2020-04 | 2020-03 | 2020-02 | 2020-01 | 2019-12 | 2019-11 | 2019-10 | 2019-09 | 2019-08 | 2019-07 | 2019-06 | 2019-05 | 2019-04 | 2019-03 | 2019-02 | 2019-01 | 2018-12 | 2018-11 | 2018-10 |
|---|---|---|---|---|---|---|---|---|---|---|---|---|---|---|---|---|---|---|---|---|
| pm25 | 19 | 27 | 31 | 37 | 38 | 56 | 39 | 27 | 28 | 15 | 8.1 | 12 | 21 | 22 | 31 | 44 | 75 | 38 | 20 | 15 |
| co | 701 | 705 | 634 | 659 | 1 | 939 | 668 | 720 | 584 | 641 | 580 | 598 | 608 | 682 | 691 | 721 | 1 | 1 | 1 | 771 |
| no2 | 9.2 | 16 | 12 | 7.1 | 14 | 29 | 22 | 15 | 16 | 16 | 17 | 17 | 27 | 23 | 32 | 15 | 29 | 26 | 30 | 30 |
| o3 | 91 | 107 | 81 | 64 | 60 | 64 | 78 | 92 | 135 | 126 | 90 | 101 | 94 | 95 | 94 | 72 | 68 | 53 | 76 | 90 |
| pm10 | 35 | 48 | 48 | 44 | 45 | 80 | 63 | 46 | 52 | 34 | 20 | 26 | 52 | 46 | 58 | 58 | 92 | 70 | 52 | 51 |
| so2 | 10 | 7.9 | 3.6 | 3.3 | 2.9 | 3.9 | 2.2 | 2.7 | 3.3 | 3.1 | 3.9 | 7.8 | 6.3 | 6.5 | 6 | 4.7 | 6 | 6.1 | 3.9 | 5.1 |