Air Pollution in Tongyuan: Real-time Air Quality Index and smog alert.
Pollution and air quality forecast for Tongyuan. Today is Wednesday, June 3, 2026. The following air pollution values have been recorded for Tongyuan:- particulate matter (PM2.5) dust - 61 (Unhealthy)
- nitrogen dioxide (NO2) - 22 (Good)
- particulate matter (PM10) suspended dust - 69 (Unhealthy for Sensitive Groups)
- carbon monoxide (CO) - 219 (Good)
- ozone (O3) - 0 (Good)
- sulfur dioxide (SO2) - 8 (Good)

What is the air quality in Tongyuan today? Is the air polluted in Tongyuan?. Is there smog?
What is the current level of PM2.5 in Tongyuan? (particulate matter (PM2.5) dust)
Today's PM2.5 level is:
61 (Unhealthy)
For comparison, the highest level of PM2.5 in Tongyuan in the last 7 days was: 28 (Friday, May 27, 2022) and the lowest: 28 (Friday, May 27, 2022).
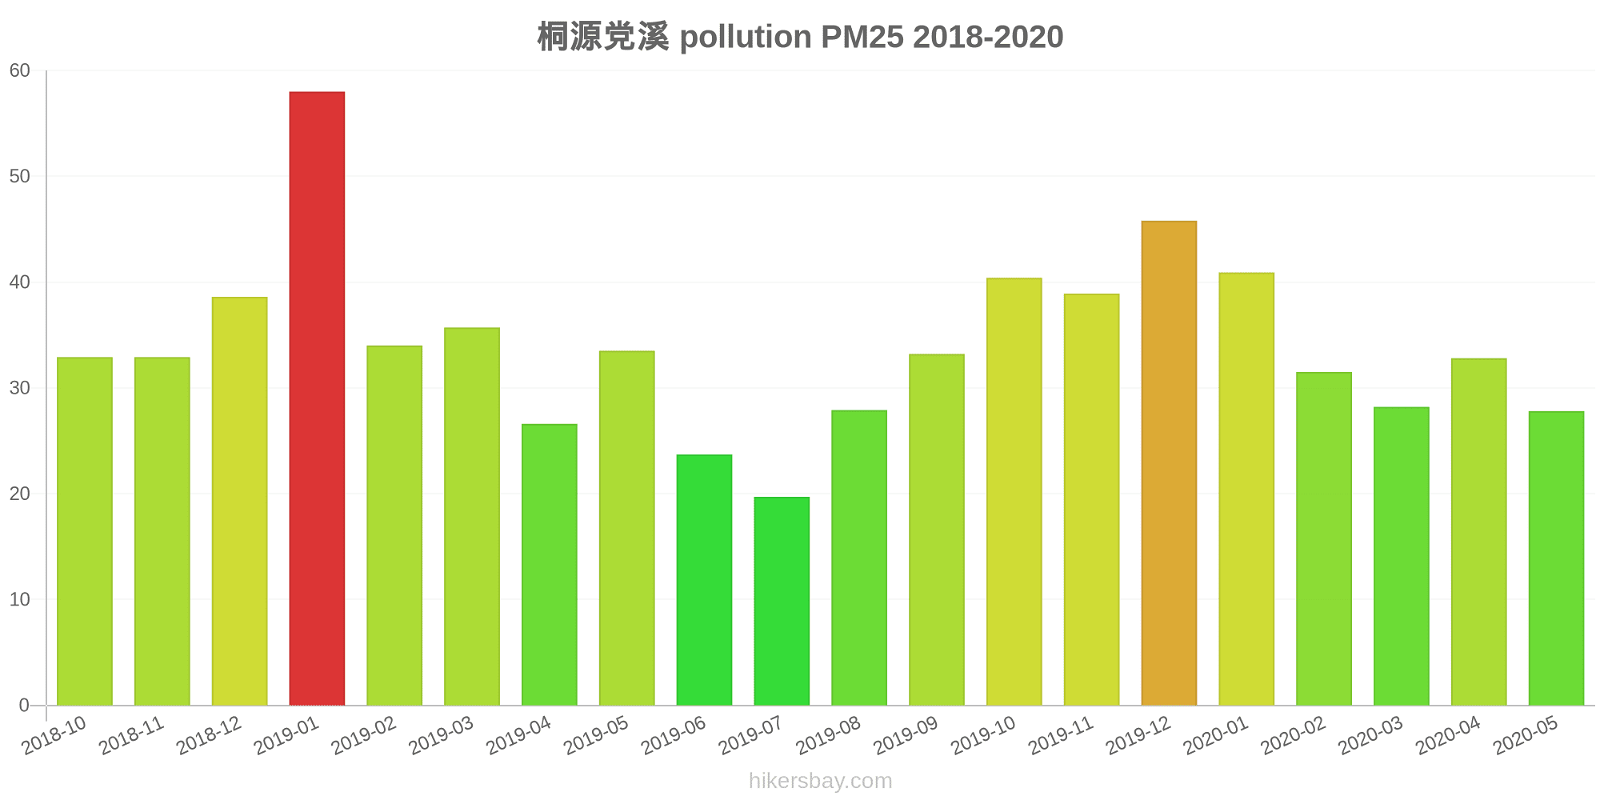
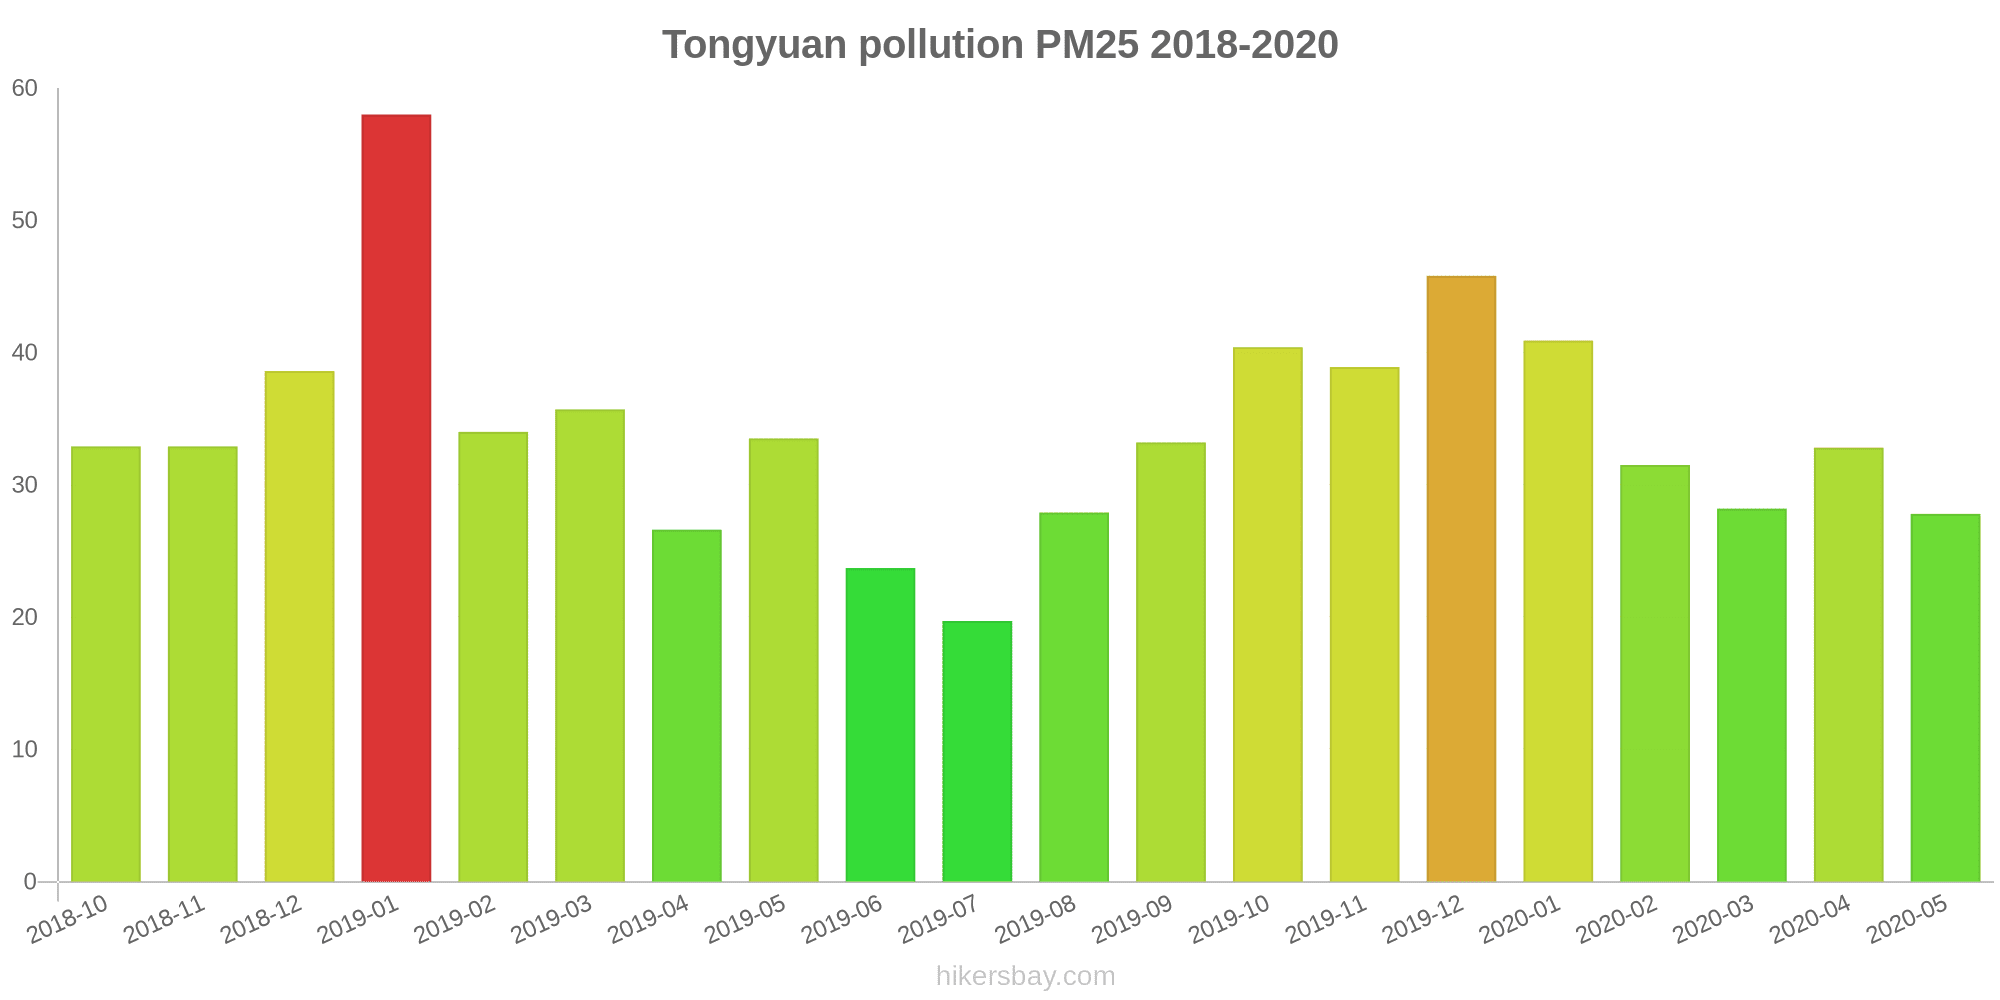
The highest PM2.5 values were recorded: 58 (January 2019).
The lowest level of particulate matter PM2.5 pollution occurs in month: July (20).
How high is the level of NO2? (nitrogen dioxide (NO2))
22 (Good)
What is the level of PM10 today in Tongyuan? (particulate matter (PM10) suspended dust)
The current level of particulate matter PM10 in Tongyuan is:
69 (Unhealthy for Sensitive Groups)
The highest PM10 values usually occur in month: 76 (January 2019).
The lowest value of particulate matter PM10 pollution in Tongyuan is usually recorded in: July (31).
How high is the CO level? (carbon monoxide (CO))
219 (Good)
How is the O3 level today in Tongyuan? (ozone (O3))
0 (Good)
What is the level of SO2 pollution? (sulfur dioxide (SO2))
8 (Good)
Current data Friday, May 27, 2022, 3:00 PM
PM2,5 61 (Unhealthy)
NO2 22 (Good)
PM10 69 (Unhealthy for Sensitive Groups)
CO 219 (Good)
O3 0 (Good)
SO2 8 (Good)
Data on air pollution from recent days in Tongyuan
index
2022-05-27
pm25
28
Moderate
no2
22
Good
pm10
35
Moderate
co
579
Good
o3
22
Good
so2
5
Good
data source »
Air pollution in Tongyuan from October 2018 to May 2020

index
2020-05
2020-04
2020-03
2020-02
2020-01
2019-12
2019-11
2019-10
2019-09
2019-08
2019-07
2019-06
2019-05
2019-04
2019-03
2019-02
2019-01
2018-12
2018-11
2018-10
pm25
28 (Moderate)
33 (Moderate)
28 (Moderate)
32 (Moderate)
41 (Unhealthy for Sensitive Groups)
46 (Unhealthy for Sensitive Groups)
39 (Unhealthy for Sensitive Groups)
40 (Unhealthy for Sensitive Groups)
33 (Moderate)
28 (Moderate)
20 (Moderate)
24 (Moderate)
34 (Moderate)
27 (Moderate)
36 (Unhealthy for Sensitive Groups)
34 (Moderate)
58 (Unhealthy)
39 (Unhealthy for Sensitive Groups)
33 (Moderate)
33 (Moderate)
co
598 (Good)
453 (Good)
584 (Good)
606 (Good)
805 (Good)
810 (Good)
546 (Good)
772 (Good)
710 (Good)
678 (Good)
660 (Good)
752 (Good)
1 (Good)
844 (Good)
1 (Good)
892 (Good)
1 (Good)
1 (Good)
707 (Good)
528 (Good)
no2
9.1 (Good)
16 (Good)
14 (Good)
9.5 (Good)
19 (Good)
26 (Good)
20 (Good)
14 (Good)
7.2 (Good)
8.9 (Good)
7 (Good)
8.6 (Good)
11 (Good)
13 (Good)
17 (Good)
12 (Good)
26 (Good)
16 (Good)
13 (Good)
16 (Good)
o3
129 (Unhealthy for Sensitive Groups)
144 (Unhealthy for Sensitive Groups)
93 (Moderate)
86 (Moderate)
64 (Good)
89 (Moderate)
124 (Unhealthy for Sensitive Groups)
130 (Unhealthy for Sensitive Groups)
146 (Unhealthy for Sensitive Groups)
135 (Unhealthy for Sensitive Groups)
91 (Moderate)
102 (Moderate)
122 (Unhealthy for Sensitive Groups)
84 (Moderate)
81 (Moderate)
52 (Good)
66 (Good)
53 (Good)
74 (Moderate)
107 (Moderate)
pm10
44 (Moderate)
50 (Unhealthy for Sensitive Groups)
43 (Moderate)
43 (Moderate)
52 (Unhealthy for Sensitive Groups)
65 (Unhealthy for Sensitive Groups)
71 (Unhealthy for Sensitive Groups)
66 (Unhealthy for Sensitive Groups)
54 (Unhealthy for Sensitive Groups)
44 (Moderate)
31 (Moderate)
37 (Moderate)
54 (Unhealthy for Sensitive Groups)
40 (Moderate)
51 (Unhealthy for Sensitive Groups)
44 (Moderate)
76 (Unhealthy for Sensitive Groups)
53 (Unhealthy for Sensitive Groups)
51 (Unhealthy for Sensitive Groups)
53 (Unhealthy for Sensitive Groups)
so2
7.2 (Good)
12 (Good)
7.5 (Good)
7.1 (Good)
6.9 (Good)
11 (Good)
9.6 (Good)
11 (Good)
9.5 (Good)
14 (Good)
8.5 (Good)
12 (Good)
13 (Good)
8.7 (Good)
13 (Good)
4.5 (Good)
7.6 (Good)
6.1 (Good)
9 (Good)
9.2 (Good)
data source »
桐源党溪
Friday, May 27, 2022, 3:00 PM
PM2,5 61 (Unhealthy)
particulate matter (PM2.5) dust
NO2 22 (Good)
nitrogen dioxide (NO2)
PM10 69 (Unhealthy for Sensitive Groups)
particulate matter (PM10) suspended dust
CO 219 (Good)
carbon monoxide (CO)
O3 0.05 (Good)
ozone (O3)
SO2 7.7 (Good)
sulfur dioxide (SO2)
桐源党溪
index
2022-05-27
pm25
28
no2
22
pm10
35
co
579
o3
22
so2
4.6
桐源党溪
2018-10 2020-05
index
2020-05
2020-04
2020-03
2020-02
2020-01
2019-12
2019-11
2019-10
2019-09
2019-08
2019-07
2019-06
2019-05
2019-04
2019-03
2019-02
2019-01
2018-12
2018-11
2018-10
pm25
28
33
28
32
41
46
39
40
33
28
20
24
34
27
36
34
58
39
33
33
co
598
453
584
606
805
810
546
772
710
678
660
752
1
844
1
892
1
1
707
528
no2
9.1
16
14
9.5
19
26
20
14
7.2
8.9
7
8.6
11
13
17
12
26
16
13
16
o3
129
144
93
86
64
89
124
130
146
135
91
102
122
84
81
52
66
53
74
107
pm10
44
50
43
43
52
65
71
66
54
44
31
37
54
40
51
44
76
53
51
53
so2
7.2
12
7.5
7.1
6.9
11
9.6
11
9.5
14
8.5
12
13
8.7
13
4.5
7.6
6.1
9
9.2
* Pollution data source:
https://openaq.org
(ChinaAQIData)
The data is licensed under CC-By 4.0
PM2,5 61 (Unhealthy)
NO2 22 (Good)
PM10 69 (Unhealthy for Sensitive Groups)
CO 219 (Good)
O3 0 (Good)
SO2 8 (Good)
Data on air pollution from recent days in Tongyuan
| index | 2022-05-27 |
|---|---|
| pm25 | 28 Moderate |
| no2 | 22 Good |
| pm10 | 35 Moderate |
| co | 579 Good |
| o3 | 22 Good |
| so2 | 5 Good |
| index | 2020-05 | 2020-04 | 2020-03 | 2020-02 | 2020-01 | 2019-12 | 2019-11 | 2019-10 | 2019-09 | 2019-08 | 2019-07 | 2019-06 | 2019-05 | 2019-04 | 2019-03 | 2019-02 | 2019-01 | 2018-12 | 2018-11 | 2018-10 |
|---|---|---|---|---|---|---|---|---|---|---|---|---|---|---|---|---|---|---|---|---|
| pm25 | 28 (Moderate) | 33 (Moderate) | 28 (Moderate) | 32 (Moderate) | 41 (Unhealthy for Sensitive Groups) | 46 (Unhealthy for Sensitive Groups) | 39 (Unhealthy for Sensitive Groups) | 40 (Unhealthy for Sensitive Groups) | 33 (Moderate) | 28 (Moderate) | 20 (Moderate) | 24 (Moderate) | 34 (Moderate) | 27 (Moderate) | 36 (Unhealthy for Sensitive Groups) | 34 (Moderate) | 58 (Unhealthy) | 39 (Unhealthy for Sensitive Groups) | 33 (Moderate) | 33 (Moderate) |
| co | 598 (Good) | 453 (Good) | 584 (Good) | 606 (Good) | 805 (Good) | 810 (Good) | 546 (Good) | 772 (Good) | 710 (Good) | 678 (Good) | 660 (Good) | 752 (Good) | 1 (Good) | 844 (Good) | 1 (Good) | 892 (Good) | 1 (Good) | 1 (Good) | 707 (Good) | 528 (Good) |
| no2 | 9.1 (Good) | 16 (Good) | 14 (Good) | 9.5 (Good) | 19 (Good) | 26 (Good) | 20 (Good) | 14 (Good) | 7.2 (Good) | 8.9 (Good) | 7 (Good) | 8.6 (Good) | 11 (Good) | 13 (Good) | 17 (Good) | 12 (Good) | 26 (Good) | 16 (Good) | 13 (Good) | 16 (Good) |
| o3 | 129 (Unhealthy for Sensitive Groups) | 144 (Unhealthy for Sensitive Groups) | 93 (Moderate) | 86 (Moderate) | 64 (Good) | 89 (Moderate) | 124 (Unhealthy for Sensitive Groups) | 130 (Unhealthy for Sensitive Groups) | 146 (Unhealthy for Sensitive Groups) | 135 (Unhealthy for Sensitive Groups) | 91 (Moderate) | 102 (Moderate) | 122 (Unhealthy for Sensitive Groups) | 84 (Moderate) | 81 (Moderate) | 52 (Good) | 66 (Good) | 53 (Good) | 74 (Moderate) | 107 (Moderate) |
| pm10 | 44 (Moderate) | 50 (Unhealthy for Sensitive Groups) | 43 (Moderate) | 43 (Moderate) | 52 (Unhealthy for Sensitive Groups) | 65 (Unhealthy for Sensitive Groups) | 71 (Unhealthy for Sensitive Groups) | 66 (Unhealthy for Sensitive Groups) | 54 (Unhealthy for Sensitive Groups) | 44 (Moderate) | 31 (Moderate) | 37 (Moderate) | 54 (Unhealthy for Sensitive Groups) | 40 (Moderate) | 51 (Unhealthy for Sensitive Groups) | 44 (Moderate) | 76 (Unhealthy for Sensitive Groups) | 53 (Unhealthy for Sensitive Groups) | 51 (Unhealthy for Sensitive Groups) | 53 (Unhealthy for Sensitive Groups) |
| so2 | 7.2 (Good) | 12 (Good) | 7.5 (Good) | 7.1 (Good) | 6.9 (Good) | 11 (Good) | 9.6 (Good) | 11 (Good) | 9.5 (Good) | 14 (Good) | 8.5 (Good) | 12 (Good) | 13 (Good) | 8.7 (Good) | 13 (Good) | 4.5 (Good) | 7.6 (Good) | 6.1 (Good) | 9 (Good) | 9.2 (Good) |
PM2,5 61 (Unhealthy)
particulate matter (PM2.5) dustNO2 22 (Good)
nitrogen dioxide (NO2)PM10 69 (Unhealthy for Sensitive Groups)
particulate matter (PM10) suspended dustCO 219 (Good)
carbon monoxide (CO)O3 0.05 (Good)
ozone (O3)SO2 7.7 (Good)
sulfur dioxide (SO2)桐源党溪
| index | 2022-05-27 |
|---|---|
| pm25 | 28 |
| no2 | 22 |
| pm10 | 35 |
| co | 579 |
| o3 | 22 |
| so2 | 4.6 |
桐源党溪

| index | 2020-05 | 2020-04 | 2020-03 | 2020-02 | 2020-01 | 2019-12 | 2019-11 | 2019-10 | 2019-09 | 2019-08 | 2019-07 | 2019-06 | 2019-05 | 2019-04 | 2019-03 | 2019-02 | 2019-01 | 2018-12 | 2018-11 | 2018-10 |
|---|---|---|---|---|---|---|---|---|---|---|---|---|---|---|---|---|---|---|---|---|
| pm25 | 28 | 33 | 28 | 32 | 41 | 46 | 39 | 40 | 33 | 28 | 20 | 24 | 34 | 27 | 36 | 34 | 58 | 39 | 33 | 33 |
| co | 598 | 453 | 584 | 606 | 805 | 810 | 546 | 772 | 710 | 678 | 660 | 752 | 1 | 844 | 1 | 892 | 1 | 1 | 707 | 528 |
| no2 | 9.1 | 16 | 14 | 9.5 | 19 | 26 | 20 | 14 | 7.2 | 8.9 | 7 | 8.6 | 11 | 13 | 17 | 12 | 26 | 16 | 13 | 16 |
| o3 | 129 | 144 | 93 | 86 | 64 | 89 | 124 | 130 | 146 | 135 | 91 | 102 | 122 | 84 | 81 | 52 | 66 | 53 | 74 | 107 |
| pm10 | 44 | 50 | 43 | 43 | 52 | 65 | 71 | 66 | 54 | 44 | 31 | 37 | 54 | 40 | 51 | 44 | 76 | 53 | 51 | 53 |
| so2 | 7.2 | 12 | 7.5 | 7.1 | 6.9 | 11 | 9.6 | 11 | 9.5 | 14 | 8.5 | 12 | 13 | 8.7 | 13 | 4.5 | 7.6 | 6.1 | 9 | 9.2 |