Air Pollution in Wangying: Real-time Air Quality Index and smog alert.
Pollution and air quality forecast for Wangying. Today is Tuesday, June 2, 2026. The following air pollution values have been recorded for Wangying:- particulate matter (PM2.5) dust - 61 (Unhealthy)
- nitrogen dioxide (NO2) - 22 (Good)
- particulate matter (PM10) suspended dust - 69 (Unhealthy for Sensitive Groups)
- carbon monoxide (CO) - 219 (Good)
- ozone (O3) - 0 (Good)
- sulfur dioxide (SO2) - 8 (Good)

What is the air quality in Wangying today? Is the air polluted in Wangying?. Is there smog?
What is the current level of PM2.5 in Wangying? (particulate matter (PM2.5) dust)
Today's PM2.5 level is:
61 (Unhealthy)
For comparison, the highest level of PM2.5 in Wangying in the last 7 days was: 28 (Friday, May 27, 2022) and the lowest: 28 (Friday, May 27, 2022).
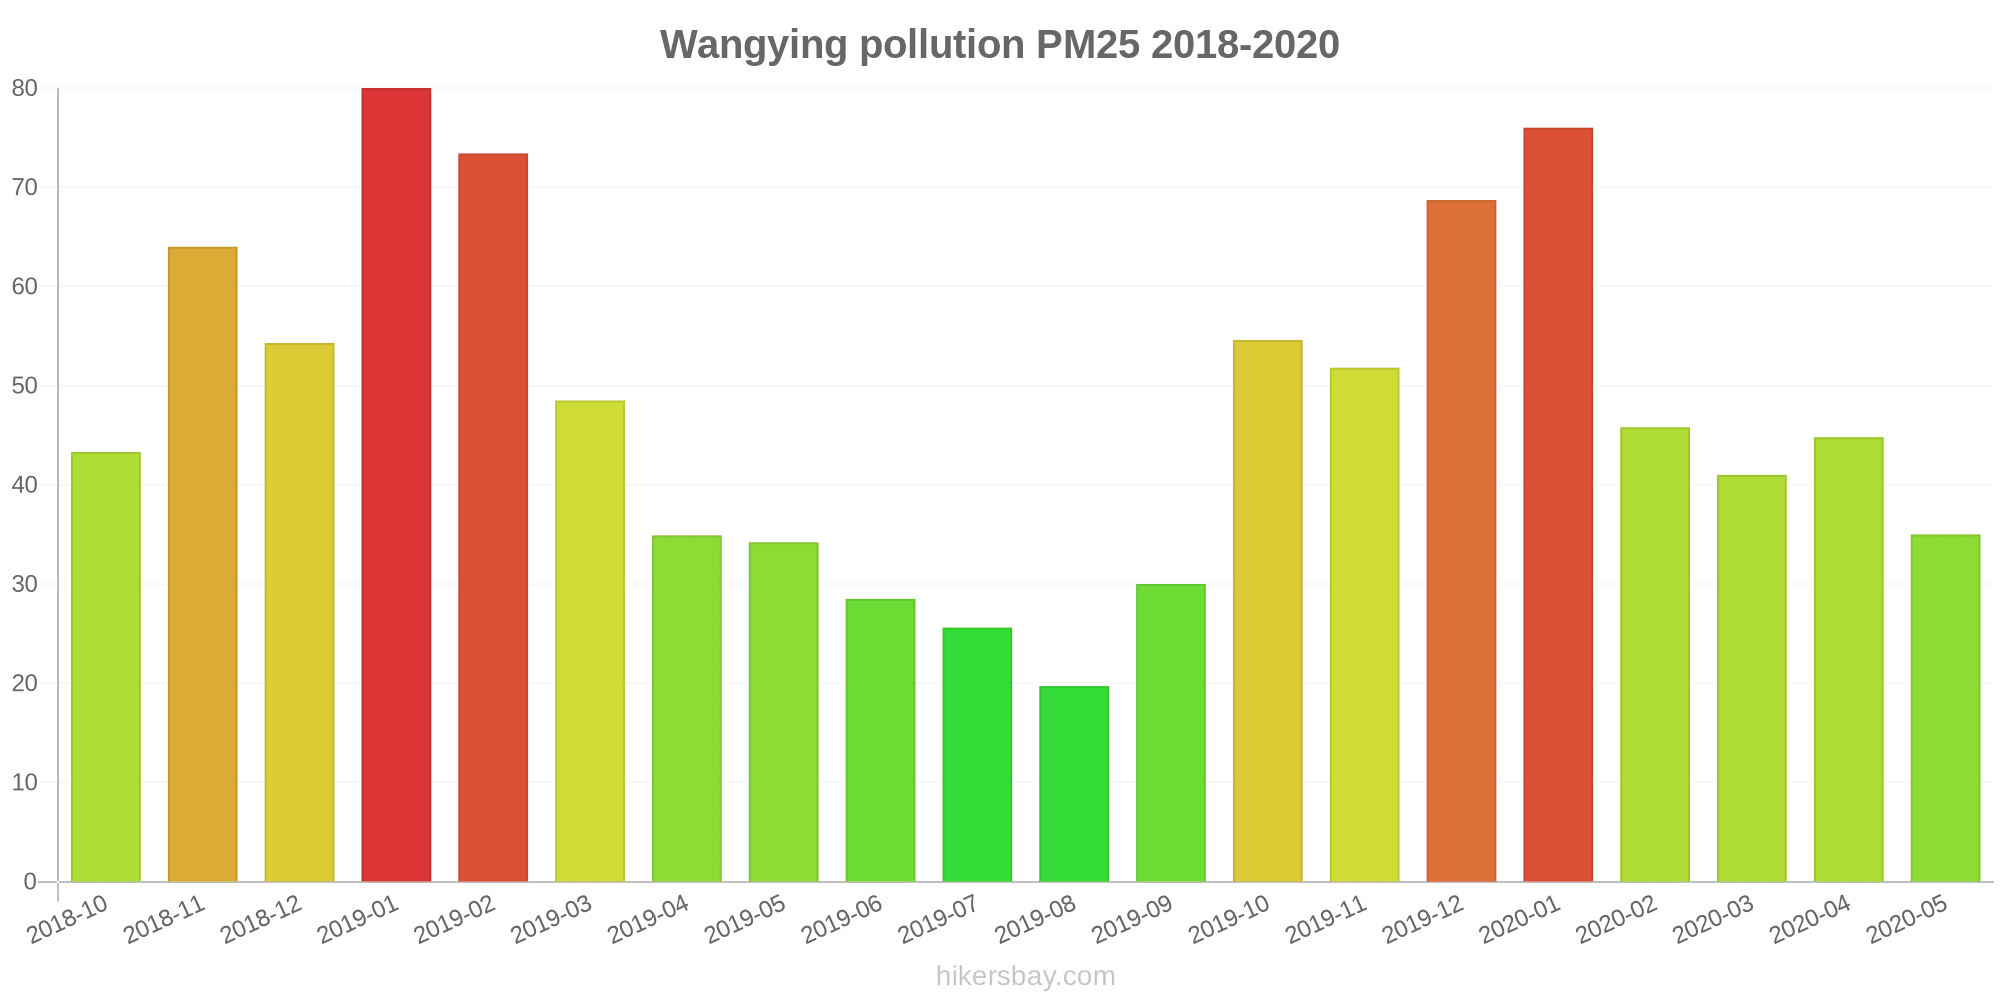
The highest PM2.5 values were recorded: 80 (January 2019).
The lowest level of particulate matter PM2.5 pollution occurs in month: August (20).
How high is the level of NO2? (nitrogen dioxide (NO2))
22 (Good)
What is the level of PM10 today in Wangying? (particulate matter (PM10) suspended dust)
The current level of particulate matter PM10 in Wangying is:
69 (Unhealthy for Sensitive Groups)
The highest PM10 values usually occur in month: 100 (January 2019).
The lowest value of particulate matter PM10 pollution in Wangying is usually recorded in: August (37).
How high is the CO level? (carbon monoxide (CO))
219 (Good)
How is the O3 level today in Wangying? (ozone (O3))
0 (Good)
What is the level of SO2 pollution? (sulfur dioxide (SO2))
8 (Good)
Current data Friday, May 27, 2022, 3:00 PM
PM2,5 61 (Unhealthy)
NO2 22 (Good)
PM10 69 (Unhealthy for Sensitive Groups)
CO 219 (Good)
O3 0 (Good)
SO2 8 (Good)
Data on air pollution from recent days in Wangying
index
2022-05-27
pm25
28
Moderate
no2
22
Good
pm10
35
Moderate
co
579
Good
o3
22
Good
so2
5
Good
data source »
Air pollution in Wangying from October 2018 to May 2020

index
2020-05
2020-04
2020-03
2020-02
2020-01
2019-12
2019-11
2019-10
2019-09
2019-08
2019-07
2019-06
2019-05
2019-04
2019-03
2019-02
2019-01
2018-12
2018-11
2018-10
pm25
35 (Unhealthy for Sensitive Groups)
45 (Unhealthy for Sensitive Groups)
41 (Unhealthy for Sensitive Groups)
46 (Unhealthy for Sensitive Groups)
76 (Very Unhealthy)
69 (Unhealthy)
52 (Unhealthy for Sensitive Groups)
55 (Unhealthy for Sensitive Groups)
30 (Moderate)
20 (Moderate)
26 (Moderate)
29 (Moderate)
34 (Moderate)
35 (Moderate)
49 (Unhealthy for Sensitive Groups)
73 (Unhealthy)
80 (Very Unhealthy)
54 (Unhealthy for Sensitive Groups)
64 (Unhealthy)
43 (Unhealthy for Sensitive Groups)
co
470 (Good)
494 (Good)
664 (Good)
640 (Good)
869 (Good)
780 (Good)
480 (Good)
591 (Good)
482 (Good)
449 (Good)
506 (Good)
565 (Good)
559 (Good)
562 (Good)
626 (Good)
980 (Good)
975 (Good)
749 (Good)
929 (Good)
632 (Good)
no2
17 (Good)
26 (Good)
22 (Good)
13 (Good)
27 (Good)
43 (Moderate)
39 (Good)
38 (Good)
29 (Good)
18 (Good)
14 (Good)
15 (Good)
27 (Good)
31 (Good)
35 (Good)
30 (Good)
44 (Moderate)
43 (Moderate)
34 (Good)
40 (Moderate)
o3
127 (Unhealthy for Sensitive Groups)
139 (Unhealthy for Sensitive Groups)
109 (Moderate)
95 (Moderate)
81 (Moderate)
71 (Moderate)
94 (Moderate)
127 (Unhealthy for Sensitive Groups)
149 (Unhealthy for Sensitive Groups)
134 (Unhealthy for Sensitive Groups)
170 (Unhealthy)
204 (Very Unhealthy)
167 (Unhealthy)
138 (Unhealthy for Sensitive Groups)
125 (Unhealthy for Sensitive Groups)
90 (Moderate)
73 (Moderate)
61 (Good)
86 (Moderate)
111 (Moderate)
pm10
49 (Moderate)
71 (Unhealthy for Sensitive Groups)
68 (Unhealthy for Sensitive Groups)
59 (Unhealthy for Sensitive Groups)
98 (Unhealthy)
96 (Unhealthy)
94 (Unhealthy)
90 (Unhealthy)
49 (Moderate)
37 (Moderate)
45 (Moderate)
47 (Moderate)
68 (Unhealthy for Sensitive Groups)
66 (Unhealthy for Sensitive Groups)
81 (Unhealthy)
89 (Unhealthy)
100 (Unhealthy)
84 (Unhealthy)
91 (Unhealthy)
78 (Unhealthy for Sensitive Groups)
so2
4.7 (Good)
7.4 (Good)
5.3 (Good)
3.2 (Good)
4.7 (Good)
8.5 (Good)
5.5 (Good)
9 (Good)
9.9 (Good)
5.6 (Good)
6 (Good)
6.4 (Good)
8.8 (Good)
11 (Good)
12 (Good)
9.4 (Good)
13 (Good)
12 (Good)
8.2 (Good)
11 (Good)
data source »
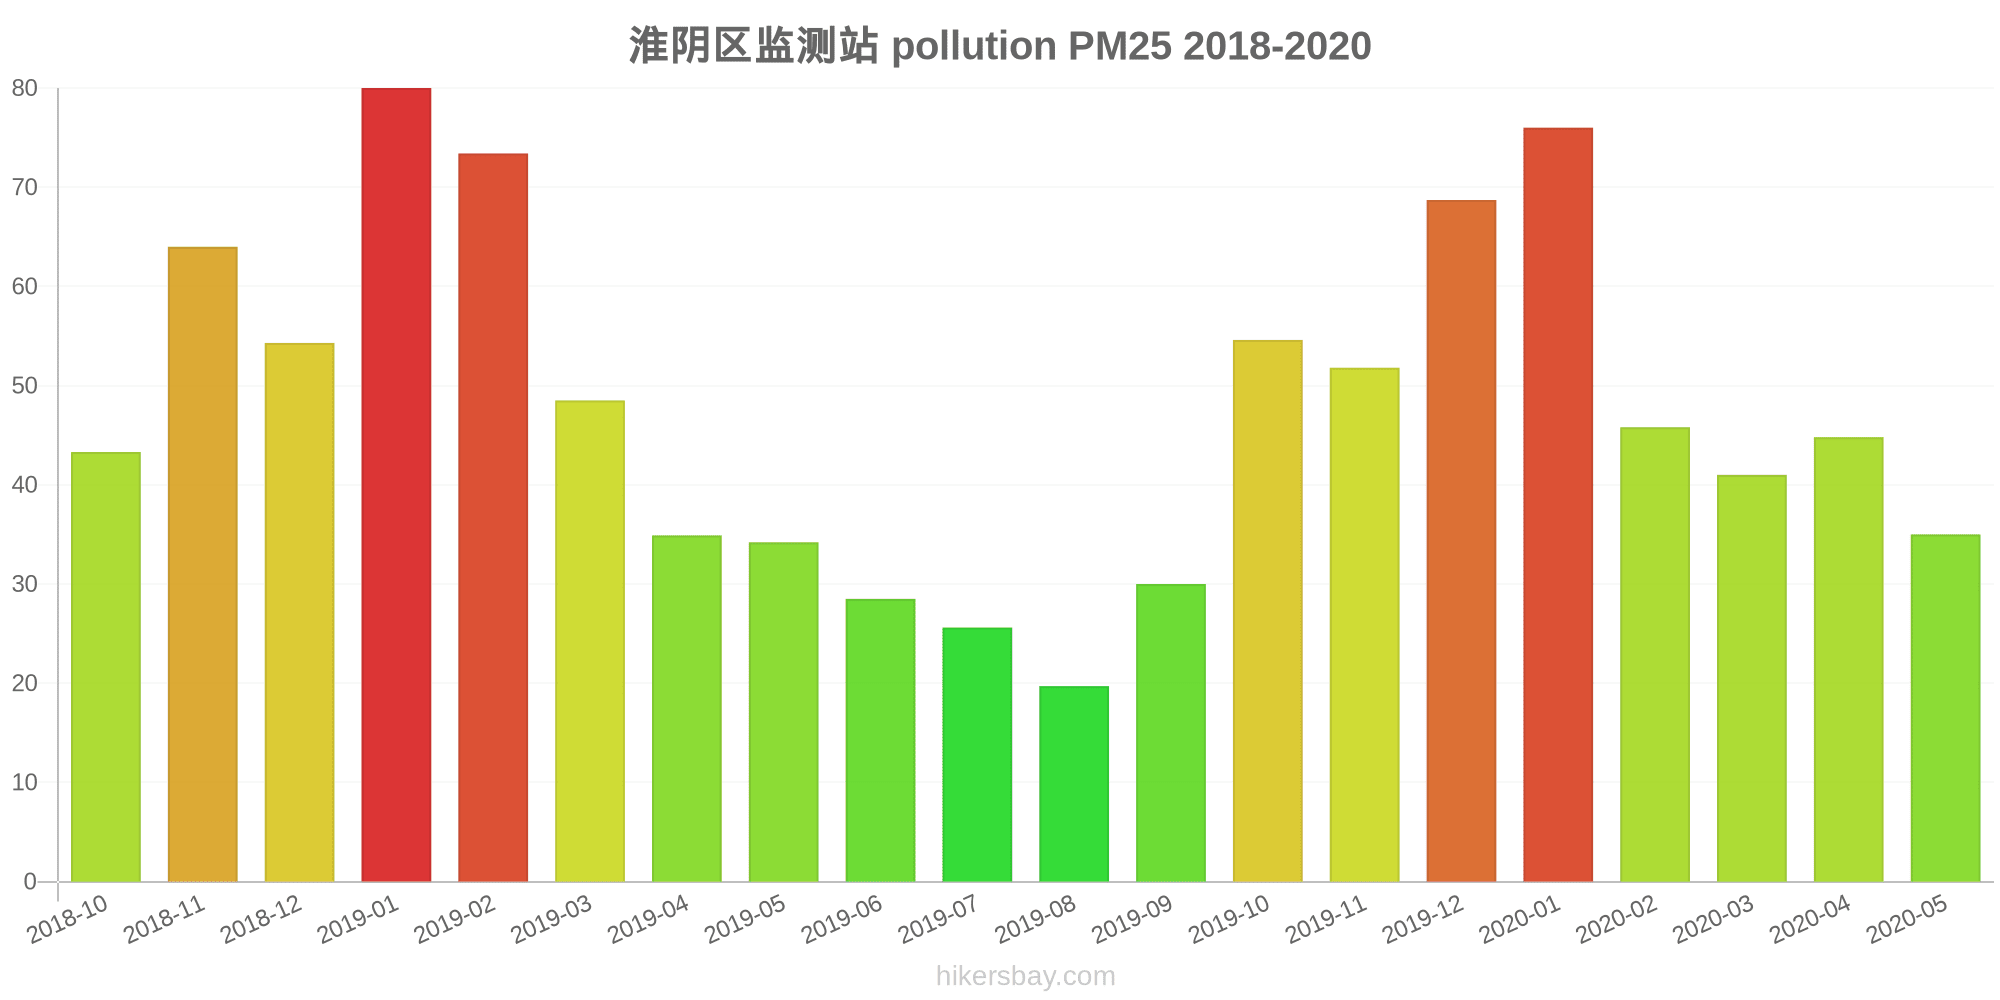
淮阴区监测站
Friday, May 27, 2022, 3:00 PM
PM2,5 61 (Unhealthy)
particulate matter (PM2.5) dust
NO2 22 (Good)
nitrogen dioxide (NO2)
PM10 69 (Unhealthy for Sensitive Groups)
particulate matter (PM10) suspended dust
CO 219 (Good)
carbon monoxide (CO)
O3 0.05 (Good)
ozone (O3)
SO2 7.7 (Good)
sulfur dioxide (SO2)
淮阴区监测站
index
2022-05-27
pm25
28
no2
22
pm10
35
co
579
o3
22
so2
4.6
淮阴区监测站
2018-10 2020-05

index
2020-05
2020-04
2020-03
2020-02
2020-01
2019-12
2019-11
2019-10
2019-09
2019-08
2019-07
2019-06
2019-05
2019-04
2019-03
2019-02
2019-01
2018-12
2018-11
2018-10
pm25
35
45
41
46
76
69
52
55
30
20
26
29
34
35
49
73
80
54
64
43
co
470
494
664
640
869
780
480
591
482
449
506
565
559
562
626
980
975
749
929
632
no2
17
26
22
13
27
43
39
38
29
18
14
15
27
31
35
30
44
43
34
40
o3
127
139
109
95
81
71
94
127
149
134
170
204
167
138
125
90
73
61
86
111
pm10
49
71
68
59
98
96
94
90
49
37
45
47
68
66
81
89
100
84
91
78
so2
4.7
7.4
5.3
3.2
4.7
8.5
5.5
9
9.9
5.6
6
6.4
8.8
11
12
9.4
13
12
8.2
11
* Pollution data source:
https://openaq.org
(ChinaAQIData)
The data is licensed under CC-By 4.0
PM2,5 61 (Unhealthy)
NO2 22 (Good)
PM10 69 (Unhealthy for Sensitive Groups)
CO 219 (Good)
O3 0 (Good)
SO2 8 (Good)
Data on air pollution from recent days in Wangying
| index | 2022-05-27 |
|---|---|
| pm25 | 28 Moderate |
| no2 | 22 Good |
| pm10 | 35 Moderate |
| co | 579 Good |
| o3 | 22 Good |
| so2 | 5 Good |
| index | 2020-05 | 2020-04 | 2020-03 | 2020-02 | 2020-01 | 2019-12 | 2019-11 | 2019-10 | 2019-09 | 2019-08 | 2019-07 | 2019-06 | 2019-05 | 2019-04 | 2019-03 | 2019-02 | 2019-01 | 2018-12 | 2018-11 | 2018-10 |
|---|---|---|---|---|---|---|---|---|---|---|---|---|---|---|---|---|---|---|---|---|
| pm25 | 35 (Unhealthy for Sensitive Groups) | 45 (Unhealthy for Sensitive Groups) | 41 (Unhealthy for Sensitive Groups) | 46 (Unhealthy for Sensitive Groups) | 76 (Very Unhealthy) | 69 (Unhealthy) | 52 (Unhealthy for Sensitive Groups) | 55 (Unhealthy for Sensitive Groups) | 30 (Moderate) | 20 (Moderate) | 26 (Moderate) | 29 (Moderate) | 34 (Moderate) | 35 (Moderate) | 49 (Unhealthy for Sensitive Groups) | 73 (Unhealthy) | 80 (Very Unhealthy) | 54 (Unhealthy for Sensitive Groups) | 64 (Unhealthy) | 43 (Unhealthy for Sensitive Groups) |
| co | 470 (Good) | 494 (Good) | 664 (Good) | 640 (Good) | 869 (Good) | 780 (Good) | 480 (Good) | 591 (Good) | 482 (Good) | 449 (Good) | 506 (Good) | 565 (Good) | 559 (Good) | 562 (Good) | 626 (Good) | 980 (Good) | 975 (Good) | 749 (Good) | 929 (Good) | 632 (Good) |
| no2 | 17 (Good) | 26 (Good) | 22 (Good) | 13 (Good) | 27 (Good) | 43 (Moderate) | 39 (Good) | 38 (Good) | 29 (Good) | 18 (Good) | 14 (Good) | 15 (Good) | 27 (Good) | 31 (Good) | 35 (Good) | 30 (Good) | 44 (Moderate) | 43 (Moderate) | 34 (Good) | 40 (Moderate) |
| o3 | 127 (Unhealthy for Sensitive Groups) | 139 (Unhealthy for Sensitive Groups) | 109 (Moderate) | 95 (Moderate) | 81 (Moderate) | 71 (Moderate) | 94 (Moderate) | 127 (Unhealthy for Sensitive Groups) | 149 (Unhealthy for Sensitive Groups) | 134 (Unhealthy for Sensitive Groups) | 170 (Unhealthy) | 204 (Very Unhealthy) | 167 (Unhealthy) | 138 (Unhealthy for Sensitive Groups) | 125 (Unhealthy for Sensitive Groups) | 90 (Moderate) | 73 (Moderate) | 61 (Good) | 86 (Moderate) | 111 (Moderate) |
| pm10 | 49 (Moderate) | 71 (Unhealthy for Sensitive Groups) | 68 (Unhealthy for Sensitive Groups) | 59 (Unhealthy for Sensitive Groups) | 98 (Unhealthy) | 96 (Unhealthy) | 94 (Unhealthy) | 90 (Unhealthy) | 49 (Moderate) | 37 (Moderate) | 45 (Moderate) | 47 (Moderate) | 68 (Unhealthy for Sensitive Groups) | 66 (Unhealthy for Sensitive Groups) | 81 (Unhealthy) | 89 (Unhealthy) | 100 (Unhealthy) | 84 (Unhealthy) | 91 (Unhealthy) | 78 (Unhealthy for Sensitive Groups) |
| so2 | 4.7 (Good) | 7.4 (Good) | 5.3 (Good) | 3.2 (Good) | 4.7 (Good) | 8.5 (Good) | 5.5 (Good) | 9 (Good) | 9.9 (Good) | 5.6 (Good) | 6 (Good) | 6.4 (Good) | 8.8 (Good) | 11 (Good) | 12 (Good) | 9.4 (Good) | 13 (Good) | 12 (Good) | 8.2 (Good) | 11 (Good) |
PM2,5 61 (Unhealthy)
particulate matter (PM2.5) dustNO2 22 (Good)
nitrogen dioxide (NO2)PM10 69 (Unhealthy for Sensitive Groups)
particulate matter (PM10) suspended dustCO 219 (Good)
carbon monoxide (CO)O3 0.05 (Good)
ozone (O3)SO2 7.7 (Good)
sulfur dioxide (SO2)淮阴区监测站
| index | 2022-05-27 |
|---|---|
| pm25 | 28 |
| no2 | 22 |
| pm10 | 35 |
| co | 579 |
| o3 | 22 |
| so2 | 4.6 |
淮阴区监测站
| index | 2020-05 | 2020-04 | 2020-03 | 2020-02 | 2020-01 | 2019-12 | 2019-11 | 2019-10 | 2019-09 | 2019-08 | 2019-07 | 2019-06 | 2019-05 | 2019-04 | 2019-03 | 2019-02 | 2019-01 | 2018-12 | 2018-11 | 2018-10 |
|---|---|---|---|---|---|---|---|---|---|---|---|---|---|---|---|---|---|---|---|---|
| pm25 | 35 | 45 | 41 | 46 | 76 | 69 | 52 | 55 | 30 | 20 | 26 | 29 | 34 | 35 | 49 | 73 | 80 | 54 | 64 | 43 |
| co | 470 | 494 | 664 | 640 | 869 | 780 | 480 | 591 | 482 | 449 | 506 | 565 | 559 | 562 | 626 | 980 | 975 | 749 | 929 | 632 |
| no2 | 17 | 26 | 22 | 13 | 27 | 43 | 39 | 38 | 29 | 18 | 14 | 15 | 27 | 31 | 35 | 30 | 44 | 43 | 34 | 40 |
| o3 | 127 | 139 | 109 | 95 | 81 | 71 | 94 | 127 | 149 | 134 | 170 | 204 | 167 | 138 | 125 | 90 | 73 | 61 | 86 | 111 |
| pm10 | 49 | 71 | 68 | 59 | 98 | 96 | 94 | 90 | 49 | 37 | 45 | 47 | 68 | 66 | 81 | 89 | 100 | 84 | 91 | 78 |
| so2 | 4.7 | 7.4 | 5.3 | 3.2 | 4.7 | 8.5 | 5.5 | 9 | 9.9 | 5.6 | 6 | 6.4 | 8.8 | 11 | 12 | 9.4 | 13 | 12 | 8.2 | 11 |