Air Pollution in Weifang: Real-time Air Quality Index and smog alert.
Pollution and air quality forecast for Weifang. Today is Sunday, June 21, 2026. The following air pollution values have been recorded for Weifang:- particulate matter (PM2.5) dust - 61 (Unhealthy)
- nitrogen dioxide (NO2) - 22 (Good)
- particulate matter (PM10) suspended dust - 69 (Unhealthy for Sensitive Groups)
- carbon monoxide (CO) - 219 (Good)
- ozone (O3) - 0 (Good)
- sulfur dioxide (SO2) - 8 (Good)

What is the air quality in Weifang today? Is the air polluted in Weifang?. Is there smog?
What is the current level of PM2.5 in Weifang? (particulate matter (PM2.5) dust)
Today's PM2.5 level is:
61 (Unhealthy)
For comparison, the highest level of PM2.5 in Weifang in the last 7 days was: 28 (Friday, May 27, 2022) and the lowest: 28 (Friday, May 27, 2022).
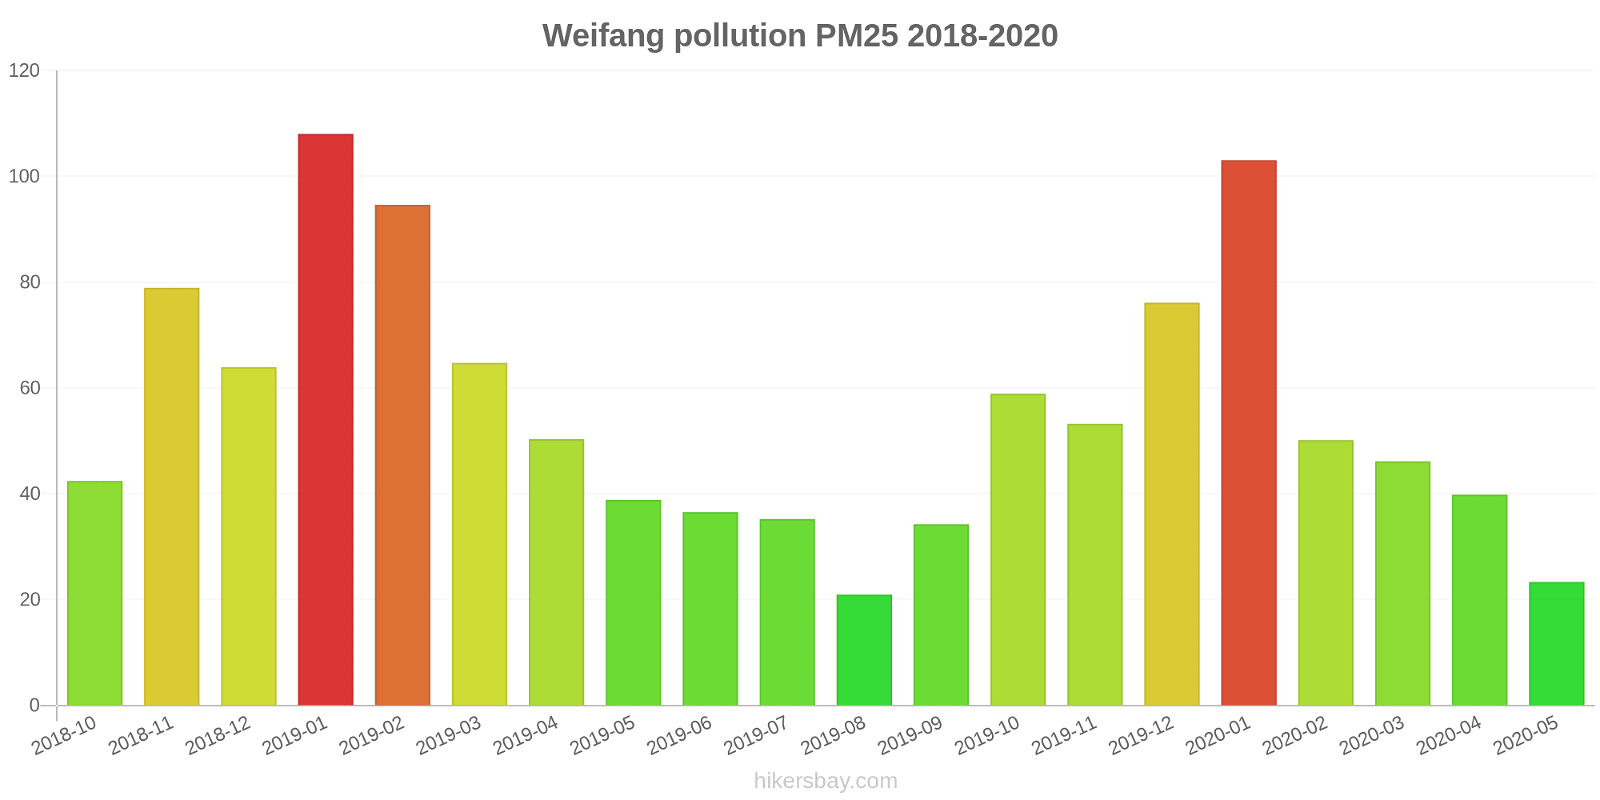
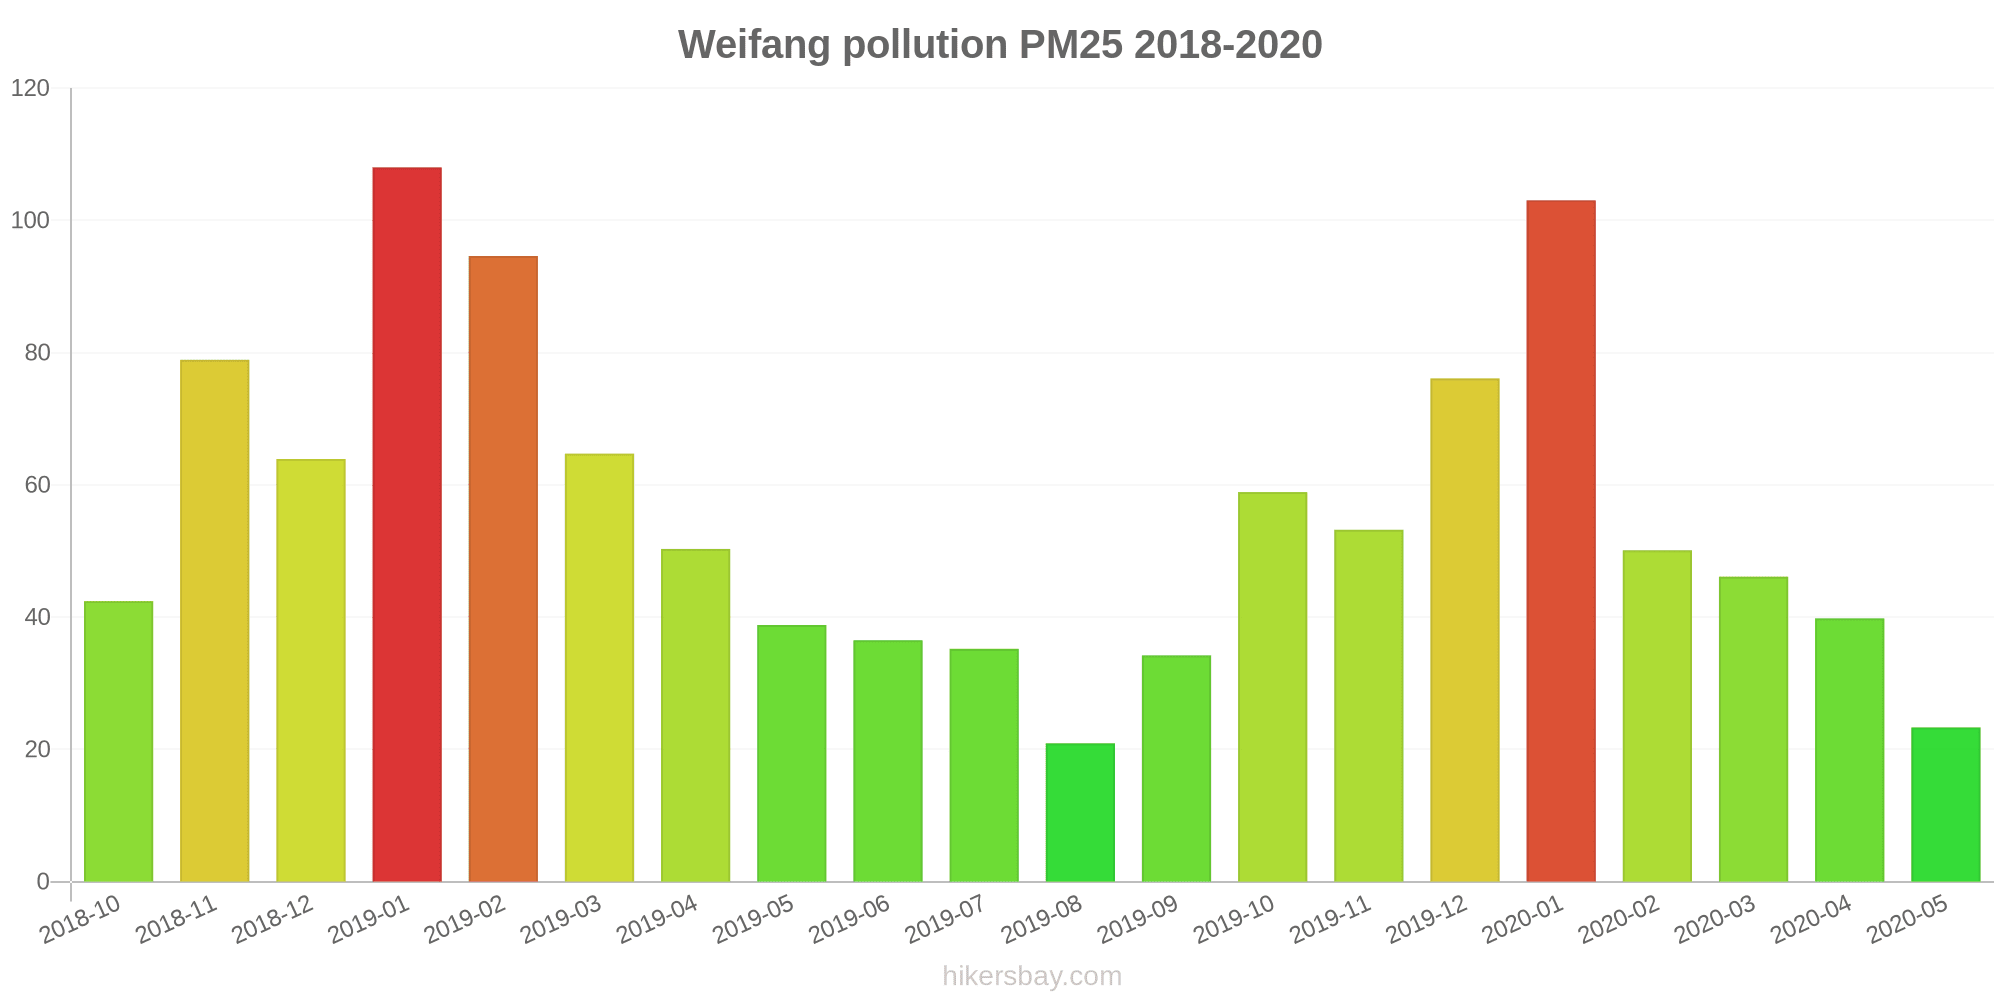
The highest PM2.5 values were recorded: 108 (January 2019).
The lowest level of particulate matter PM2.5 pollution occurs in month: August (21).
How high is the level of NO2? (nitrogen dioxide (NO2))
22 (Good)
What is the level of PM10 today in Weifang? (particulate matter (PM10) suspended dust)
The current level of particulate matter PM10 in Weifang is:
69 (Unhealthy for Sensitive Groups)
The highest PM10 values usually occur in month: 174 (January 2019).
The lowest value of particulate matter PM10 pollution in Weifang is usually recorded in: August (55).
How high is the CO level? (carbon monoxide (CO))
219 (Good)
How is the O3 level today in Weifang? (ozone (O3))
0 (Good)
What is the level of SO2 pollution? (sulfur dioxide (SO2))
8 (Good)
Current data Friday, May 27, 2022, 3:00 PM
PM2,5 61 (Unhealthy)
NO2 22 (Good)
PM10 69 (Unhealthy for Sensitive Groups)
CO 219 (Good)
O3 0 (Good)
SO2 8 (Good)
Data on air pollution from recent days in Weifang
index
2022-05-27
pm25
28
Moderate
no2
22
Good
pm10
35
Moderate
co
579
Good
o3
22
Good
so2
5
Good
data source »
Air pollution in Weifang from October 2018 to May 2020
index
2020-05
2020-04
2020-03
2020-02
2020-01
2019-12
2019-11
2019-10
2019-09
2019-08
2019-07
2019-06
2019-05
2019-04
2019-03
2019-02
2019-01
2018-12
2018-11
2018-10
pm25
23 (Moderate)
40 (Unhealthy for Sensitive Groups)
46 (Unhealthy for Sensitive Groups)
50 (Unhealthy for Sensitive Groups)
103 (Very Unhealthy)
76 (Very Unhealthy)
53 (Unhealthy for Sensitive Groups)
59 (Unhealthy)
34 (Moderate)
21 (Moderate)
35 (Unhealthy for Sensitive Groups)
37 (Unhealthy for Sensitive Groups)
39 (Unhealthy for Sensitive Groups)
50 (Unhealthy for Sensitive Groups)
65 (Unhealthy)
95 (Very Unhealthy)
108 (Very Unhealthy)
64 (Unhealthy)
79 (Very Unhealthy)
42 (Unhealthy for Sensitive Groups)
co
308 (Good)
427 (Good)
748 (Good)
730 (Good)
1 (Good)
1 (Good)
711 (Good)
606 (Good)
494 (Good)
374 (Good)
433 (Good)
465 (Good)
364 (Good)
471 (Good)
706 (Good)
1 (Good)
1 (Good)
1 (Good)
970 (Good)
703 (Good)
no2
17 (Good)
29 (Good)
29 (Good)
21 (Good)
45 (Moderate)
51 (Moderate)
42 (Moderate)
43 (Moderate)
33 (Good)
24 (Good)
20 (Good)
20 (Good)
29 (Good)
33 (Good)
44 (Moderate)
44 (Moderate)
58 (Moderate)
51 (Moderate)
55 (Moderate)
50 (Moderate)
o3
141 (Unhealthy for Sensitive Groups)
140 (Unhealthy for Sensitive Groups)
115 (Moderate)
93 (Moderate)
71 (Moderate)
57 (Good)
84 (Moderate)
127 (Unhealthy for Sensitive Groups)
160 (Unhealthy)
123 (Unhealthy for Sensitive Groups)
178 (Unhealthy)
196 (Very Unhealthy)
182 (Very Unhealthy)
136 (Unhealthy for Sensitive Groups)
127 (Unhealthy for Sensitive Groups)
95 (Moderate)
64 (Good)
63 (Good)
94 (Moderate)
110 (Moderate)
pm10
64 (Unhealthy for Sensitive Groups)
93 (Unhealthy)
100 (Unhealthy)
73 (Unhealthy for Sensitive Groups)
139 (Very Unhealthy)
110 (Very Unhealthy)
116 (Very Unhealthy)
122 (Very Unhealthy)
87 (Unhealthy)
55 (Unhealthy for Sensitive Groups)
72 (Unhealthy for Sensitive Groups)
83 (Unhealthy)
107 (Unhealthy)
101 (Unhealthy)
117 (Very Unhealthy)
138 (Very Unhealthy)
174 (Very bad Hazardous)
123 (Very Unhealthy)
159 (Very bad Hazardous)
103 (Unhealthy)
so2
8.7 (Good)
9.3 (Good)
8.5 (Good)
7.8 (Good)
20 (Good)
14 (Good)
9.8 (Good)
9.2 (Good)
7.5 (Good)
5.9 (Good)
5.7 (Good)
8.7 (Good)
11 (Good)
8.8 (Good)
14 (Good)
22 (Good)
36 (Good)
27 (Good)
18 (Good)
17 (Good)
data source »
仲裁委
Friday, May 27, 2022, 3:00 PM
PM2,5 61 (Unhealthy)
particulate matter (PM2.5) dust
NO2 22 (Good)
nitrogen dioxide (NO2)
PM10 69 (Unhealthy for Sensitive Groups)
particulate matter (PM10) suspended dust
CO 219 (Good)
carbon monoxide (CO)
O3 0.05 (Good)
ozone (O3)
SO2 7.7 (Good)
sulfur dioxide (SO2)
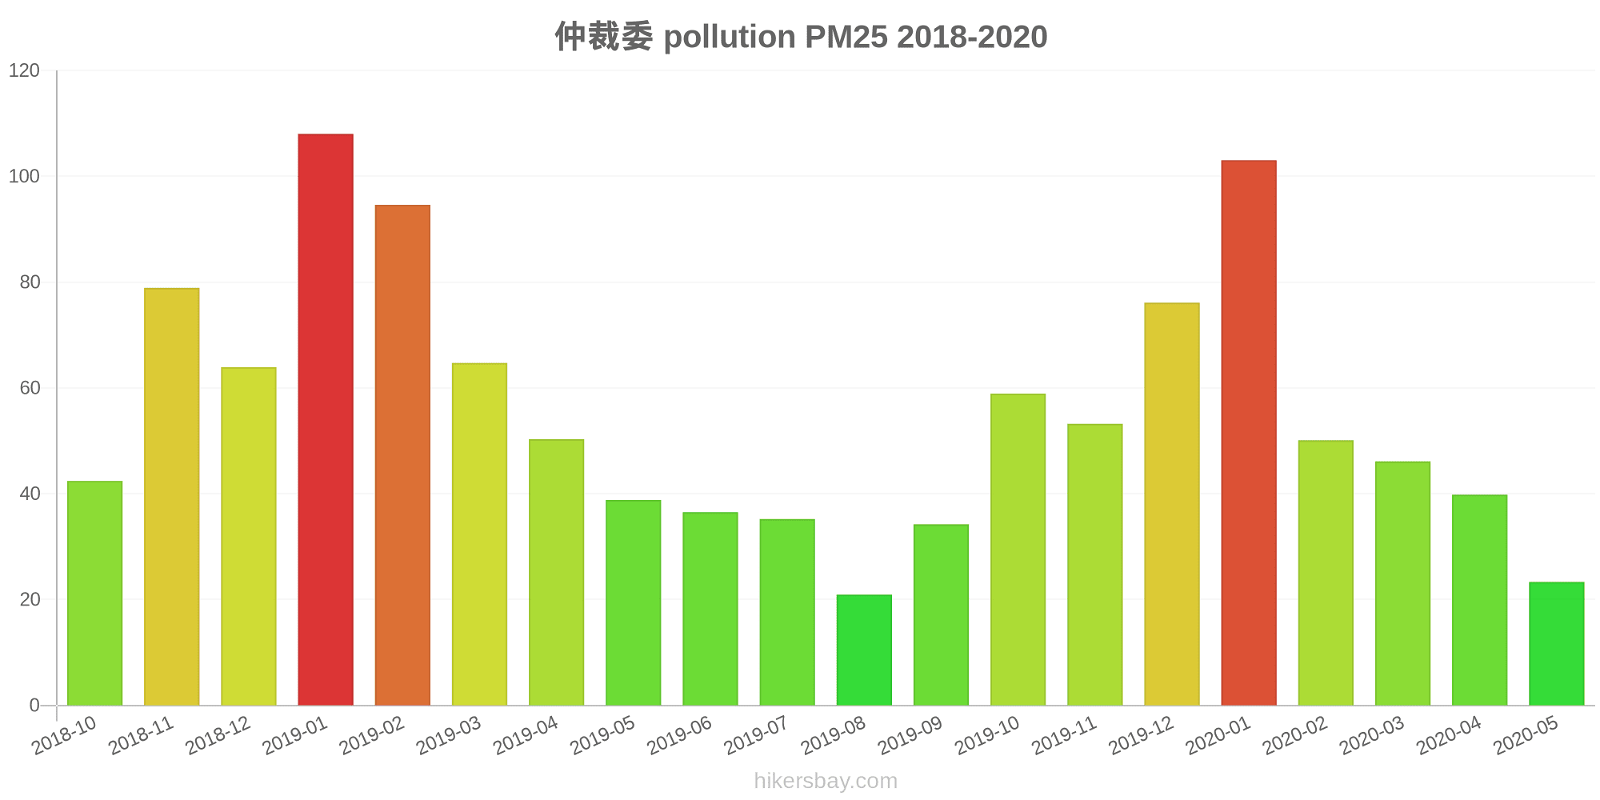
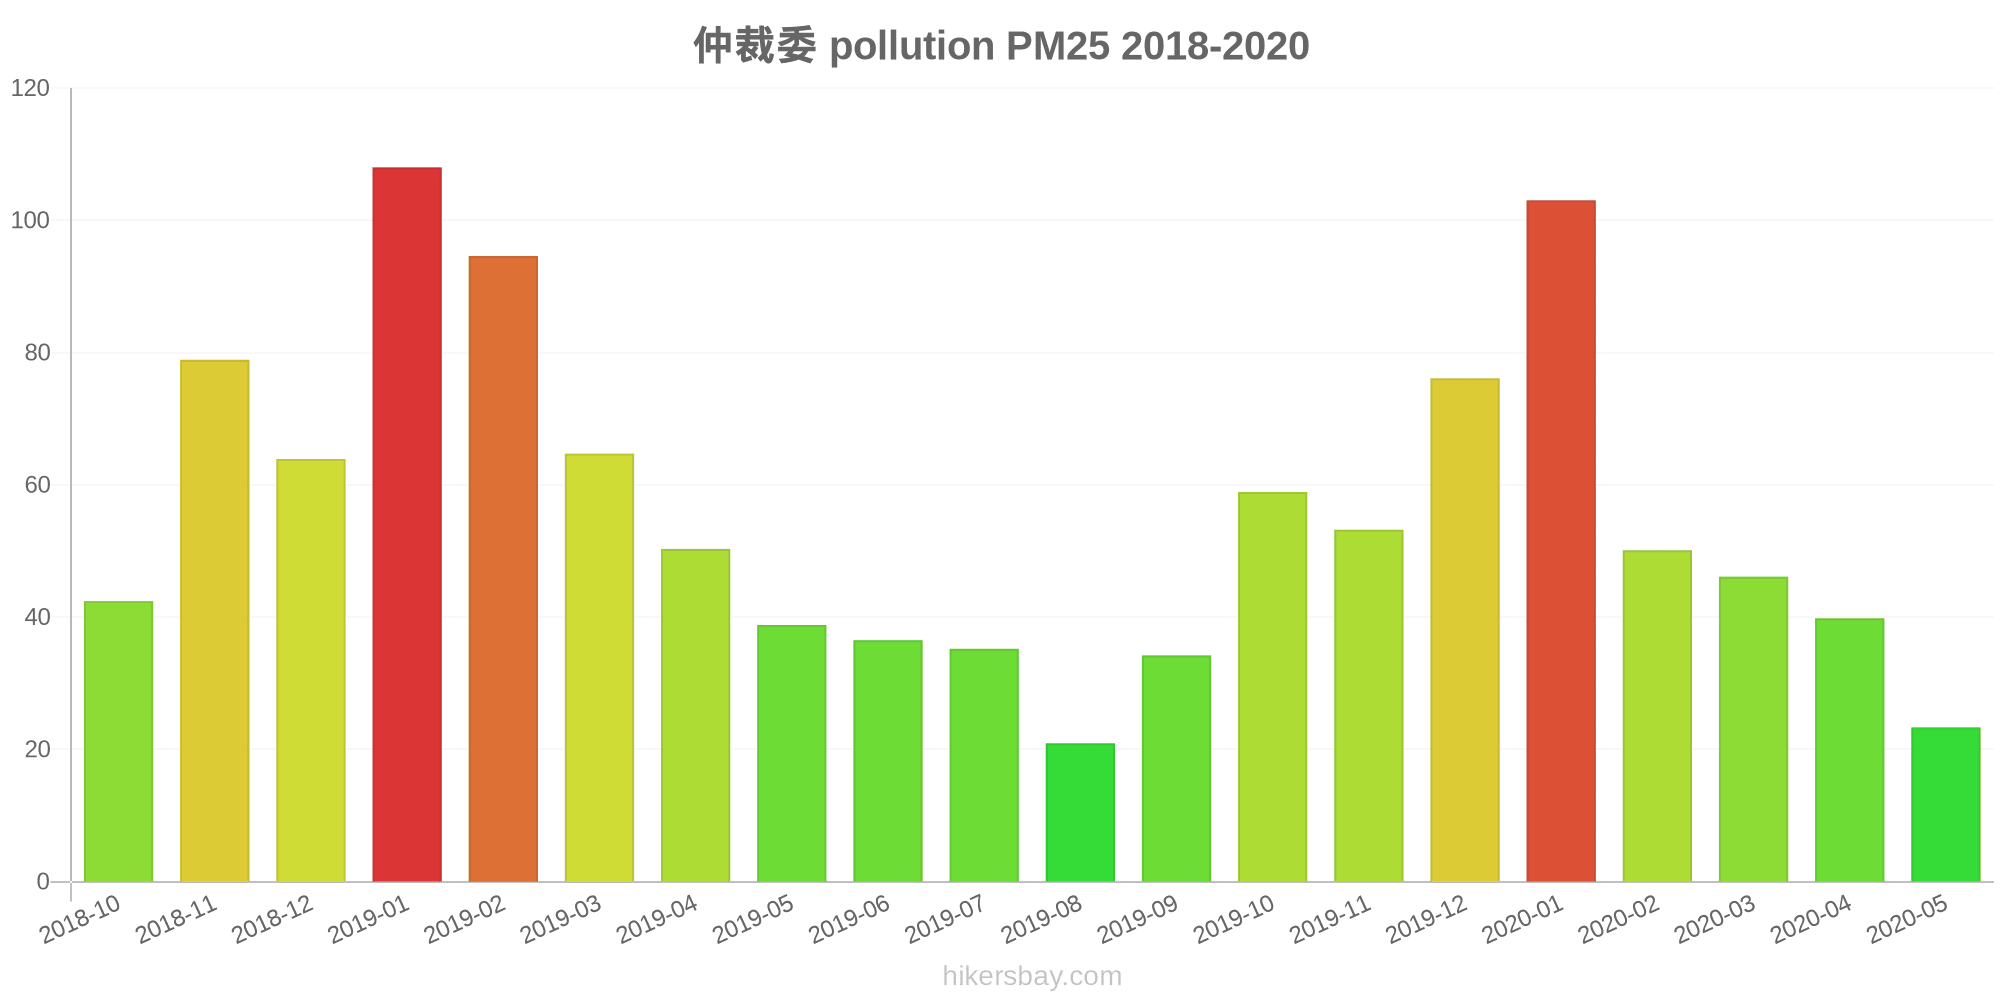
仲裁委
index
2022-05-27
pm25
28
no2
22
pm10
35
co
579
o3
22
so2
4.6
仲裁委
2018-10 2020-05
index
2020-05
2020-04
2020-03
2020-02
2020-01
2019-12
2019-11
2019-10
2019-09
2019-08
2019-07
2019-06
2019-05
2019-04
2019-03
2019-02
2019-01
2018-12
2018-11
2018-10
pm25
23
40
46
50
103
76
53
59
34
21
35
37
39
50
65
95
108
64
79
42
co
308
427
748
730
1
1
711
606
494
374
433
465
364
471
706
1
1
1
970
703
no2
17
29
29
21
45
51
42
43
33
24
20
20
29
33
44
44
58
51
55
50
o3
141
140
115
93
71
57
84
127
160
123
178
196
182
136
127
95
64
63
94
110
pm10
64
93
100
73
139
110
116
122
87
55
72
83
107
101
117
138
174
123
159
103
so2
8.7
9.3
8.5
7.8
20
14
9.8
9.2
7.5
5.9
5.7
8.7
11
8.8
14
22
36
27
18
17
* Pollution data source:
https://openaq.org
(ChinaAQIData)
The data is licensed under CC-By 4.0
PM2,5 61 (Unhealthy)
NO2 22 (Good)
PM10 69 (Unhealthy for Sensitive Groups)
CO 219 (Good)
O3 0 (Good)
SO2 8 (Good)
Data on air pollution from recent days in Weifang
| index | 2022-05-27 |
|---|---|
| pm25 | 28 Moderate |
| no2 | 22 Good |
| pm10 | 35 Moderate |
| co | 579 Good |
| o3 | 22 Good |
| so2 | 5 Good |
| index | 2020-05 | 2020-04 | 2020-03 | 2020-02 | 2020-01 | 2019-12 | 2019-11 | 2019-10 | 2019-09 | 2019-08 | 2019-07 | 2019-06 | 2019-05 | 2019-04 | 2019-03 | 2019-02 | 2019-01 | 2018-12 | 2018-11 | 2018-10 |
|---|---|---|---|---|---|---|---|---|---|---|---|---|---|---|---|---|---|---|---|---|
| pm25 | 23 (Moderate) | 40 (Unhealthy for Sensitive Groups) | 46 (Unhealthy for Sensitive Groups) | 50 (Unhealthy for Sensitive Groups) | 103 (Very Unhealthy) | 76 (Very Unhealthy) | 53 (Unhealthy for Sensitive Groups) | 59 (Unhealthy) | 34 (Moderate) | 21 (Moderate) | 35 (Unhealthy for Sensitive Groups) | 37 (Unhealthy for Sensitive Groups) | 39 (Unhealthy for Sensitive Groups) | 50 (Unhealthy for Sensitive Groups) | 65 (Unhealthy) | 95 (Very Unhealthy) | 108 (Very Unhealthy) | 64 (Unhealthy) | 79 (Very Unhealthy) | 42 (Unhealthy for Sensitive Groups) |
| co | 308 (Good) | 427 (Good) | 748 (Good) | 730 (Good) | 1 (Good) | 1 (Good) | 711 (Good) | 606 (Good) | 494 (Good) | 374 (Good) | 433 (Good) | 465 (Good) | 364 (Good) | 471 (Good) | 706 (Good) | 1 (Good) | 1 (Good) | 1 (Good) | 970 (Good) | 703 (Good) |
| no2 | 17 (Good) | 29 (Good) | 29 (Good) | 21 (Good) | 45 (Moderate) | 51 (Moderate) | 42 (Moderate) | 43 (Moderate) | 33 (Good) | 24 (Good) | 20 (Good) | 20 (Good) | 29 (Good) | 33 (Good) | 44 (Moderate) | 44 (Moderate) | 58 (Moderate) | 51 (Moderate) | 55 (Moderate) | 50 (Moderate) |
| o3 | 141 (Unhealthy for Sensitive Groups) | 140 (Unhealthy for Sensitive Groups) | 115 (Moderate) | 93 (Moderate) | 71 (Moderate) | 57 (Good) | 84 (Moderate) | 127 (Unhealthy for Sensitive Groups) | 160 (Unhealthy) | 123 (Unhealthy for Sensitive Groups) | 178 (Unhealthy) | 196 (Very Unhealthy) | 182 (Very Unhealthy) | 136 (Unhealthy for Sensitive Groups) | 127 (Unhealthy for Sensitive Groups) | 95 (Moderate) | 64 (Good) | 63 (Good) | 94 (Moderate) | 110 (Moderate) |
| pm10 | 64 (Unhealthy for Sensitive Groups) | 93 (Unhealthy) | 100 (Unhealthy) | 73 (Unhealthy for Sensitive Groups) | 139 (Very Unhealthy) | 110 (Very Unhealthy) | 116 (Very Unhealthy) | 122 (Very Unhealthy) | 87 (Unhealthy) | 55 (Unhealthy for Sensitive Groups) | 72 (Unhealthy for Sensitive Groups) | 83 (Unhealthy) | 107 (Unhealthy) | 101 (Unhealthy) | 117 (Very Unhealthy) | 138 (Very Unhealthy) | 174 (Very bad Hazardous) | 123 (Very Unhealthy) | 159 (Very bad Hazardous) | 103 (Unhealthy) |
| so2 | 8.7 (Good) | 9.3 (Good) | 8.5 (Good) | 7.8 (Good) | 20 (Good) | 14 (Good) | 9.8 (Good) | 9.2 (Good) | 7.5 (Good) | 5.9 (Good) | 5.7 (Good) | 8.7 (Good) | 11 (Good) | 8.8 (Good) | 14 (Good) | 22 (Good) | 36 (Good) | 27 (Good) | 18 (Good) | 17 (Good) |
PM2,5 61 (Unhealthy)
particulate matter (PM2.5) dustNO2 22 (Good)
nitrogen dioxide (NO2)PM10 69 (Unhealthy for Sensitive Groups)
particulate matter (PM10) suspended dustCO 219 (Good)
carbon monoxide (CO)O3 0.05 (Good)
ozone (O3)SO2 7.7 (Good)
sulfur dioxide (SO2)仲裁委
| index | 2022-05-27 |
|---|---|
| pm25 | 28 |
| no2 | 22 |
| pm10 | 35 |
| co | 579 |
| o3 | 22 |
| so2 | 4.6 |
仲裁委
| index | 2020-05 | 2020-04 | 2020-03 | 2020-02 | 2020-01 | 2019-12 | 2019-11 | 2019-10 | 2019-09 | 2019-08 | 2019-07 | 2019-06 | 2019-05 | 2019-04 | 2019-03 | 2019-02 | 2019-01 | 2018-12 | 2018-11 | 2018-10 |
|---|---|---|---|---|---|---|---|---|---|---|---|---|---|---|---|---|---|---|---|---|
| pm25 | 23 | 40 | 46 | 50 | 103 | 76 | 53 | 59 | 34 | 21 | 35 | 37 | 39 | 50 | 65 | 95 | 108 | 64 | 79 | 42 |
| co | 308 | 427 | 748 | 730 | 1 | 1 | 711 | 606 | 494 | 374 | 433 | 465 | 364 | 471 | 706 | 1 | 1 | 1 | 970 | 703 |
| no2 | 17 | 29 | 29 | 21 | 45 | 51 | 42 | 43 | 33 | 24 | 20 | 20 | 29 | 33 | 44 | 44 | 58 | 51 | 55 | 50 |
| o3 | 141 | 140 | 115 | 93 | 71 | 57 | 84 | 127 | 160 | 123 | 178 | 196 | 182 | 136 | 127 | 95 | 64 | 63 | 94 | 110 |
| pm10 | 64 | 93 | 100 | 73 | 139 | 110 | 116 | 122 | 87 | 55 | 72 | 83 | 107 | 101 | 117 | 138 | 174 | 123 | 159 | 103 |
| so2 | 8.7 | 9.3 | 8.5 | 7.8 | 20 | 14 | 9.8 | 9.2 | 7.5 | 5.9 | 5.7 | 8.7 | 11 | 8.8 | 14 | 22 | 36 | 27 | 18 | 17 |