Air Pollution in Weinan: Real-time Air Quality Index and smog alert.
Pollution and air quality forecast for Weinan. Today is Tuesday, June 2, 2026. The following air pollution values have been recorded for Weinan:- particulate matter (PM2.5) dust - 61 (Unhealthy)
- nitrogen dioxide (NO2) - 22 (Good)
- particulate matter (PM10) suspended dust - 69 (Unhealthy for Sensitive Groups)
- carbon monoxide (CO) - 219 (Good)
- ozone (O3) - 0 (Good)
- sulfur dioxide (SO2) - 8 (Good)

What is the air quality in Weinan today? Is the air polluted in Weinan?. Is there smog?
What is the current level of PM2.5 in Weinan? (particulate matter (PM2.5) dust)
Today's PM2.5 level is:
61 (Unhealthy)
For comparison, the highest level of PM2.5 in Weinan in the last 7 days was: 28 (Friday, May 27, 2022) and the lowest: 28 (Friday, May 27, 2022).
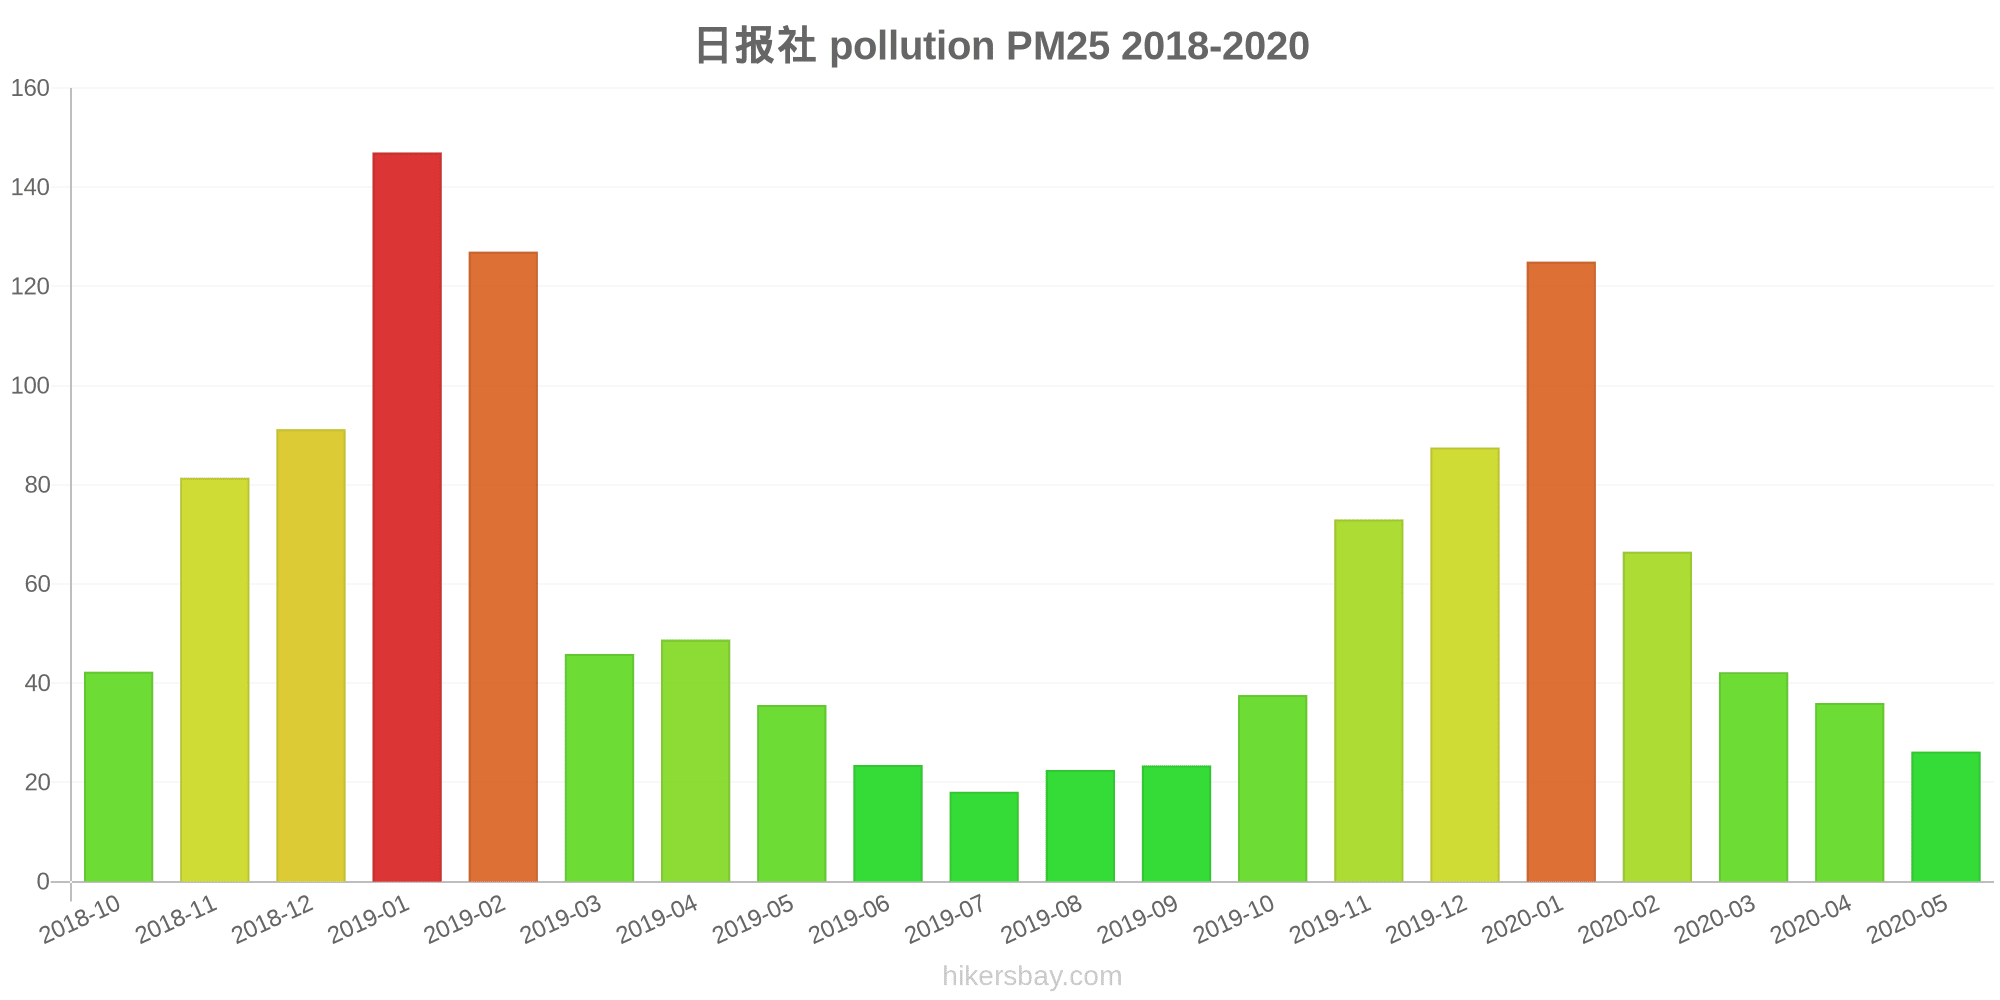
The highest PM2.5 values were recorded: 147 (January 2019).
The lowest level of particulate matter PM2.5 pollution occurs in month: July (18).
How high is the level of NO2? (nitrogen dioxide (NO2))
22 (Good)
What is the level of PM10 today in Weinan? (particulate matter (PM10) suspended dust)
The current level of particulate matter PM10 in Weinan is:
69 (Unhealthy for Sensitive Groups)
The highest PM10 values usually occur in month: 198 (January 2019).
The lowest value of particulate matter PM10 pollution in Weinan is usually recorded in: July (46).
How high is the CO level? (carbon monoxide (CO))
219 (Good)
How is the O3 level today in Weinan? (ozone (O3))
0 (Good)
What is the level of SO2 pollution? (sulfur dioxide (SO2))
8 (Good)
Current data Friday, May 27, 2022, 3:00 PM
PM2,5 61 (Unhealthy)
NO2 22 (Good)
PM10 69 (Unhealthy for Sensitive Groups)
CO 219 (Good)
O3 0 (Good)
SO2 8 (Good)
Data on air pollution from recent days in Weinan
index
2022-05-27
pm25
28
Moderate
no2
22
Good
pm10
35
Moderate
co
579
Good
o3
22
Good
so2
5
Good
data source »
Air pollution in Weinan from October 2018 to May 2020

index
2020-05
2020-04
2020-03
2020-02
2020-01
2019-12
2019-11
2019-10
2019-09
2019-08
2019-07
2019-06
2019-05
2019-04
2019-03
2019-02
2019-01
2018-12
2018-11
2018-10
pm25
26 (Moderate)
36 (Unhealthy for Sensitive Groups)
42 (Unhealthy for Sensitive Groups)
67 (Unhealthy)
125 (Very bad Hazardous)
88 (Very Unhealthy)
73 (Unhealthy)
38 (Unhealthy for Sensitive Groups)
23 (Moderate)
23 (Moderate)
18 (Moderate)
24 (Moderate)
36 (Unhealthy for Sensitive Groups)
49 (Unhealthy for Sensitive Groups)
46 (Unhealthy for Sensitive Groups)
127 (Very bad Hazardous)
147 (Very bad Hazardous)
91 (Very Unhealthy)
81 (Very Unhealthy)
42 (Unhealthy for Sensitive Groups)
co
487 (Good)
556 (Good)
608 (Good)
1 (Good)
1 (Good)
1 (Good)
942 (Good)
922 (Good)
755 (Good)
685 (Good)
499 (Good)
502 (Good)
410 (Good)
552 (Good)
428 (Good)
1 (Good)
1 (Good)
1 (Good)
1 (Good)
617 (Good)
no2
33 (Good)
45 (Moderate)
45 (Moderate)
34 (Good)
49 (Moderate)
60 (Moderate)
54 (Moderate)
35 (Good)
29 (Good)
22 (Good)
23 (Good)
28 (Good)
30 (Good)
34 (Good)
51 (Moderate)
38 (Good)
65 (Moderate)
56 (Moderate)
57 (Moderate)
45 (Moderate)
o3
144 (Unhealthy for Sensitive Groups)
125 (Unhealthy for Sensitive Groups)
103 (Moderate)
101 (Moderate)
61 (Good)
50 (Good)
54 (Good)
78 (Moderate)
141 (Unhealthy for Sensitive Groups)
158 (Unhealthy)
160 (Unhealthy)
160 (Unhealthy)
139 (Unhealthy for Sensitive Groups)
121 (Unhealthy for Sensitive Groups)
112 (Moderate)
80 (Moderate)
49 (Good)
44 (Good)
74 (Moderate)
99 (Moderate)
pm10
72 (Unhealthy for Sensitive Groups)
80 (Unhealthy)
100 (Unhealthy)
103 (Unhealthy)
150 (Very bad Hazardous)
138 (Very Unhealthy)
127 (Very Unhealthy)
80 (Unhealthy)
48 (Moderate)
47 (Moderate)
46 (Moderate)
60 (Unhealthy for Sensitive Groups)
120 (Very Unhealthy)
123 (Very Unhealthy)
123 (Very Unhealthy)
175 (Very bad Hazardous)
198 (Very bad Hazardous)
189 (Very bad Hazardous)
166 (Very bad Hazardous)
101 (Unhealthy)
so2
12 (Good)
14 (Good)
12 (Good)
13 (Good)
16 (Good)
16 (Good)
12 (Good)
7.3 (Good)
6.2 (Good)
6.8 (Good)
6 (Good)
9.9 (Good)
11 (Good)
9.5 (Good)
11 (Good)
15 (Good)
20 (Good)
26 (Good)
12 (Good)
5.5 (Good)
data source »
日报社
Friday, May 27, 2022, 3:00 PM
PM2,5 61 (Unhealthy)
particulate matter (PM2.5) dust
NO2 22 (Good)
nitrogen dioxide (NO2)
PM10 69 (Unhealthy for Sensitive Groups)
particulate matter (PM10) suspended dust
CO 219 (Good)
carbon monoxide (CO)
O3 0.05 (Good)
ozone (O3)
SO2 7.7 (Good)
sulfur dioxide (SO2)
日报社
index
2022-05-27
pm25
28
no2
22
pm10
35
co
579
o3
22
so2
4.6
日报社
2018-10 2020-05

index
2020-05
2020-04
2020-03
2020-02
2020-01
2019-12
2019-11
2019-10
2019-09
2019-08
2019-07
2019-06
2019-05
2019-04
2019-03
2019-02
2019-01
2018-12
2018-11
2018-10
o3
144
125
103
101
61
50
54
78
141
158
160
160
139
121
112
80
49
44
74
99
co
487
556
608
1
1
1
942
922
755
685
499
502
410
552
428
1
1
1
1
617
no2
33
45
45
34
49
60
54
35
29
22
23
28
30
34
51
38
65
56
57
45
pm25
26
36
42
67
125
88
73
38
23
23
18
24
36
49
46
127
147
91
81
42
pm10
72
80
100
103
150
138
127
80
48
47
46
60
120
123
123
175
198
189
166
101
so2
12
14
12
13
16
16
12
7.3
6.2
6.8
6
9.9
11
9.5
11
15
20
26
12
5.5
* Pollution data source:
https://openaq.org
(ChinaAQIData)
The data is licensed under CC-By 4.0
PM2,5 61 (Unhealthy)
NO2 22 (Good)
PM10 69 (Unhealthy for Sensitive Groups)
CO 219 (Good)
O3 0 (Good)
SO2 8 (Good)
Data on air pollution from recent days in Weinan
| index | 2022-05-27 |
|---|---|
| pm25 | 28 Moderate |
| no2 | 22 Good |
| pm10 | 35 Moderate |
| co | 579 Good |
| o3 | 22 Good |
| so2 | 5 Good |

| index | 2020-05 | 2020-04 | 2020-03 | 2020-02 | 2020-01 | 2019-12 | 2019-11 | 2019-10 | 2019-09 | 2019-08 | 2019-07 | 2019-06 | 2019-05 | 2019-04 | 2019-03 | 2019-02 | 2019-01 | 2018-12 | 2018-11 | 2018-10 |
|---|---|---|---|---|---|---|---|---|---|---|---|---|---|---|---|---|---|---|---|---|
| pm25 | 26 (Moderate) | 36 (Unhealthy for Sensitive Groups) | 42 (Unhealthy for Sensitive Groups) | 67 (Unhealthy) | 125 (Very bad Hazardous) | 88 (Very Unhealthy) | 73 (Unhealthy) | 38 (Unhealthy for Sensitive Groups) | 23 (Moderate) | 23 (Moderate) | 18 (Moderate) | 24 (Moderate) | 36 (Unhealthy for Sensitive Groups) | 49 (Unhealthy for Sensitive Groups) | 46 (Unhealthy for Sensitive Groups) | 127 (Very bad Hazardous) | 147 (Very bad Hazardous) | 91 (Very Unhealthy) | 81 (Very Unhealthy) | 42 (Unhealthy for Sensitive Groups) |
| co | 487 (Good) | 556 (Good) | 608 (Good) | 1 (Good) | 1 (Good) | 1 (Good) | 942 (Good) | 922 (Good) | 755 (Good) | 685 (Good) | 499 (Good) | 502 (Good) | 410 (Good) | 552 (Good) | 428 (Good) | 1 (Good) | 1 (Good) | 1 (Good) | 1 (Good) | 617 (Good) |
| no2 | 33 (Good) | 45 (Moderate) | 45 (Moderate) | 34 (Good) | 49 (Moderate) | 60 (Moderate) | 54 (Moderate) | 35 (Good) | 29 (Good) | 22 (Good) | 23 (Good) | 28 (Good) | 30 (Good) | 34 (Good) | 51 (Moderate) | 38 (Good) | 65 (Moderate) | 56 (Moderate) | 57 (Moderate) | 45 (Moderate) |
| o3 | 144 (Unhealthy for Sensitive Groups) | 125 (Unhealthy for Sensitive Groups) | 103 (Moderate) | 101 (Moderate) | 61 (Good) | 50 (Good) | 54 (Good) | 78 (Moderate) | 141 (Unhealthy for Sensitive Groups) | 158 (Unhealthy) | 160 (Unhealthy) | 160 (Unhealthy) | 139 (Unhealthy for Sensitive Groups) | 121 (Unhealthy for Sensitive Groups) | 112 (Moderate) | 80 (Moderate) | 49 (Good) | 44 (Good) | 74 (Moderate) | 99 (Moderate) |
| pm10 | 72 (Unhealthy for Sensitive Groups) | 80 (Unhealthy) | 100 (Unhealthy) | 103 (Unhealthy) | 150 (Very bad Hazardous) | 138 (Very Unhealthy) | 127 (Very Unhealthy) | 80 (Unhealthy) | 48 (Moderate) | 47 (Moderate) | 46 (Moderate) | 60 (Unhealthy for Sensitive Groups) | 120 (Very Unhealthy) | 123 (Very Unhealthy) | 123 (Very Unhealthy) | 175 (Very bad Hazardous) | 198 (Very bad Hazardous) | 189 (Very bad Hazardous) | 166 (Very bad Hazardous) | 101 (Unhealthy) |
| so2 | 12 (Good) | 14 (Good) | 12 (Good) | 13 (Good) | 16 (Good) | 16 (Good) | 12 (Good) | 7.3 (Good) | 6.2 (Good) | 6.8 (Good) | 6 (Good) | 9.9 (Good) | 11 (Good) | 9.5 (Good) | 11 (Good) | 15 (Good) | 20 (Good) | 26 (Good) | 12 (Good) | 5.5 (Good) |
PM2,5 61 (Unhealthy)
particulate matter (PM2.5) dustNO2 22 (Good)
nitrogen dioxide (NO2)PM10 69 (Unhealthy for Sensitive Groups)
particulate matter (PM10) suspended dustCO 219 (Good)
carbon monoxide (CO)O3 0.05 (Good)
ozone (O3)SO2 7.7 (Good)
sulfur dioxide (SO2)日报社
| index | 2022-05-27 |
|---|---|
| pm25 | 28 |
| no2 | 22 |
| pm10 | 35 |
| co | 579 |
| o3 | 22 |
| so2 | 4.6 |
日报社
| index | 2020-05 | 2020-04 | 2020-03 | 2020-02 | 2020-01 | 2019-12 | 2019-11 | 2019-10 | 2019-09 | 2019-08 | 2019-07 | 2019-06 | 2019-05 | 2019-04 | 2019-03 | 2019-02 | 2019-01 | 2018-12 | 2018-11 | 2018-10 |
|---|---|---|---|---|---|---|---|---|---|---|---|---|---|---|---|---|---|---|---|---|
| o3 | 144 | 125 | 103 | 101 | 61 | 50 | 54 | 78 | 141 | 158 | 160 | 160 | 139 | 121 | 112 | 80 | 49 | 44 | 74 | 99 |
| co | 487 | 556 | 608 | 1 | 1 | 1 | 942 | 922 | 755 | 685 | 499 | 502 | 410 | 552 | 428 | 1 | 1 | 1 | 1 | 617 |
| no2 | 33 | 45 | 45 | 34 | 49 | 60 | 54 | 35 | 29 | 22 | 23 | 28 | 30 | 34 | 51 | 38 | 65 | 56 | 57 | 45 |
| pm25 | 26 | 36 | 42 | 67 | 125 | 88 | 73 | 38 | 23 | 23 | 18 | 24 | 36 | 49 | 46 | 127 | 147 | 91 | 81 | 42 |
| pm10 | 72 | 80 | 100 | 103 | 150 | 138 | 127 | 80 | 48 | 47 | 46 | 60 | 120 | 123 | 123 | 175 | 198 | 189 | 166 | 101 |
| so2 | 12 | 14 | 12 | 13 | 16 | 16 | 12 | 7.3 | 6.2 | 6.8 | 6 | 9.9 | 11 | 9.5 | 11 | 15 | 20 | 26 | 12 | 5.5 |