Air Pollution in Wuchang: Real-time Air Quality Index and smog alert.
Pollution and air quality forecast for Wuchang. Today is Tuesday, June 2, 2026. The following air pollution values have been recorded for Wuchang:- particulate matter (PM2.5) dust - 61 (Unhealthy)
- nitrogen dioxide (NO2) - 22 (Good)
- particulate matter (PM10) suspended dust - 69 (Unhealthy for Sensitive Groups)
- carbon monoxide (CO) - 219 (Good)
- ozone (O3) - 0 (Good)
- sulfur dioxide (SO2) - 8 (Good)

What is the air quality in Wuchang today? Is the air polluted in Wuchang?. Is there smog?
What is the current level of PM2.5 in Wuchang? (particulate matter (PM2.5) dust)
Today's PM2.5 level is:
61 (Unhealthy)
For comparison, the highest level of PM2.5 in Wuchang in the last 7 days was: 28 (Friday, May 27, 2022) and the lowest: 28 (Friday, May 27, 2022).
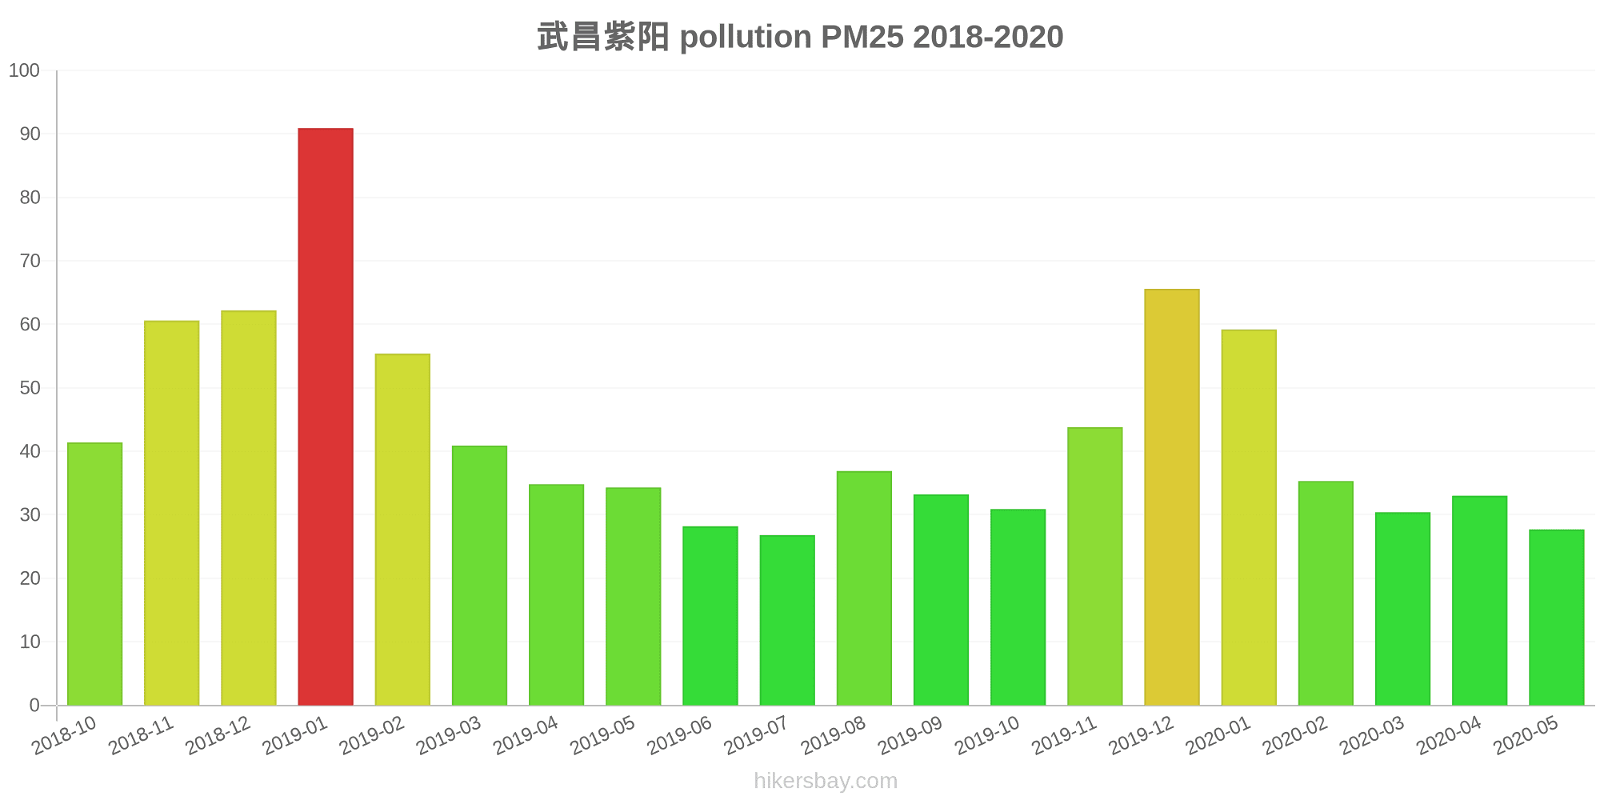
The highest PM2.5 values were recorded: 91 (January 2019).
The lowest level of particulate matter PM2.5 pollution occurs in month: July (27).
How high is the level of NO2? (nitrogen dioxide (NO2))
22 (Good)
What is the level of PM10 today in Wuchang? (particulate matter (PM10) suspended dust)
The current level of particulate matter PM10 in Wuchang is:
69 (Unhealthy for Sensitive Groups)
The highest PM10 values usually occur in month: 116 (January 2019).
The lowest value of particulate matter PM10 pollution in Wuchang is usually recorded in: February (47).
How high is the CO level? (carbon monoxide (CO))
219 (Good)
How is the O3 level today in Wuchang? (ozone (O3))
0 (Good)
What is the level of SO2 pollution? (sulfur dioxide (SO2))
8 (Good)
Current data Friday, May 27, 2022, 3:00 PM
PM2,5 61 (Unhealthy)
NO2 22 (Good)
PM10 69 (Unhealthy for Sensitive Groups)
CO 219 (Good)
O3 0 (Good)
SO2 8 (Good)
Data on air pollution from recent days in Wuchang
index
2022-05-27
pm25
28
Moderate
no2
22
Good
pm10
35
Moderate
co
579
Good
o3
22
Good
so2
5
Good
data source »
Air pollution in Wuchang from October 2018 to May 2020

index
2020-05
2020-04
2020-03
2020-02
2020-01
2019-12
2019-11
2019-10
2019-09
2019-08
2019-07
2019-06
2019-05
2019-04
2019-03
2019-02
2019-01
2018-12
2018-11
2018-10
pm25
28 (Moderate)
33 (Moderate)
30 (Moderate)
35 (Unhealthy for Sensitive Groups)
59 (Unhealthy)
66 (Unhealthy)
44 (Unhealthy for Sensitive Groups)
31 (Moderate)
33 (Moderate)
37 (Unhealthy for Sensitive Groups)
27 (Moderate)
28 (Moderate)
34 (Moderate)
35 (Moderate)
41 (Unhealthy for Sensitive Groups)
55 (Unhealthy)
91 (Very Unhealthy)
62 (Unhealthy)
61 (Unhealthy)
41 (Unhealthy for Sensitive Groups)
co
912 (Good)
787 (Good)
874 (Good)
833 (Good)
984 (Good)
1 (Good)
1 (Good)
937 (Good)
871 (Good)
984 (Good)
871 (Good)
1 (Good)
1 (Good)
1 (Good)
1 (Good)
976 (Good)
1 (Good)
1 (Good)
1 (Good)
1 (Good)
no2
30 (Good)
39 (Good)
22 (Good)
24 (Good)
40 (Moderate)
69 (Moderate)
65 (Moderate)
48 (Moderate)
46 (Moderate)
34 (Good)
31 (Good)
36 (Good)
51 (Moderate)
46 (Moderate)
59 (Moderate)
44 (Moderate)
64 (Moderate)
51 (Moderate)
60 (Moderate)
71 (Moderate)
o3
131 (Unhealthy for Sensitive Groups)
130 (Unhealthy for Sensitive Groups)
103 (Moderate)
85 (Moderate)
53 (Good)
55 (Good)
88 (Moderate)
119 (Moderate)
182 (Very Unhealthy)
187 (Very Unhealthy)
156 (Unhealthy)
170 (Unhealthy)
145 (Unhealthy for Sensitive Groups)
122 (Unhealthy for Sensitive Groups)
92 (Moderate)
53 (Good)
44 (Good)
41 (Good)
83 (Moderate)
104 (Moderate)
pm10
61 (Unhealthy for Sensitive Groups)
60 (Unhealthy for Sensitive Groups)
53 (Unhealthy for Sensitive Groups)
47 (Moderate)
72 (Unhealthy for Sensitive Groups)
101 (Unhealthy)
89 (Unhealthy)
57 (Unhealthy for Sensitive Groups)
64 (Unhealthy for Sensitive Groups)
56 (Unhealthy for Sensitive Groups)
52 (Unhealthy for Sensitive Groups)
52 (Unhealthy for Sensitive Groups)
77 (Unhealthy for Sensitive Groups)
70 (Unhealthy for Sensitive Groups)
93 (Unhealthy)
79 (Unhealthy for Sensitive Groups)
116 (Very Unhealthy)
84 (Unhealthy)
81 (Unhealthy)
87 (Unhealthy)
so2
5.7 (Good)
9.8 (Good)
9.6 (Good)
8.6 (Good)
6.9 (Good)
13 (Good)
11 (Good)
9.3 (Good)
13 (Good)
11 (Good)
6.5 (Good)
5.6 (Good)
7.6 (Good)
8.9 (Good)
12 (Good)
9.9 (Good)
12 (Good)
10 (Good)
11 (Good)
14 (Good)
data source »
武昌紫阳
Friday, May 27, 2022, 3:00 PM
PM2,5 61 (Unhealthy)
particulate matter (PM2.5) dust
NO2 22 (Good)
nitrogen dioxide (NO2)
PM10 69 (Unhealthy for Sensitive Groups)
particulate matter (PM10) suspended dust
CO 219 (Good)
carbon monoxide (CO)
O3 0.05 (Good)
ozone (O3)
SO2 7.7 (Good)
sulfur dioxide (SO2)
武昌紫阳
index
2022-05-27
pm25
28
no2
22
pm10
35
co
579
o3
22
so2
4.6
武昌紫阳
2018-10 2020-05
index
2020-05
2020-04
2020-03
2020-02
2020-01
2019-12
2019-11
2019-10
2019-09
2019-08
2019-07
2019-06
2019-05
2019-04
2019-03
2019-02
2019-01
2018-12
2018-11
2018-10
pm25
28
33
30
35
59
66
44
31
33
37
27
28
34
35
41
55
91
62
61
41
co
912
787
874
833
984
1
1
937
871
984
871
1
1
1
1
976
1
1
1
1
no2
30
39
22
24
40
69
65
48
46
34
31
36
51
46
59
44
64
51
60
71
o3
131
130
103
85
53
55
88
119
182
187
156
170
145
122
92
53
44
41
83
104
pm10
61
60
53
47
72
101
89
57
64
56
52
52
77
70
93
79
116
84
81
87
so2
5.7
9.8
9.6
8.6
6.9
13
11
9.3
13
11
6.5
5.6
7.6
8.9
12
9.9
12
10
11
14
* Pollution data source:
https://openaq.org
(ChinaAQIData)
The data is licensed under CC-By 4.0
PM2,5 61 (Unhealthy)
NO2 22 (Good)
PM10 69 (Unhealthy for Sensitive Groups)
CO 219 (Good)
O3 0 (Good)
SO2 8 (Good)
Data on air pollution from recent days in Wuchang
| index | 2022-05-27 |
|---|---|
| pm25 | 28 Moderate |
| no2 | 22 Good |
| pm10 | 35 Moderate |
| co | 579 Good |
| o3 | 22 Good |
| so2 | 5 Good |

| index | 2020-05 | 2020-04 | 2020-03 | 2020-02 | 2020-01 | 2019-12 | 2019-11 | 2019-10 | 2019-09 | 2019-08 | 2019-07 | 2019-06 | 2019-05 | 2019-04 | 2019-03 | 2019-02 | 2019-01 | 2018-12 | 2018-11 | 2018-10 |
|---|---|---|---|---|---|---|---|---|---|---|---|---|---|---|---|---|---|---|---|---|
| pm25 | 28 (Moderate) | 33 (Moderate) | 30 (Moderate) | 35 (Unhealthy for Sensitive Groups) | 59 (Unhealthy) | 66 (Unhealthy) | 44 (Unhealthy for Sensitive Groups) | 31 (Moderate) | 33 (Moderate) | 37 (Unhealthy for Sensitive Groups) | 27 (Moderate) | 28 (Moderate) | 34 (Moderate) | 35 (Moderate) | 41 (Unhealthy for Sensitive Groups) | 55 (Unhealthy) | 91 (Very Unhealthy) | 62 (Unhealthy) | 61 (Unhealthy) | 41 (Unhealthy for Sensitive Groups) |
| co | 912 (Good) | 787 (Good) | 874 (Good) | 833 (Good) | 984 (Good) | 1 (Good) | 1 (Good) | 937 (Good) | 871 (Good) | 984 (Good) | 871 (Good) | 1 (Good) | 1 (Good) | 1 (Good) | 1 (Good) | 976 (Good) | 1 (Good) | 1 (Good) | 1 (Good) | 1 (Good) |
| no2 | 30 (Good) | 39 (Good) | 22 (Good) | 24 (Good) | 40 (Moderate) | 69 (Moderate) | 65 (Moderate) | 48 (Moderate) | 46 (Moderate) | 34 (Good) | 31 (Good) | 36 (Good) | 51 (Moderate) | 46 (Moderate) | 59 (Moderate) | 44 (Moderate) | 64 (Moderate) | 51 (Moderate) | 60 (Moderate) | 71 (Moderate) |
| o3 | 131 (Unhealthy for Sensitive Groups) | 130 (Unhealthy for Sensitive Groups) | 103 (Moderate) | 85 (Moderate) | 53 (Good) | 55 (Good) | 88 (Moderate) | 119 (Moderate) | 182 (Very Unhealthy) | 187 (Very Unhealthy) | 156 (Unhealthy) | 170 (Unhealthy) | 145 (Unhealthy for Sensitive Groups) | 122 (Unhealthy for Sensitive Groups) | 92 (Moderate) | 53 (Good) | 44 (Good) | 41 (Good) | 83 (Moderate) | 104 (Moderate) |
| pm10 | 61 (Unhealthy for Sensitive Groups) | 60 (Unhealthy for Sensitive Groups) | 53 (Unhealthy for Sensitive Groups) | 47 (Moderate) | 72 (Unhealthy for Sensitive Groups) | 101 (Unhealthy) | 89 (Unhealthy) | 57 (Unhealthy for Sensitive Groups) | 64 (Unhealthy for Sensitive Groups) | 56 (Unhealthy for Sensitive Groups) | 52 (Unhealthy for Sensitive Groups) | 52 (Unhealthy for Sensitive Groups) | 77 (Unhealthy for Sensitive Groups) | 70 (Unhealthy for Sensitive Groups) | 93 (Unhealthy) | 79 (Unhealthy for Sensitive Groups) | 116 (Very Unhealthy) | 84 (Unhealthy) | 81 (Unhealthy) | 87 (Unhealthy) |
| so2 | 5.7 (Good) | 9.8 (Good) | 9.6 (Good) | 8.6 (Good) | 6.9 (Good) | 13 (Good) | 11 (Good) | 9.3 (Good) | 13 (Good) | 11 (Good) | 6.5 (Good) | 5.6 (Good) | 7.6 (Good) | 8.9 (Good) | 12 (Good) | 9.9 (Good) | 12 (Good) | 10 (Good) | 11 (Good) | 14 (Good) |
PM2,5 61 (Unhealthy)
particulate matter (PM2.5) dustNO2 22 (Good)
nitrogen dioxide (NO2)PM10 69 (Unhealthy for Sensitive Groups)
particulate matter (PM10) suspended dustCO 219 (Good)
carbon monoxide (CO)O3 0.05 (Good)
ozone (O3)SO2 7.7 (Good)
sulfur dioxide (SO2)武昌紫阳
| index | 2022-05-27 |
|---|---|
| pm25 | 28 |
| no2 | 22 |
| pm10 | 35 |
| co | 579 |
| o3 | 22 |
| so2 | 4.6 |
武昌紫阳

| index | 2020-05 | 2020-04 | 2020-03 | 2020-02 | 2020-01 | 2019-12 | 2019-11 | 2019-10 | 2019-09 | 2019-08 | 2019-07 | 2019-06 | 2019-05 | 2019-04 | 2019-03 | 2019-02 | 2019-01 | 2018-12 | 2018-11 | 2018-10 |
|---|---|---|---|---|---|---|---|---|---|---|---|---|---|---|---|---|---|---|---|---|
| pm25 | 28 | 33 | 30 | 35 | 59 | 66 | 44 | 31 | 33 | 37 | 27 | 28 | 34 | 35 | 41 | 55 | 91 | 62 | 61 | 41 |
| co | 912 | 787 | 874 | 833 | 984 | 1 | 1 | 937 | 871 | 984 | 871 | 1 | 1 | 1 | 1 | 976 | 1 | 1 | 1 | 1 |
| no2 | 30 | 39 | 22 | 24 | 40 | 69 | 65 | 48 | 46 | 34 | 31 | 36 | 51 | 46 | 59 | 44 | 64 | 51 | 60 | 71 |
| o3 | 131 | 130 | 103 | 85 | 53 | 55 | 88 | 119 | 182 | 187 | 156 | 170 | 145 | 122 | 92 | 53 | 44 | 41 | 83 | 104 |
| pm10 | 61 | 60 | 53 | 47 | 72 | 101 | 89 | 57 | 64 | 56 | 52 | 52 | 77 | 70 | 93 | 79 | 116 | 84 | 81 | 87 |
| so2 | 5.7 | 9.8 | 9.6 | 8.6 | 6.9 | 13 | 11 | 9.3 | 13 | 11 | 6.5 | 5.6 | 7.6 | 8.9 | 12 | 9.9 | 12 | 10 | 11 | 14 |