Air Pollution in Wuhan Shi: Real-time Air Quality Index and smog alert.
Pollution and air quality forecast for Wuhan Shi. Today is Tuesday, June 2, 2026. The following air pollution values have been recorded for Wuhan Shi:- particulate matter (PM2.5) dust - 61 (Unhealthy)
- nitrogen dioxide (NO2) - 22 (Good)
- particulate matter (PM10) suspended dust - 69 (Unhealthy for Sensitive Groups)
- carbon monoxide (CO) - 219 (Good)
- ozone (O3) - 0 (Good)
- sulfur dioxide (SO2) - 8 (Good)

What is the air quality in Wuhan Shi today? Is the air polluted in Wuhan Shi?. Is there smog?
What is the current level of PM2.5 in Wuhan Shi? (particulate matter (PM2.5) dust)
Today's PM2.5 level is:
61 (Unhealthy)
For comparison, the highest level of PM2.5 in Wuhan Shi in the last 7 days was: 28 (Friday, May 27, 2022) and the lowest: 28 (Friday, May 27, 2022).
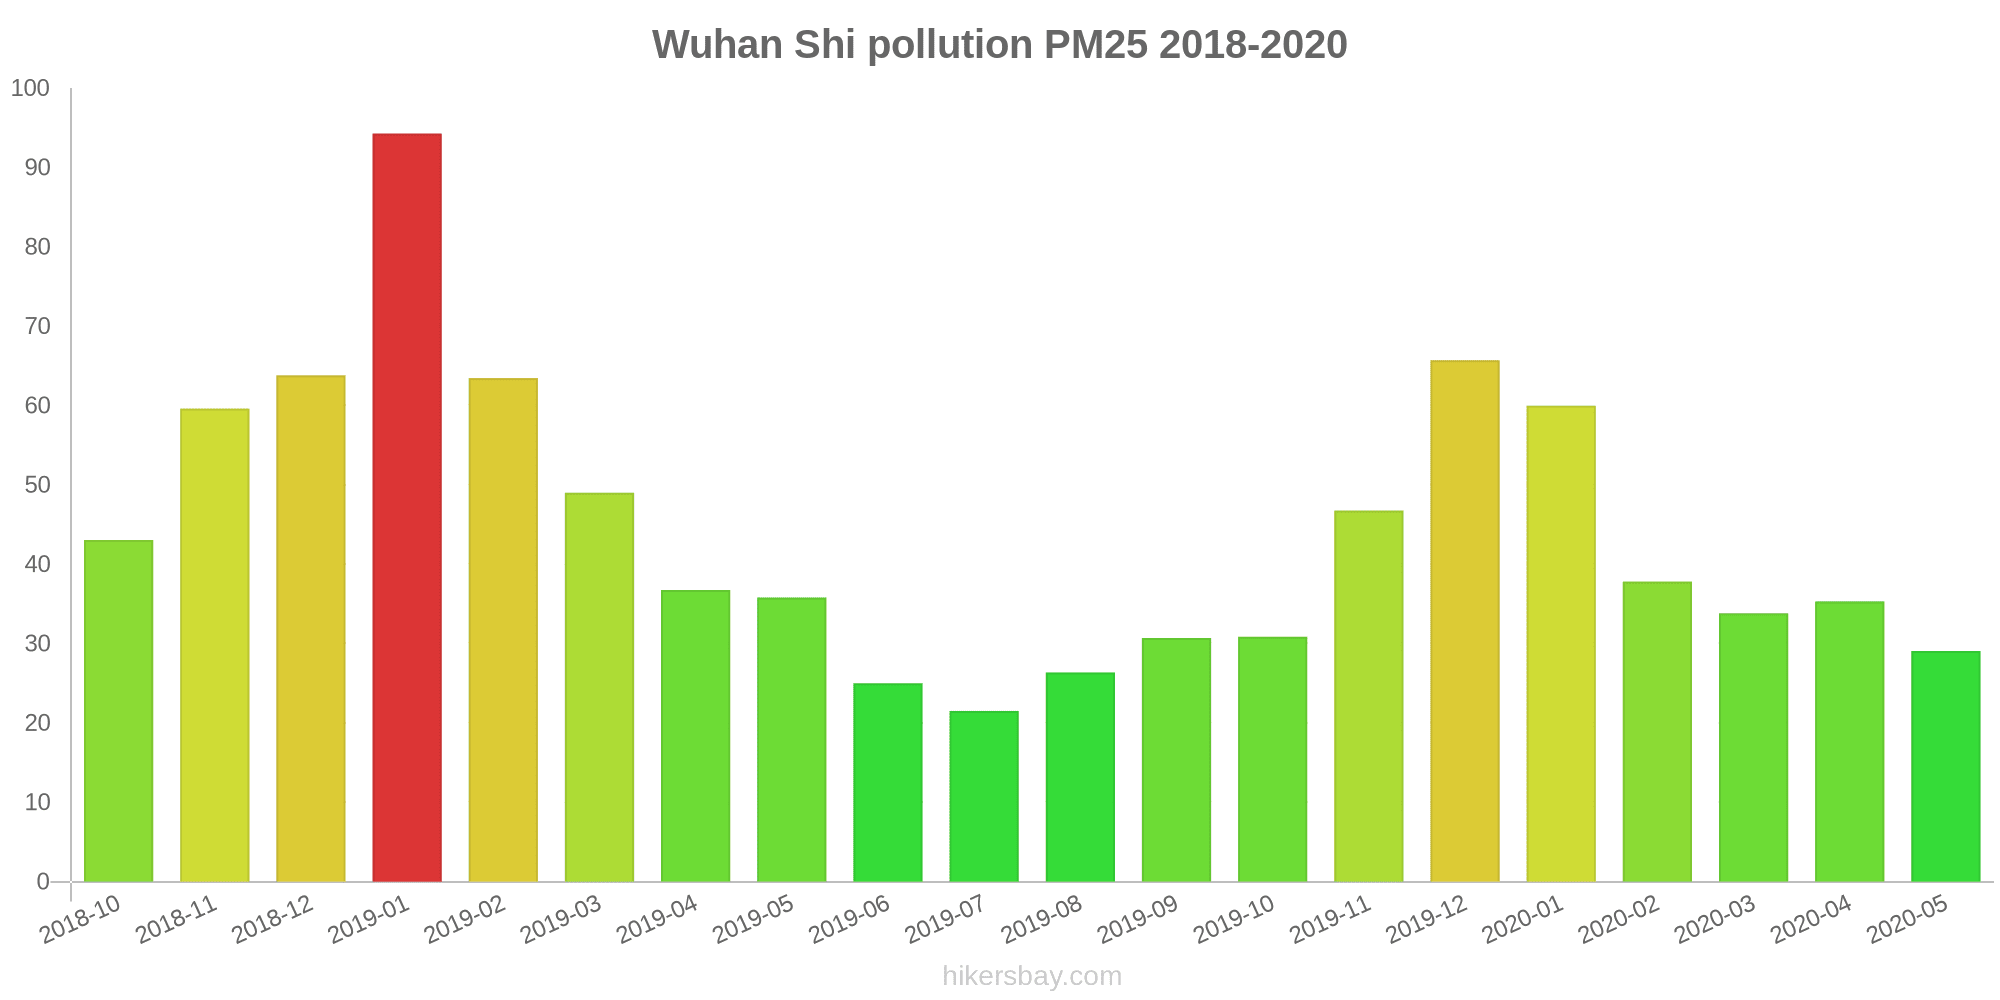
The highest PM2.5 values were recorded: 94 (January 2019).
The lowest level of particulate matter PM2.5 pollution occurs in month: July (22).
How high is the level of NO2? (nitrogen dioxide (NO2))
22 (Good)
What is the level of PM10 today in Wuhan Shi? (particulate matter (PM10) suspended dust)
The current level of particulate matter PM10 in Wuhan Shi is:
69 (Unhealthy for Sensitive Groups)
The highest PM10 values usually occur in month: 97 (January 2019).
The lowest value of particulate matter PM10 pollution in Wuhan Shi is usually recorded in: July (43).
How high is the CO level? (carbon monoxide (CO))
219 (Good)
How is the O3 level today in Wuhan Shi? (ozone (O3))
0 (Good)
What is the level of SO2 pollution? (sulfur dioxide (SO2))
8 (Good)
Current data Friday, May 27, 2022, 3:00 PM
PM2,5 61 (Unhealthy)
NO2 22 (Good)
PM10 69 (Unhealthy for Sensitive Groups)
CO 219 (Good)
O3 0 (Good)
SO2 8 (Good)
Data on air pollution from recent days in Wuhan Shi
index
2022-05-27
pm25
28
Moderate
no2
22
Good
pm10
35
Moderate
co
579
Good
o3
22
Good
so2
5
Good
data source »
Air pollution in Wuhan Shi from October 2018 to May 2020

index
2020-05
2020-04
2020-03
2020-02
2020-01
2019-12
2019-11
2019-10
2019-09
2019-08
2019-07
2019-06
2019-05
2019-04
2019-03
2019-02
2019-01
2018-12
2018-11
2018-10
pm25
29 (Moderate)
35 (Unhealthy for Sensitive Groups)
34 (Moderate)
38 (Unhealthy for Sensitive Groups)
60 (Unhealthy)
66 (Unhealthy)
47 (Unhealthy for Sensitive Groups)
31 (Moderate)
31 (Moderate)
26 (Moderate)
22 (Moderate)
25 (Moderate)
36 (Unhealthy for Sensitive Groups)
37 (Unhealthy for Sensitive Groups)
49 (Unhealthy for Sensitive Groups)
63 (Unhealthy)
94 (Very Unhealthy)
64 (Unhealthy)
60 (Unhealthy)
43 (Unhealthy for Sensitive Groups)
co
347 (Good)
712 (Good)
425 (Good)
419 (Good)
975 (Good)
1 (Good)
900 (Good)
855 (Good)
890 (Good)
854 (Good)
704 (Good)
717 (Good)
778 (Good)
972 (Good)
472 (Good)
468 (Good)
1 (Good)
1 (Good)
480 (Good)
845 (Good)
no2
31 (Good)
37 (Good)
24 (Good)
25 (Good)
37 (Good)
63 (Moderate)
58 (Moderate)
43 (Moderate)
39 (Good)
29 (Good)
31 (Good)
33 (Good)
50 (Moderate)
44 (Moderate)
57 (Moderate)
37 (Good)
59 (Moderate)
46 (Moderate)
55 (Moderate)
61 (Moderate)
o3
133 (Unhealthy for Sensitive Groups)
139 (Unhealthy for Sensitive Groups)
105 (Moderate)
88 (Moderate)
57 (Good)
55 (Good)
86 (Moderate)
121 (Unhealthy for Sensitive Groups)
180 (Very Unhealthy)
183 (Very Unhealthy)
144 (Unhealthy for Sensitive Groups)
164 (Unhealthy)
135 (Unhealthy for Sensitive Groups)
123 (Unhealthy for Sensitive Groups)
97 (Moderate)
56 (Good)
47 (Good)
44 (Good)
80 (Moderate)
109 (Moderate)
pm10
53 (Unhealthy for Sensitive Groups)
57 (Unhealthy for Sensitive Groups)
53 (Unhealthy for Sensitive Groups)
46 (Moderate)
70 (Unhealthy for Sensitive Groups)
94 (Unhealthy)
84 (Unhealthy)
54 (Unhealthy for Sensitive Groups)
56 (Unhealthy for Sensitive Groups)
48 (Moderate)
43 (Moderate)
46 (Moderate)
72 (Unhealthy for Sensitive Groups)
59 (Unhealthy for Sensitive Groups)
77 (Unhealthy for Sensitive Groups)
74 (Unhealthy for Sensitive Groups)
97 (Unhealthy)
74 (Unhealthy for Sensitive Groups)
74 (Unhealthy for Sensitive Groups)
68 (Unhealthy for Sensitive Groups)
so2
7.5 (Good)
9 (Good)
8.1 (Good)
6.7 (Good)
6.2 (Good)
9.8 (Good)
10 (Good)
8.7 (Good)
10 (Good)
5.8 (Good)
4.8 (Good)
5 (Good)
7 (Good)
6.8 (Good)
7.7 (Good)
5.6 (Good)
7.2 (Good)
6.4 (Good)
7.8 (Good)
9.2 (Good)
data source »
Quality of life in Wuhan Shi
Green and Parks in the City
Wuhan Shi
51%
Mongolia: 27%
Bhutan: 82%
Hong Kong: 52%
Myanmar: 33%
particulate matter PM2.5
Wuhan Shi
57 (Unhealthy)
Pleasure of spending time in the city
Wuhan Shi
25%
Mongolia: 22%
Bhutan: 61%
Hong Kong: 43%
Myanmar: 24%
particulate matter PM10
Wuhan Shi
92 (Unhealthy)
Air Pollution
Wuhan Shi
82%
Mongolia: 87%
Bhutan: 45%
Hong Kong: 67%
Myanmar: 83%
Garbage Disposal
Wuhan Shi
30%
Mongolia: 27%
Bhutan: 47%
Hong Kong: 52%
Myanmar: 12%
Availability and quality of drinking water
Wuhan Shi
34%
Mongolia: 46%
Bhutan: 64%
Hong Kong: 66%
Myanmar: 34%
Cleanliness and tidiness
Wuhan Shi
25%
Mongolia: 29%
Bhutan: 57%
Hong Kong: 54%
Myanmar: 18%
Noise and Light pollution
Wuhan Shi
63%
Mongolia: 48%
Bhutan: 55%
Hong Kong: 66%
Myanmar: 52%
Water Pollution
Wuhan Shi
70%
Mongolia: 68%
Bhutan: 56%
Hong Kong: 53%
Myanmar: 74%
Source: Numbeo
汉口江滩
Friday, May 27, 2022, 3:00 PM
PM2,5 61 (Unhealthy)
particulate matter (PM2.5) dust
NO2 22 (Good)
nitrogen dioxide (NO2)
PM10 69 (Unhealthy for Sensitive Groups)
particulate matter (PM10) suspended dust
CO 219 (Good)
carbon monoxide (CO)
O3 0.05 (Good)
ozone (O3)
SO2 7.7 (Good)
sulfur dioxide (SO2)
汉口花桥
Friday, May 27, 2022, 3:00 PM
PM2,5 61 (Unhealthy)
particulate matter (PM2.5) dust
NO2 22 (Good)
nitrogen dioxide (NO2)
PM10 69 (Unhealthy for Sensitive Groups)
particulate matter (PM10) suspended dust
CO 219 (Good)
carbon monoxide (CO)
O3 0.05 (Good)
ozone (O3)
SO2 7.7 (Good)
sulfur dioxide (SO2)
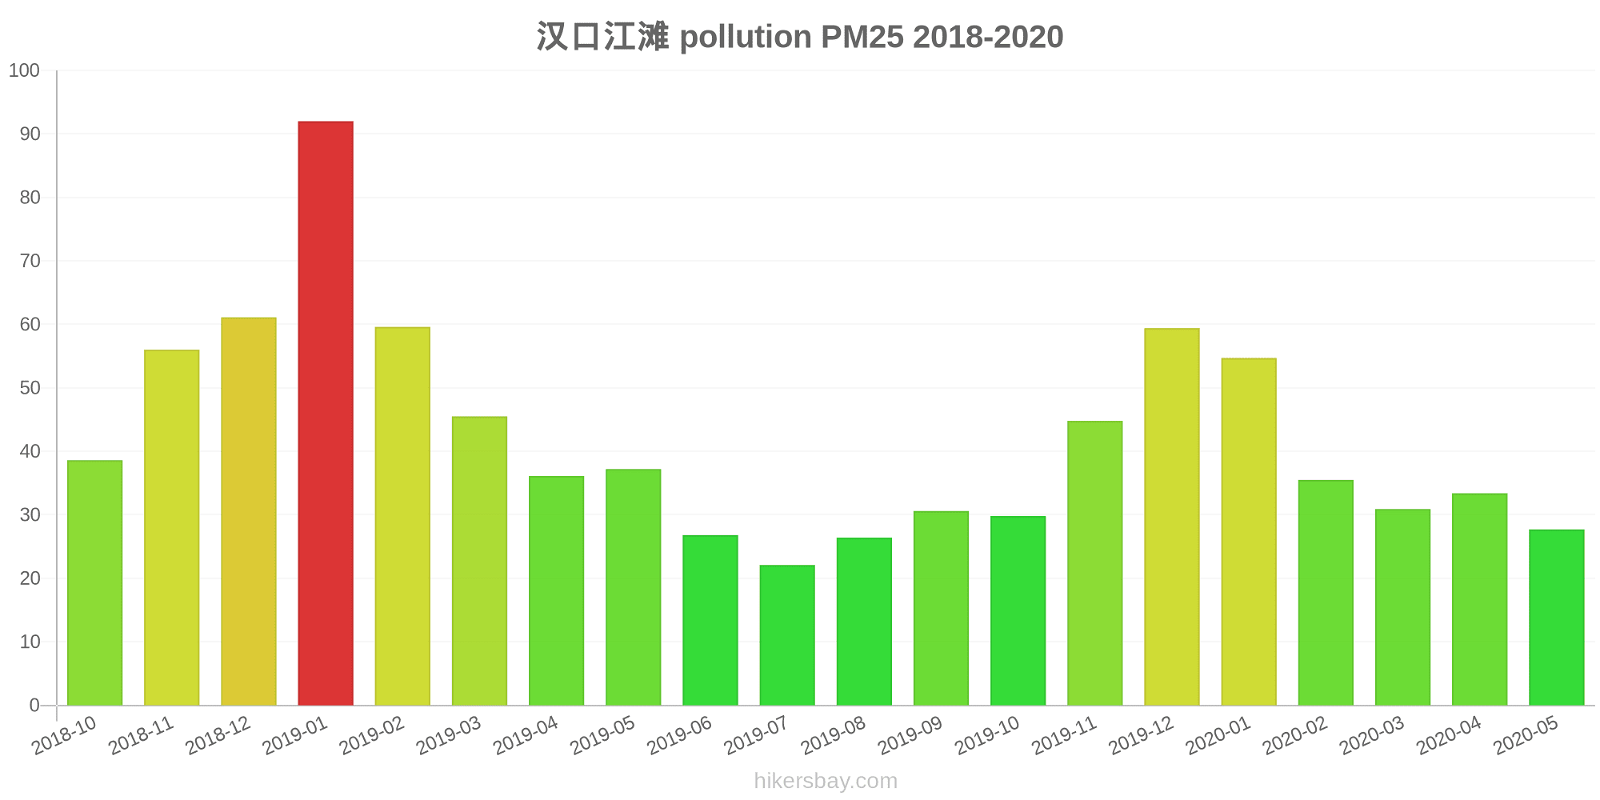
汉口江滩
index
2022-05-27
pm25
28
no2
22
pm10
35
co
579
o3
22
so2
4.6
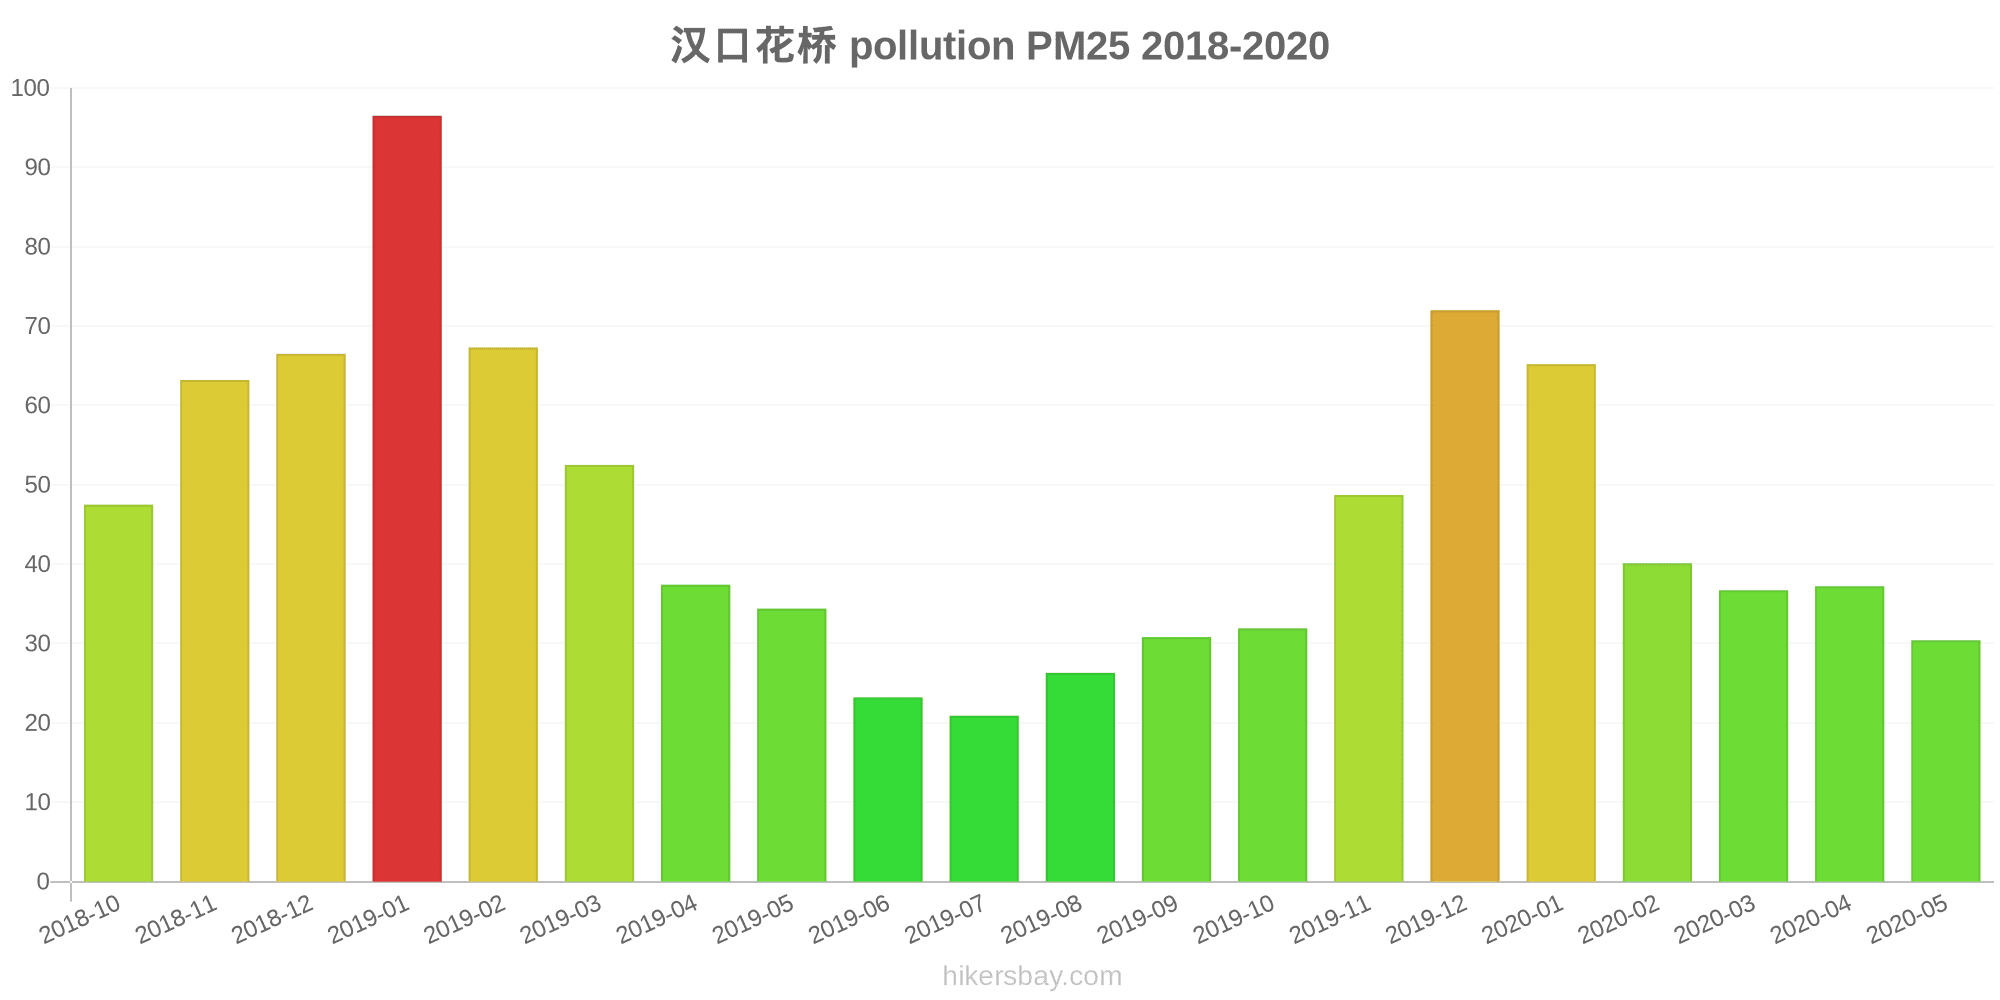
汉口花桥
index
2022-05-27
pm25
28
no2
22
pm10
35
co
579
o3
22
so2
4.6
汉口江滩
2018-10 2020-05
index
2020-05
2020-04
2020-03
2020-02
2020-01
2019-12
2019-11
2019-10
2019-09
2019-08
2019-07
2019-06
2019-05
2019-04
2019-03
2019-02
2019-01
2018-12
2018-11
2018-10
pm25
28
33
31
36
55
59
45
30
31
26
22
27
37
36
46
60
92
61
56
39
co
1
737
848
1
985
1
831
846
829
798
682
748
753
961
942
935
1
1
958
793
no2
36
43
24
22
33
61
55
40
40
34
42
41
57
47
62
36
55
45
53
62
o3
129
136
103
87
58
56
89
122
181
180
135
160
127
116
92
55
46
45
79
107
pm10
56
56
54
45
69
95
85
53
57
51
45
48
67
55
70
71
92
68
66
58
so2
7.9
9.9
8.6
7.3
6.8
11
11
8.2
8.8
6
4.4
3.7
6.2
6.2
7.1
5.6
7.1
6.9
7.8
7.7
汉口花桥
2018-10 2020-05

index
2020-05
2020-04
2020-03
2020-02
2020-01
2019-12
2019-11
2019-10
2019-09
2019-08
2019-07
2019-06
2019-05
2019-04
2019-03
2019-02
2019-01
2018-12
2018-11
2018-10
pm25
30
37
37
40
65
72
49
32
31
26
21
23
34
37
53
67
97
67
63
48
co
692
686
1
837
964
1
968
864
950
909
726
686
803
982
1
1
1
1
1
897
no2
27
32
25
28
41
66
61
46
38
25
20
25
42
40
52
38
62
48
57
60
o3
136
141
107
89
57
54
84
119
179
185
152
168
142
129
101
56
49
44
81
110
pm10
49
59
53
46
71
93
83
55
55
46
40
45
77
62
84
77
103
81
82
78
so2
7.1
8.2
7.5
6.1
5.6
9.1
9.8
9.3
12
5.5
5.1
6.2
7.9
7.3
8.3
5.7
7.3
5.9
7.7
11
* Pollution data source:
https://openaq.org
(ChinaAQIData)
The data is licensed under CC-By 4.0
PM2,5 61 (Unhealthy)
NO2 22 (Good)
PM10 69 (Unhealthy for Sensitive Groups)
CO 219 (Good)
O3 0 (Good)
SO2 8 (Good)
Data on air pollution from recent days in Wuhan Shi
| index | 2022-05-27 |
|---|---|
| pm25 | 28 Moderate |
| no2 | 22 Good |
| pm10 | 35 Moderate |
| co | 579 Good |
| o3 | 22 Good |
| so2 | 5 Good |
| index | 2020-05 | 2020-04 | 2020-03 | 2020-02 | 2020-01 | 2019-12 | 2019-11 | 2019-10 | 2019-09 | 2019-08 | 2019-07 | 2019-06 | 2019-05 | 2019-04 | 2019-03 | 2019-02 | 2019-01 | 2018-12 | 2018-11 | 2018-10 |
|---|---|---|---|---|---|---|---|---|---|---|---|---|---|---|---|---|---|---|---|---|
| pm25 | 29 (Moderate) | 35 (Unhealthy for Sensitive Groups) | 34 (Moderate) | 38 (Unhealthy for Sensitive Groups) | 60 (Unhealthy) | 66 (Unhealthy) | 47 (Unhealthy for Sensitive Groups) | 31 (Moderate) | 31 (Moderate) | 26 (Moderate) | 22 (Moderate) | 25 (Moderate) | 36 (Unhealthy for Sensitive Groups) | 37 (Unhealthy for Sensitive Groups) | 49 (Unhealthy for Sensitive Groups) | 63 (Unhealthy) | 94 (Very Unhealthy) | 64 (Unhealthy) | 60 (Unhealthy) | 43 (Unhealthy for Sensitive Groups) |
| co | 347 (Good) | 712 (Good) | 425 (Good) | 419 (Good) | 975 (Good) | 1 (Good) | 900 (Good) | 855 (Good) | 890 (Good) | 854 (Good) | 704 (Good) | 717 (Good) | 778 (Good) | 972 (Good) | 472 (Good) | 468 (Good) | 1 (Good) | 1 (Good) | 480 (Good) | 845 (Good) |
| no2 | 31 (Good) | 37 (Good) | 24 (Good) | 25 (Good) | 37 (Good) | 63 (Moderate) | 58 (Moderate) | 43 (Moderate) | 39 (Good) | 29 (Good) | 31 (Good) | 33 (Good) | 50 (Moderate) | 44 (Moderate) | 57 (Moderate) | 37 (Good) | 59 (Moderate) | 46 (Moderate) | 55 (Moderate) | 61 (Moderate) |
| o3 | 133 (Unhealthy for Sensitive Groups) | 139 (Unhealthy for Sensitive Groups) | 105 (Moderate) | 88 (Moderate) | 57 (Good) | 55 (Good) | 86 (Moderate) | 121 (Unhealthy for Sensitive Groups) | 180 (Very Unhealthy) | 183 (Very Unhealthy) | 144 (Unhealthy for Sensitive Groups) | 164 (Unhealthy) | 135 (Unhealthy for Sensitive Groups) | 123 (Unhealthy for Sensitive Groups) | 97 (Moderate) | 56 (Good) | 47 (Good) | 44 (Good) | 80 (Moderate) | 109 (Moderate) |
| pm10 | 53 (Unhealthy for Sensitive Groups) | 57 (Unhealthy for Sensitive Groups) | 53 (Unhealthy for Sensitive Groups) | 46 (Moderate) | 70 (Unhealthy for Sensitive Groups) | 94 (Unhealthy) | 84 (Unhealthy) | 54 (Unhealthy for Sensitive Groups) | 56 (Unhealthy for Sensitive Groups) | 48 (Moderate) | 43 (Moderate) | 46 (Moderate) | 72 (Unhealthy for Sensitive Groups) | 59 (Unhealthy for Sensitive Groups) | 77 (Unhealthy for Sensitive Groups) | 74 (Unhealthy for Sensitive Groups) | 97 (Unhealthy) | 74 (Unhealthy for Sensitive Groups) | 74 (Unhealthy for Sensitive Groups) | 68 (Unhealthy for Sensitive Groups) |
| so2 | 7.5 (Good) | 9 (Good) | 8.1 (Good) | 6.7 (Good) | 6.2 (Good) | 9.8 (Good) | 10 (Good) | 8.7 (Good) | 10 (Good) | 5.8 (Good) | 4.8 (Good) | 5 (Good) | 7 (Good) | 6.8 (Good) | 7.7 (Good) | 5.6 (Good) | 7.2 (Good) | 6.4 (Good) | 7.8 (Good) | 9.2 (Good) |
Green and Parks in the City
Wuhan Shi 51%
Mongolia: 27% Bhutan: 82% Hong Kong: 52% Myanmar: 33%particulate matter PM2.5
Wuhan Shi 57 (Unhealthy)
Pleasure of spending time in the city
Wuhan Shi 25%
Mongolia: 22% Bhutan: 61% Hong Kong: 43% Myanmar: 24%particulate matter PM10
Wuhan Shi 92 (Unhealthy)
Air Pollution
Wuhan Shi 82%
Mongolia: 87% Bhutan: 45% Hong Kong: 67% Myanmar: 83%Garbage Disposal
Wuhan Shi 30%
Mongolia: 27% Bhutan: 47% Hong Kong: 52% Myanmar: 12%Availability and quality of drinking water
Wuhan Shi 34%
Mongolia: 46% Bhutan: 64% Hong Kong: 66% Myanmar: 34%Cleanliness and tidiness
Wuhan Shi 25%
Mongolia: 29% Bhutan: 57% Hong Kong: 54% Myanmar: 18%Noise and Light pollution
Wuhan Shi 63%
Mongolia: 48% Bhutan: 55% Hong Kong: 66% Myanmar: 52%Water Pollution
Wuhan Shi 70%
Mongolia: 68% Bhutan: 56% Hong Kong: 53% Myanmar: 74%PM2,5 61 (Unhealthy)
particulate matter (PM2.5) dustNO2 22 (Good)
nitrogen dioxide (NO2)PM10 69 (Unhealthy for Sensitive Groups)
particulate matter (PM10) suspended dustCO 219 (Good)
carbon monoxide (CO)O3 0.05 (Good)
ozone (O3)SO2 7.7 (Good)
sulfur dioxide (SO2)PM2,5 61 (Unhealthy)
particulate matter (PM2.5) dustNO2 22 (Good)
nitrogen dioxide (NO2)PM10 69 (Unhealthy for Sensitive Groups)
particulate matter (PM10) suspended dustCO 219 (Good)
carbon monoxide (CO)O3 0.05 (Good)
ozone (O3)SO2 7.7 (Good)
sulfur dioxide (SO2)汉口江滩
| index | 2022-05-27 |
|---|---|
| pm25 | 28 |
| no2 | 22 |
| pm10 | 35 |
| co | 579 |
| o3 | 22 |
| so2 | 4.6 |
汉口花桥
| index | 2022-05-27 |
|---|---|
| pm25 | 28 |
| no2 | 22 |
| pm10 | 35 |
| co | 579 |
| o3 | 22 |
| so2 | 4.6 |
汉口江滩

| index | 2020-05 | 2020-04 | 2020-03 | 2020-02 | 2020-01 | 2019-12 | 2019-11 | 2019-10 | 2019-09 | 2019-08 | 2019-07 | 2019-06 | 2019-05 | 2019-04 | 2019-03 | 2019-02 | 2019-01 | 2018-12 | 2018-11 | 2018-10 |
|---|---|---|---|---|---|---|---|---|---|---|---|---|---|---|---|---|---|---|---|---|
| pm25 | 28 | 33 | 31 | 36 | 55 | 59 | 45 | 30 | 31 | 26 | 22 | 27 | 37 | 36 | 46 | 60 | 92 | 61 | 56 | 39 |
| co | 1 | 737 | 848 | 1 | 985 | 1 | 831 | 846 | 829 | 798 | 682 | 748 | 753 | 961 | 942 | 935 | 1 | 1 | 958 | 793 |
| no2 | 36 | 43 | 24 | 22 | 33 | 61 | 55 | 40 | 40 | 34 | 42 | 41 | 57 | 47 | 62 | 36 | 55 | 45 | 53 | 62 |
| o3 | 129 | 136 | 103 | 87 | 58 | 56 | 89 | 122 | 181 | 180 | 135 | 160 | 127 | 116 | 92 | 55 | 46 | 45 | 79 | 107 |
| pm10 | 56 | 56 | 54 | 45 | 69 | 95 | 85 | 53 | 57 | 51 | 45 | 48 | 67 | 55 | 70 | 71 | 92 | 68 | 66 | 58 |
| so2 | 7.9 | 9.9 | 8.6 | 7.3 | 6.8 | 11 | 11 | 8.2 | 8.8 | 6 | 4.4 | 3.7 | 6.2 | 6.2 | 7.1 | 5.6 | 7.1 | 6.9 | 7.8 | 7.7 |
汉口花桥
| index | 2020-05 | 2020-04 | 2020-03 | 2020-02 | 2020-01 | 2019-12 | 2019-11 | 2019-10 | 2019-09 | 2019-08 | 2019-07 | 2019-06 | 2019-05 | 2019-04 | 2019-03 | 2019-02 | 2019-01 | 2018-12 | 2018-11 | 2018-10 |
|---|---|---|---|---|---|---|---|---|---|---|---|---|---|---|---|---|---|---|---|---|
| pm25 | 30 | 37 | 37 | 40 | 65 | 72 | 49 | 32 | 31 | 26 | 21 | 23 | 34 | 37 | 53 | 67 | 97 | 67 | 63 | 48 |
| co | 692 | 686 | 1 | 837 | 964 | 1 | 968 | 864 | 950 | 909 | 726 | 686 | 803 | 982 | 1 | 1 | 1 | 1 | 1 | 897 |
| no2 | 27 | 32 | 25 | 28 | 41 | 66 | 61 | 46 | 38 | 25 | 20 | 25 | 42 | 40 | 52 | 38 | 62 | 48 | 57 | 60 |
| o3 | 136 | 141 | 107 | 89 | 57 | 54 | 84 | 119 | 179 | 185 | 152 | 168 | 142 | 129 | 101 | 56 | 49 | 44 | 81 | 110 |
| pm10 | 49 | 59 | 53 | 46 | 71 | 93 | 83 | 55 | 55 | 46 | 40 | 45 | 77 | 62 | 84 | 77 | 103 | 81 | 82 | 78 |
| so2 | 7.1 | 8.2 | 7.5 | 6.1 | 5.6 | 9.1 | 9.8 | 9.3 | 12 | 5.5 | 5.1 | 6.2 | 7.9 | 7.3 | 8.3 | 5.7 | 7.3 | 5.9 | 7.7 | 11 |