Air Pollution in Xiagaonian: Real-time Air Quality Index and smog alert.
Pollution and air quality forecast for Xiagaonian. Today is Wednesday, June 3, 2026. The following air pollution values have been recorded for Xiagaonian:- particulate matter (PM2.5) dust - 61 (Unhealthy)
- nitrogen dioxide (NO2) - 22 (Good)
- particulate matter (PM10) suspended dust - 69 (Unhealthy for Sensitive Groups)
- carbon monoxide (CO) - 219 (Good)
- ozone (O3) - 0 (Good)
- sulfur dioxide (SO2) - 8 (Good)

What is the air quality in Xiagaonian today? Is the air polluted in Xiagaonian?. Is there smog?
What is the current level of PM2.5 in Xiagaonian? (particulate matter (PM2.5) dust)
Today's PM2.5 level is:
61 (Unhealthy)
For comparison, the highest level of PM2.5 in Xiagaonian in the last 7 days was: 28 (Friday, May 27, 2022) and the lowest: 28 (Friday, May 27, 2022).
The highest PM2.5 values were recorded: 97 (January 2020).
The lowest level of particulate matter PM2.5 pollution occurs in month: July (20).
How high is the level of NO2? (nitrogen dioxide (NO2))
22 (Good)
What is the level of PM10 today in Xiagaonian? (particulate matter (PM10) suspended dust)
The current level of particulate matter PM10 in Xiagaonian is:
69 (Unhealthy for Sensitive Groups)
The highest PM10 values usually occur in month: 122 (January 2019).
The lowest value of particulate matter PM10 pollution in Xiagaonian is usually recorded in: September (45).
How high is the CO level? (carbon monoxide (CO))
219 (Good)
How is the O3 level today in Xiagaonian? (ozone (O3))
0 (Good)
What is the level of SO2 pollution? (sulfur dioxide (SO2))
8 (Good)
Current data Friday, May 27, 2022, 3:00 PM
PM2,5 61 (Unhealthy)
NO2 22 (Good)
PM10 69 (Unhealthy for Sensitive Groups)
CO 219 (Good)
O3 0 (Good)
SO2 8 (Good)
Data on air pollution from recent days in Xiagaonian
index
2022-05-27
pm25
28
Moderate
no2
22
Good
pm10
35
Moderate
co
579
Good
o3
22
Good
so2
5
Good
data source »
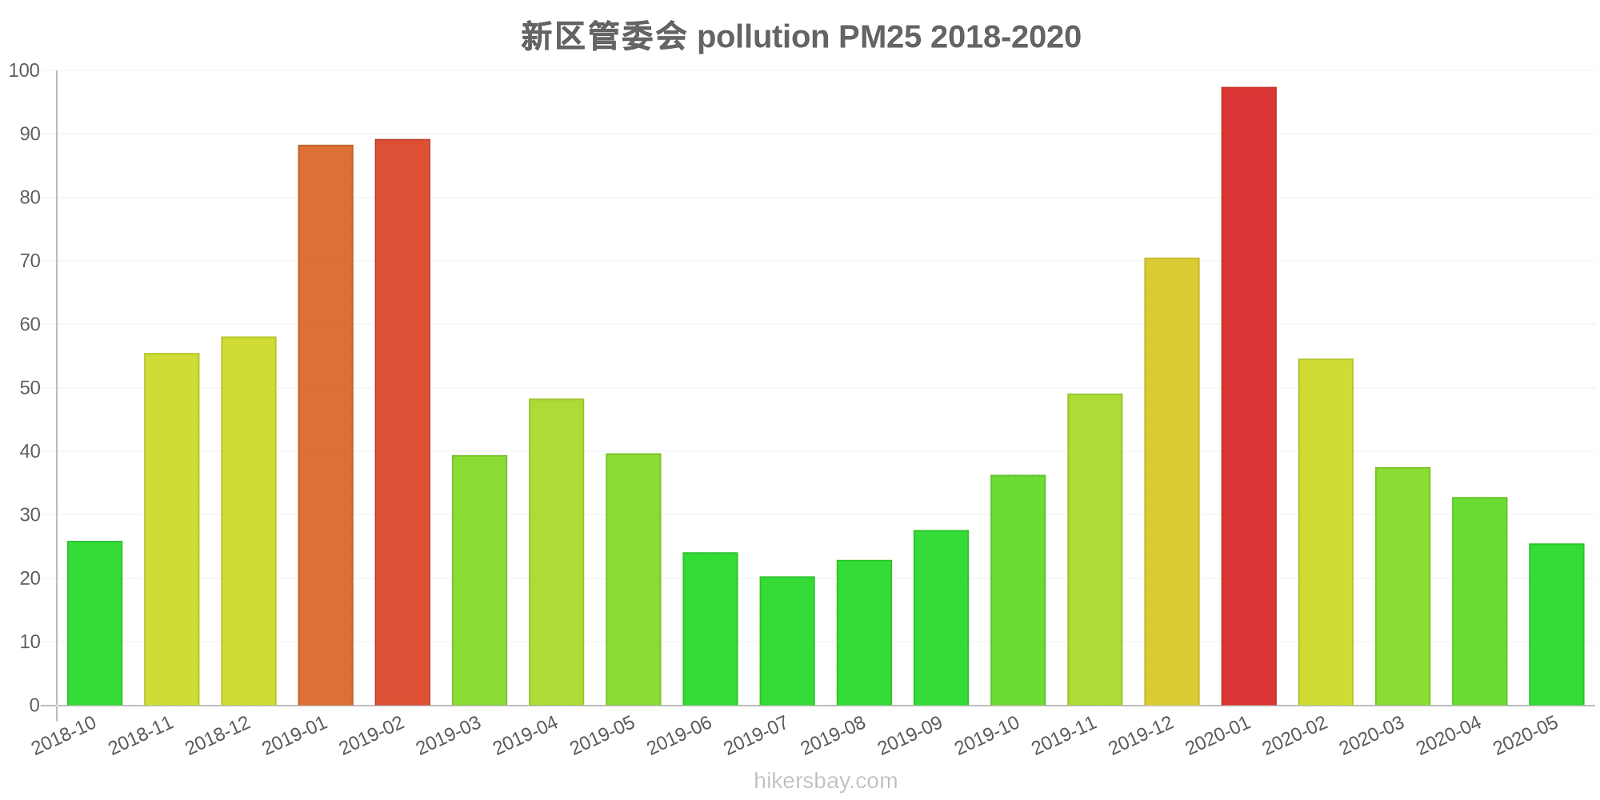
Air pollution in Xiagaonian from October 2018 to May 2020

index
2020-05
2020-04
2020-03
2020-02
2020-01
2019-12
2019-11
2019-10
2019-09
2019-08
2019-07
2019-06
2019-05
2019-04
2019-03
2019-02
2019-01
2018-12
2018-11
2018-10
pm25
26 (Moderate)
33 (Moderate)
38 (Unhealthy for Sensitive Groups)
55 (Unhealthy for Sensitive Groups)
97 (Very Unhealthy)
71 (Unhealthy)
49 (Unhealthy for Sensitive Groups)
36 (Unhealthy for Sensitive Groups)
28 (Moderate)
23 (Moderate)
20 (Moderate)
24 (Moderate)
40 (Unhealthy for Sensitive Groups)
48 (Unhealthy for Sensitive Groups)
39 (Unhealthy for Sensitive Groups)
89 (Very Unhealthy)
88 (Very Unhealthy)
58 (Unhealthy)
56 (Unhealthy)
26 (Moderate)
co
570 (Good)
602 (Good)
603 (Good)
821 (Good)
1 (Good)
958 (Good)
822 (Good)
746 (Good)
669 (Good)
714 (Good)
597 (Good)
595 (Good)
452 (Good)
755 (Good)
656 (Good)
1 (Good)
1 (Good)
1 (Good)
1 (Good)
866 (Good)
no2
22 (Good)
32 (Good)
28 (Good)
16 (Good)
32 (Good)
42 (Moderate)
42 (Moderate)
37 (Good)
25 (Good)
21 (Good)
20 (Good)
21 (Good)
27 (Good)
30 (Good)
31 (Good)
27 (Good)
49 (Moderate)
52 (Moderate)
57 (Moderate)
41 (Moderate)
o3
157 (Unhealthy)
131 (Unhealthy for Sensitive Groups)
107 (Moderate)
106 (Moderate)
77 (Moderate)
69 (Good)
72 (Moderate)
86 (Moderate)
137 (Unhealthy for Sensitive Groups)
154 (Unhealthy)
161 (Unhealthy)
161 (Unhealthy)
140 (Unhealthy for Sensitive Groups)
131 (Unhealthy for Sensitive Groups)
114 (Moderate)
99 (Moderate)
77 (Moderate)
54 (Good)
79 (Moderate)
102 (Moderate)
pm10
63 (Unhealthy for Sensitive Groups)
78 (Unhealthy for Sensitive Groups)
91 (Unhealthy)
81 (Unhealthy)
111 (Very Unhealthy)
97 (Unhealthy)
96 (Unhealthy)
75 (Unhealthy for Sensitive Groups)
45 (Moderate)
48 (Moderate)
46 (Moderate)
53 (Unhealthy for Sensitive Groups)
96 (Unhealthy)
93 (Unhealthy)
81 (Unhealthy)
115 (Very Unhealthy)
122 (Very Unhealthy)
116 (Very Unhealthy)
103 (Unhealthy)
56 (Unhealthy for Sensitive Groups)
so2
13 (Good)
12 (Good)
11 (Good)
14 (Good)
21 (Good)
23 (Good)
14 (Good)
7.5 (Good)
7.8 (Good)
5.7 (Good)
6.2 (Good)
7.8 (Good)
8.7 (Good)
9.6 (Good)
12 (Good)
18 (Good)
31 (Good)
33 (Good)
22 (Good)
15 (Good)
data source »
新区管委会
Friday, May 27, 2022, 3:00 PM
PM2,5 61 (Unhealthy)
particulate matter (PM2.5) dust
NO2 22 (Good)
nitrogen dioxide (NO2)
PM10 69 (Unhealthy for Sensitive Groups)
particulate matter (PM10) suspended dust
CO 219 (Good)
carbon monoxide (CO)
O3 0.05 (Good)
ozone (O3)
SO2 7.7 (Good)
sulfur dioxide (SO2)
新区管委会
index
2022-05-27
pm25
28
no2
22
pm10
35
co
579
o3
22
so2
4.6
新区管委会
2018-10 2020-05
index
2020-05
2020-04
2020-03
2020-02
2020-01
2019-12
2019-11
2019-10
2019-09
2019-08
2019-07
2019-06
2019-05
2019-04
2019-03
2019-02
2019-01
2018-12
2018-11
2018-10
pm25
26
33
38
55
97
71
49
36
28
23
20
24
40
48
39
89
88
58
56
26
co
570
602
603
821
1
958
822
746
669
714
597
595
452
755
656
1
1
1
1
866
no2
22
32
28
16
32
42
42
37
25
21
20
21
27
30
31
27
49
52
57
41
o3
157
131
107
106
77
69
72
86
137
154
161
161
140
131
114
99
77
54
79
102
pm10
63
78
91
81
111
97
96
75
45
48
46
53
96
93
81
115
122
116
103
56
so2
13
12
11
14
21
23
14
7.5
7.8
5.7
6.2
7.8
8.7
9.6
12
18
31
33
22
15
* Pollution data source:
https://openaq.org
(ChinaAQIData)
The data is licensed under CC-By 4.0
PM2,5 61 (Unhealthy)
NO2 22 (Good)
PM10 69 (Unhealthy for Sensitive Groups)
CO 219 (Good)
O3 0 (Good)
SO2 8 (Good)
Data on air pollution from recent days in Xiagaonian
| index | 2022-05-27 |
|---|---|
| pm25 | 28 Moderate |
| no2 | 22 Good |
| pm10 | 35 Moderate |
| co | 579 Good |
| o3 | 22 Good |
| so2 | 5 Good |

| index | 2020-05 | 2020-04 | 2020-03 | 2020-02 | 2020-01 | 2019-12 | 2019-11 | 2019-10 | 2019-09 | 2019-08 | 2019-07 | 2019-06 | 2019-05 | 2019-04 | 2019-03 | 2019-02 | 2019-01 | 2018-12 | 2018-11 | 2018-10 |
|---|---|---|---|---|---|---|---|---|---|---|---|---|---|---|---|---|---|---|---|---|
| pm25 | 26 (Moderate) | 33 (Moderate) | 38 (Unhealthy for Sensitive Groups) | 55 (Unhealthy for Sensitive Groups) | 97 (Very Unhealthy) | 71 (Unhealthy) | 49 (Unhealthy for Sensitive Groups) | 36 (Unhealthy for Sensitive Groups) | 28 (Moderate) | 23 (Moderate) | 20 (Moderate) | 24 (Moderate) | 40 (Unhealthy for Sensitive Groups) | 48 (Unhealthy for Sensitive Groups) | 39 (Unhealthy for Sensitive Groups) | 89 (Very Unhealthy) | 88 (Very Unhealthy) | 58 (Unhealthy) | 56 (Unhealthy) | 26 (Moderate) |
| co | 570 (Good) | 602 (Good) | 603 (Good) | 821 (Good) | 1 (Good) | 958 (Good) | 822 (Good) | 746 (Good) | 669 (Good) | 714 (Good) | 597 (Good) | 595 (Good) | 452 (Good) | 755 (Good) | 656 (Good) | 1 (Good) | 1 (Good) | 1 (Good) | 1 (Good) | 866 (Good) |
| no2 | 22 (Good) | 32 (Good) | 28 (Good) | 16 (Good) | 32 (Good) | 42 (Moderate) | 42 (Moderate) | 37 (Good) | 25 (Good) | 21 (Good) | 20 (Good) | 21 (Good) | 27 (Good) | 30 (Good) | 31 (Good) | 27 (Good) | 49 (Moderate) | 52 (Moderate) | 57 (Moderate) | 41 (Moderate) |
| o3 | 157 (Unhealthy) | 131 (Unhealthy for Sensitive Groups) | 107 (Moderate) | 106 (Moderate) | 77 (Moderate) | 69 (Good) | 72 (Moderate) | 86 (Moderate) | 137 (Unhealthy for Sensitive Groups) | 154 (Unhealthy) | 161 (Unhealthy) | 161 (Unhealthy) | 140 (Unhealthy for Sensitive Groups) | 131 (Unhealthy for Sensitive Groups) | 114 (Moderate) | 99 (Moderate) | 77 (Moderate) | 54 (Good) | 79 (Moderate) | 102 (Moderate) |
| pm10 | 63 (Unhealthy for Sensitive Groups) | 78 (Unhealthy for Sensitive Groups) | 91 (Unhealthy) | 81 (Unhealthy) | 111 (Very Unhealthy) | 97 (Unhealthy) | 96 (Unhealthy) | 75 (Unhealthy for Sensitive Groups) | 45 (Moderate) | 48 (Moderate) | 46 (Moderate) | 53 (Unhealthy for Sensitive Groups) | 96 (Unhealthy) | 93 (Unhealthy) | 81 (Unhealthy) | 115 (Very Unhealthy) | 122 (Very Unhealthy) | 116 (Very Unhealthy) | 103 (Unhealthy) | 56 (Unhealthy for Sensitive Groups) |
| so2 | 13 (Good) | 12 (Good) | 11 (Good) | 14 (Good) | 21 (Good) | 23 (Good) | 14 (Good) | 7.5 (Good) | 7.8 (Good) | 5.7 (Good) | 6.2 (Good) | 7.8 (Good) | 8.7 (Good) | 9.6 (Good) | 12 (Good) | 18 (Good) | 31 (Good) | 33 (Good) | 22 (Good) | 15 (Good) |
PM2,5 61 (Unhealthy)
particulate matter (PM2.5) dustNO2 22 (Good)
nitrogen dioxide (NO2)PM10 69 (Unhealthy for Sensitive Groups)
particulate matter (PM10) suspended dustCO 219 (Good)
carbon monoxide (CO)O3 0.05 (Good)
ozone (O3)SO2 7.7 (Good)
sulfur dioxide (SO2)新区管委会
| index | 2022-05-27 |
|---|---|
| pm25 | 28 |
| no2 | 22 |
| pm10 | 35 |
| co | 579 |
| o3 | 22 |
| so2 | 4.6 |
新区管委会

| index | 2020-05 | 2020-04 | 2020-03 | 2020-02 | 2020-01 | 2019-12 | 2019-11 | 2019-10 | 2019-09 | 2019-08 | 2019-07 | 2019-06 | 2019-05 | 2019-04 | 2019-03 | 2019-02 | 2019-01 | 2018-12 | 2018-11 | 2018-10 |
|---|---|---|---|---|---|---|---|---|---|---|---|---|---|---|---|---|---|---|---|---|
| pm25 | 26 | 33 | 38 | 55 | 97 | 71 | 49 | 36 | 28 | 23 | 20 | 24 | 40 | 48 | 39 | 89 | 88 | 58 | 56 | 26 |
| co | 570 | 602 | 603 | 821 | 1 | 958 | 822 | 746 | 669 | 714 | 597 | 595 | 452 | 755 | 656 | 1 | 1 | 1 | 1 | 866 |
| no2 | 22 | 32 | 28 | 16 | 32 | 42 | 42 | 37 | 25 | 21 | 20 | 21 | 27 | 30 | 31 | 27 | 49 | 52 | 57 | 41 |
| o3 | 157 | 131 | 107 | 106 | 77 | 69 | 72 | 86 | 137 | 154 | 161 | 161 | 140 | 131 | 114 | 99 | 77 | 54 | 79 | 102 |
| pm10 | 63 | 78 | 91 | 81 | 111 | 97 | 96 | 75 | 45 | 48 | 46 | 53 | 96 | 93 | 81 | 115 | 122 | 116 | 103 | 56 |
| so2 | 13 | 12 | 11 | 14 | 21 | 23 | 14 | 7.5 | 7.8 | 5.7 | 6.2 | 7.8 | 8.7 | 9.6 | 12 | 18 | 31 | 33 | 22 | 15 |