Air Pollution in Xiaodian: Real-time Air Quality Index and smog alert.
Pollution and air quality forecast for Xiaodian. Today is Tuesday, June 16, 2026. The following air pollution values have been recorded for Xiaodian:- particulate matter (PM2.5) dust - 61 (Unhealthy)
- nitrogen dioxide (NO2) - 22 (Good)
- particulate matter (PM10) suspended dust - 69 (Unhealthy for Sensitive Groups)
- carbon monoxide (CO) - 219 (Good)
- ozone (O3) - 0 (Good)
- sulfur dioxide (SO2) - 8 (Good)

What is the air quality in Xiaodian today? Is the air polluted in Xiaodian?. Is there smog?
What is the current level of PM2.5 in Xiaodian? (particulate matter (PM2.5) dust)
Today's PM2.5 level is:
61 (Unhealthy)
For comparison, the highest level of PM2.5 in Xiaodian in the last 7 days was: 28 (Friday, May 27, 2022) and the lowest: 28 (Friday, May 27, 2022).
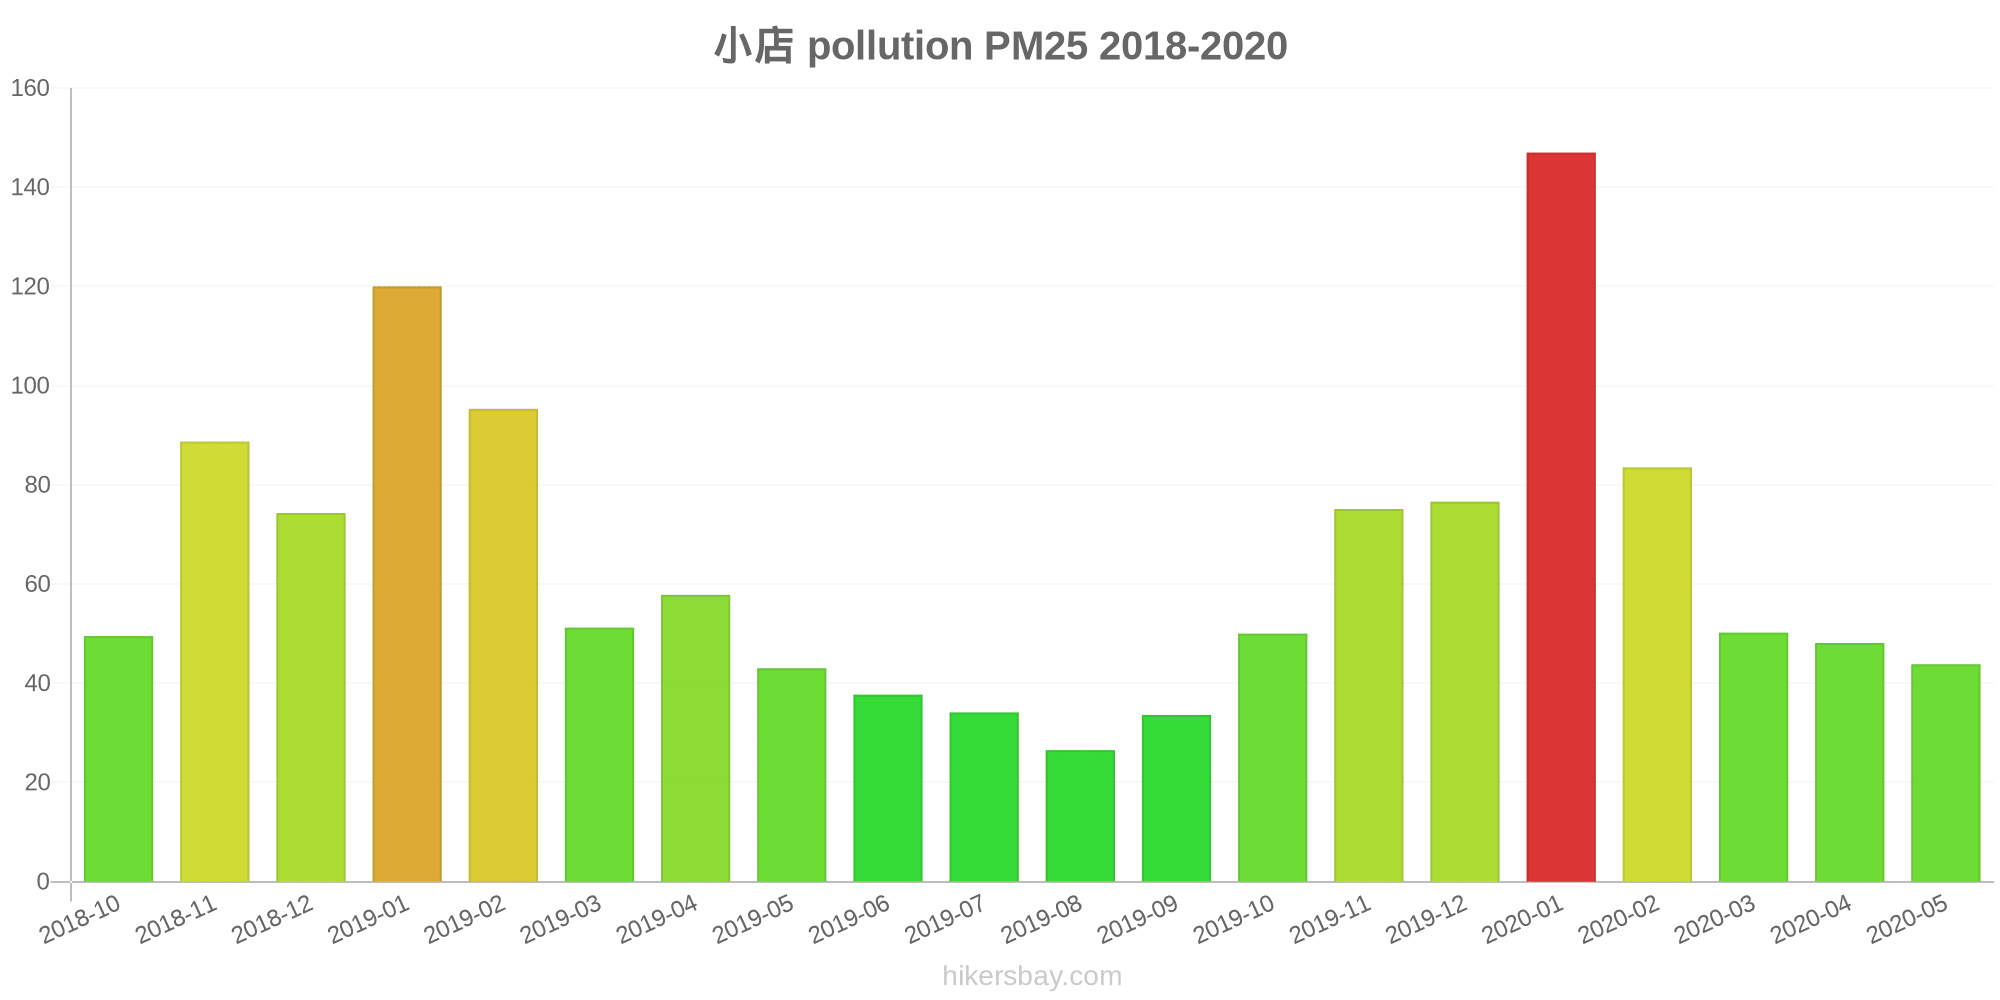
The highest PM2.5 values were recorded: 147 (January 2020).
The lowest level of particulate matter PM2.5 pollution occurs in month: August (27).
How high is the level of NO2? (nitrogen dioxide (NO2))
22 (Good)
What is the level of PM10 today in Xiaodian? (particulate matter (PM10) suspended dust)
The current level of particulate matter PM10 in Xiaodian is:
69 (Unhealthy for Sensitive Groups)
The highest PM10 values usually occur in month: 199 (January 2019).
The lowest value of particulate matter PM10 pollution in Xiaodian is usually recorded in: August (55).
How high is the CO level? (carbon monoxide (CO))
219 (Good)
How is the O3 level today in Xiaodian? (ozone (O3))
0 (Good)
What is the level of SO2 pollution? (sulfur dioxide (SO2))
8 (Good)
Current data Friday, May 27, 2022, 3:00 PM
PM2,5 61 (Unhealthy)
NO2 22 (Good)
PM10 69 (Unhealthy for Sensitive Groups)
CO 219 (Good)
O3 0 (Good)
SO2 8 (Good)
Data on air pollution from recent days in Xiaodian
index
2022-05-27
pm25
28
Moderate
no2
22
Good
pm10
35
Moderate
co
579
Good
o3
22
Good
so2
5
Good
data source »
Air pollution in Xiaodian from October 2018 to May 2020

index
2020-05
2020-04
2020-03
2020-02
2020-01
2019-12
2019-11
2019-10
2019-09
2019-08
2019-07
2019-06
2019-05
2019-04
2019-03
2019-02
2019-01
2018-12
2018-11
2018-10
pm25
44 (Unhealthy for Sensitive Groups)
48 (Unhealthy for Sensitive Groups)
50 (Unhealthy for Sensitive Groups)
84 (Very Unhealthy)
147 (Very bad Hazardous)
77 (Very Unhealthy)
75 (Very Unhealthy)
50 (Unhealthy for Sensitive Groups)
34 (Moderate)
27 (Moderate)
34 (Moderate)
38 (Unhealthy for Sensitive Groups)
43 (Unhealthy for Sensitive Groups)
58 (Unhealthy)
51 (Unhealthy for Sensitive Groups)
95 (Very Unhealthy)
120 (Very bad Hazardous)
74 (Unhealthy)
89 (Very Unhealthy)
50 (Unhealthy for Sensitive Groups)
co
795 (Good)
724 (Good)
883 (Good)
1 (Good)
1 (Good)
1 (Good)
1 (Good)
1 (Good)
946 (Good)
734 (Good)
678 (Good)
680 (Good)
766 (Good)
944 (Good)
1 (Good)
1 (Good)
2 (Good)
1 (Good)
1 (Good)
900 (Good)
no2
37 (Good)
50 (Moderate)
43 (Moderate)
40 (Moderate)
63 (Moderate)
60 (Moderate)
60 (Moderate)
51 (Moderate)
52 (Moderate)
32 (Good)
34 (Good)
34 (Good)
47 (Moderate)
48 (Moderate)
51 (Moderate)
52 (Moderate)
82 (Moderate)
63 (Moderate)
69 (Moderate)
56 (Moderate)
o3
166 (Unhealthy)
133 (Unhealthy for Sensitive Groups)
107 (Moderate)
94 (Moderate)
69 (Good)
54 (Good)
66 (Good)
102 (Moderate)
149 (Unhealthy for Sensitive Groups)
159 (Unhealthy)
207 (Very Unhealthy)
214 (Very Unhealthy)
164 (Unhealthy)
133 (Unhealthy for Sensitive Groups)
121 (Unhealthy for Sensitive Groups)
94 (Moderate)
46 (Good)
45 (Good)
69 (Good)
99 (Moderate)
pm10
96 (Unhealthy)
108 (Unhealthy)
94 (Unhealthy)
110 (Very Unhealthy)
181 (Very bad Hazardous)
113 (Very Unhealthy)
137 (Very Unhealthy)
109 (Unhealthy)
78 (Unhealthy for Sensitive Groups)
55 (Unhealthy for Sensitive Groups)
70 (Unhealthy for Sensitive Groups)
84 (Unhealthy)
142 (Very Unhealthy)
130 (Very Unhealthy)
122 (Very Unhealthy)
152 (Very bad Hazardous)
199 (Very bad Hazardous)
181 (Very bad Hazardous)
191 (Very bad Hazardous)
132 (Very Unhealthy)
so2
15 (Good)
19 (Good)
28 (Good)
39 (Good)
47 (Good)
40 (Good)
37 (Good)
23 (Good)
14 (Good)
10 (Good)
11 (Good)
16 (Good)
22 (Good)
23 (Good)
31 (Good)
52 (Moderate)
80 (Moderate)
59 (Moderate)
42 (Good)
20 (Good)
data source »
小店
Friday, May 27, 2022, 3:00 PM
PM2,5 61 (Unhealthy)
particulate matter (PM2.5) dust
NO2 22 (Good)
nitrogen dioxide (NO2)
PM10 69 (Unhealthy for Sensitive Groups)
particulate matter (PM10) suspended dust
CO 219 (Good)
carbon monoxide (CO)
O3 0.05 (Good)
ozone (O3)
SO2 7.7 (Good)
sulfur dioxide (SO2)
小店
index
2022-05-27
pm25
28
no2
22
pm10
35
co
579
o3
22
so2
4.6
小店
2018-10 2020-05

index
2020-05
2020-04
2020-03
2020-02
2020-01
2019-12
2019-11
2019-10
2019-09
2019-08
2019-07
2019-06
2019-05
2019-04
2019-03
2019-02
2019-01
2018-12
2018-11
2018-10
pm25
44
48
50
84
147
77
75
50
34
27
34
38
43
58
51
95
120
74
89
50
co
795
724
883
1
1
1
1
1
946
734
678
680
766
944
1
1
2
1
1
900
no2
37
50
43
40
63
60
60
51
52
32
34
34
47
48
51
52
82
63
69
56
o3
166
133
107
94
69
54
66
102
149
159
207
214
164
133
121
94
46
45
69
99
pm10
96
108
94
110
181
113
137
109
78
55
70
84
142
130
122
152
199
181
191
132
so2
15
19
28
39
47
40
37
23
14
10
11
16
22
23
31
52
80
59
42
20
* Pollution data source:
https://openaq.org
(ChinaAQIData)
The data is licensed under CC-By 4.0
PM2,5 61 (Unhealthy)
NO2 22 (Good)
PM10 69 (Unhealthy for Sensitive Groups)
CO 219 (Good)
O3 0 (Good)
SO2 8 (Good)
Data on air pollution from recent days in Xiaodian
| index | 2022-05-27 |
|---|---|
| pm25 | 28 Moderate |
| no2 | 22 Good |
| pm10 | 35 Moderate |
| co | 579 Good |
| o3 | 22 Good |
| so2 | 5 Good |

| index | 2020-05 | 2020-04 | 2020-03 | 2020-02 | 2020-01 | 2019-12 | 2019-11 | 2019-10 | 2019-09 | 2019-08 | 2019-07 | 2019-06 | 2019-05 | 2019-04 | 2019-03 | 2019-02 | 2019-01 | 2018-12 | 2018-11 | 2018-10 |
|---|---|---|---|---|---|---|---|---|---|---|---|---|---|---|---|---|---|---|---|---|
| pm25 | 44 (Unhealthy for Sensitive Groups) | 48 (Unhealthy for Sensitive Groups) | 50 (Unhealthy for Sensitive Groups) | 84 (Very Unhealthy) | 147 (Very bad Hazardous) | 77 (Very Unhealthy) | 75 (Very Unhealthy) | 50 (Unhealthy for Sensitive Groups) | 34 (Moderate) | 27 (Moderate) | 34 (Moderate) | 38 (Unhealthy for Sensitive Groups) | 43 (Unhealthy for Sensitive Groups) | 58 (Unhealthy) | 51 (Unhealthy for Sensitive Groups) | 95 (Very Unhealthy) | 120 (Very bad Hazardous) | 74 (Unhealthy) | 89 (Very Unhealthy) | 50 (Unhealthy for Sensitive Groups) |
| co | 795 (Good) | 724 (Good) | 883 (Good) | 1 (Good) | 1 (Good) | 1 (Good) | 1 (Good) | 1 (Good) | 946 (Good) | 734 (Good) | 678 (Good) | 680 (Good) | 766 (Good) | 944 (Good) | 1 (Good) | 1 (Good) | 2 (Good) | 1 (Good) | 1 (Good) | 900 (Good) |
| no2 | 37 (Good) | 50 (Moderate) | 43 (Moderate) | 40 (Moderate) | 63 (Moderate) | 60 (Moderate) | 60 (Moderate) | 51 (Moderate) | 52 (Moderate) | 32 (Good) | 34 (Good) | 34 (Good) | 47 (Moderate) | 48 (Moderate) | 51 (Moderate) | 52 (Moderate) | 82 (Moderate) | 63 (Moderate) | 69 (Moderate) | 56 (Moderate) |
| o3 | 166 (Unhealthy) | 133 (Unhealthy for Sensitive Groups) | 107 (Moderate) | 94 (Moderate) | 69 (Good) | 54 (Good) | 66 (Good) | 102 (Moderate) | 149 (Unhealthy for Sensitive Groups) | 159 (Unhealthy) | 207 (Very Unhealthy) | 214 (Very Unhealthy) | 164 (Unhealthy) | 133 (Unhealthy for Sensitive Groups) | 121 (Unhealthy for Sensitive Groups) | 94 (Moderate) | 46 (Good) | 45 (Good) | 69 (Good) | 99 (Moderate) |
| pm10 | 96 (Unhealthy) | 108 (Unhealthy) | 94 (Unhealthy) | 110 (Very Unhealthy) | 181 (Very bad Hazardous) | 113 (Very Unhealthy) | 137 (Very Unhealthy) | 109 (Unhealthy) | 78 (Unhealthy for Sensitive Groups) | 55 (Unhealthy for Sensitive Groups) | 70 (Unhealthy for Sensitive Groups) | 84 (Unhealthy) | 142 (Very Unhealthy) | 130 (Very Unhealthy) | 122 (Very Unhealthy) | 152 (Very bad Hazardous) | 199 (Very bad Hazardous) | 181 (Very bad Hazardous) | 191 (Very bad Hazardous) | 132 (Very Unhealthy) |
| so2 | 15 (Good) | 19 (Good) | 28 (Good) | 39 (Good) | 47 (Good) | 40 (Good) | 37 (Good) | 23 (Good) | 14 (Good) | 10 (Good) | 11 (Good) | 16 (Good) | 22 (Good) | 23 (Good) | 31 (Good) | 52 (Moderate) | 80 (Moderate) | 59 (Moderate) | 42 (Good) | 20 (Good) |
PM2,5 61 (Unhealthy)
particulate matter (PM2.5) dustNO2 22 (Good)
nitrogen dioxide (NO2)PM10 69 (Unhealthy for Sensitive Groups)
particulate matter (PM10) suspended dustCO 219 (Good)
carbon monoxide (CO)O3 0.05 (Good)
ozone (O3)SO2 7.7 (Good)
sulfur dioxide (SO2)小店
| index | 2022-05-27 |
|---|---|
| pm25 | 28 |
| no2 | 22 |
| pm10 | 35 |
| co | 579 |
| o3 | 22 |
| so2 | 4.6 |
小店
| index | 2020-05 | 2020-04 | 2020-03 | 2020-02 | 2020-01 | 2019-12 | 2019-11 | 2019-10 | 2019-09 | 2019-08 | 2019-07 | 2019-06 | 2019-05 | 2019-04 | 2019-03 | 2019-02 | 2019-01 | 2018-12 | 2018-11 | 2018-10 |
|---|---|---|---|---|---|---|---|---|---|---|---|---|---|---|---|---|---|---|---|---|
| pm25 | 44 | 48 | 50 | 84 | 147 | 77 | 75 | 50 | 34 | 27 | 34 | 38 | 43 | 58 | 51 | 95 | 120 | 74 | 89 | 50 |
| co | 795 | 724 | 883 | 1 | 1 | 1 | 1 | 1 | 946 | 734 | 678 | 680 | 766 | 944 | 1 | 1 | 2 | 1 | 1 | 900 |
| no2 | 37 | 50 | 43 | 40 | 63 | 60 | 60 | 51 | 52 | 32 | 34 | 34 | 47 | 48 | 51 | 52 | 82 | 63 | 69 | 56 |
| o3 | 166 | 133 | 107 | 94 | 69 | 54 | 66 | 102 | 149 | 159 | 207 | 214 | 164 | 133 | 121 | 94 | 46 | 45 | 69 | 99 |
| pm10 | 96 | 108 | 94 | 110 | 181 | 113 | 137 | 109 | 78 | 55 | 70 | 84 | 142 | 130 | 122 | 152 | 199 | 181 | 191 | 132 |
| so2 | 15 | 19 | 28 | 39 | 47 | 40 | 37 | 23 | 14 | 10 | 11 | 16 | 22 | 23 | 31 | 52 | 80 | 59 | 42 | 20 |