Air Pollution in Xiaoxita: Real-time Air Quality Index and smog alert.
Pollution and air quality forecast for Xiaoxita. Today is Tuesday, June 2, 2026. The following air pollution values have been recorded for Xiaoxita:- particulate matter (PM2.5) dust - 61 (Unhealthy)
- nitrogen dioxide (NO2) - 22 (Good)
- particulate matter (PM10) suspended dust - 69 (Unhealthy for Sensitive Groups)
- carbon monoxide (CO) - 219 (Good)
- ozone (O3) - 0 (Good)
- sulfur dioxide (SO2) - 8 (Good)

What is the air quality in Xiaoxita today? Is the air polluted in Xiaoxita?. Is there smog?
What is the current level of PM2.5 in Xiaoxita? (particulate matter (PM2.5) dust)
Today's PM2.5 level is:
61 (Unhealthy)
For comparison, the highest level of PM2.5 in Xiaoxita in the last 7 days was: 28 (Friday, May 27, 2022) and the lowest: 28 (Friday, May 27, 2022).
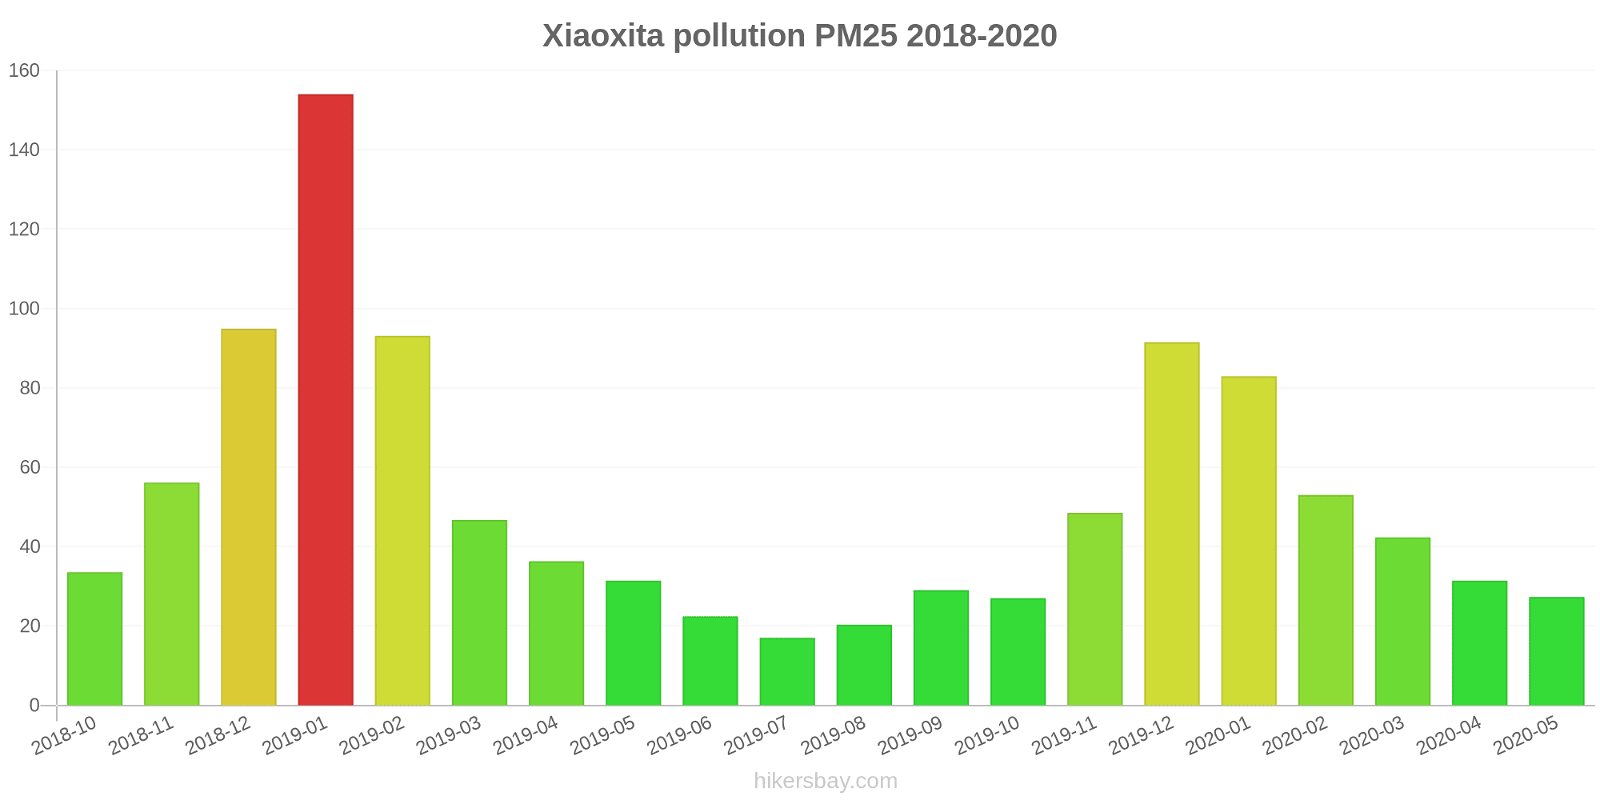
The highest PM2.5 values were recorded: 154 (January 2019).
The lowest level of particulate matter PM2.5 pollution occurs in month: July (17).
How high is the level of NO2? (nitrogen dioxide (NO2))
22 (Good)
What is the level of PM10 today in Xiaoxita? (particulate matter (PM10) suspended dust)
The current level of particulate matter PM10 in Xiaoxita is:
69 (Unhealthy for Sensitive Groups)
The highest PM10 values usually occur in month: 134 (January 2019).
The lowest value of particulate matter PM10 pollution in Xiaoxita is usually recorded in: August (47).
How high is the CO level? (carbon monoxide (CO))
219 (Good)
How is the O3 level today in Xiaoxita? (ozone (O3))
0 (Good)
What is the level of SO2 pollution? (sulfur dioxide (SO2))
8 (Good)
Current data Friday, May 27, 2022, 3:00 PM
PM2,5 61 (Unhealthy)
NO2 22 (Good)
PM10 69 (Unhealthy for Sensitive Groups)
CO 219 (Good)
O3 0 (Good)
SO2 8 (Good)
Data on air pollution from recent days in Xiaoxita
index
2022-05-27
pm25
28
Moderate
no2
22
Good
pm10
35
Moderate
co
579
Good
o3
22
Good
so2
5
Good
data source »
Air pollution in Xiaoxita from October 2018 to May 2020
index
2020-05
2020-04
2020-03
2020-02
2020-01
2019-12
2019-11
2019-10
2019-09
2019-08
2019-07
2019-06
2019-05
2019-04
2019-03
2019-02
2019-01
2018-12
2018-11
2018-10
pm25
27 (Moderate)
31 (Moderate)
42 (Unhealthy for Sensitive Groups)
53 (Unhealthy for Sensitive Groups)
83 (Very Unhealthy)
92 (Very Unhealthy)
49 (Unhealthy for Sensitive Groups)
27 (Moderate)
29 (Moderate)
20 (Moderate)
17 (Moderate)
22 (Moderate)
31 (Moderate)
36 (Unhealthy for Sensitive Groups)
47 (Unhealthy for Sensitive Groups)
93 (Very Unhealthy)
154 (Very bad Hazardous)
95 (Very Unhealthy)
56 (Unhealthy)
34 (Moderate)
co
663 (Good)
585 (Good)
607 (Good)
699 (Good)
1 (Good)
1 (Good)
742 (Good)
612 (Good)
612 (Good)
580 (Good)
524 (Good)
583 (Good)
568 (Good)
682 (Good)
698 (Good)
1 (Good)
1 (Good)
1 (Good)
1 (Good)
816 (Good)
no2
21 (Good)
27 (Good)
18 (Good)
13 (Good)
29 (Good)
43 (Moderate)
39 (Good)
28 (Good)
23 (Good)
18 (Good)
20 (Good)
24 (Good)
27 (Good)
30 (Good)
36 (Good)
28 (Good)
46 (Moderate)
41 (Moderate)
39 (Good)
35 (Good)
o3
124 (Unhealthy for Sensitive Groups)
118 (Moderate)
98 (Moderate)
83 (Moderate)
59 (Good)
59 (Good)
83 (Moderate)
102 (Moderate)
165 (Unhealthy)
164 (Unhealthy)
153 (Unhealthy)
139 (Unhealthy for Sensitive Groups)
121 (Unhealthy for Sensitive Groups)
109 (Moderate)
91 (Moderate)
60 (Good)
41 (Good)
40 (Good)
70 (Good)
99 (Moderate)
pm10
49 (Moderate)
54 (Unhealthy for Sensitive Groups)
63 (Unhealthy for Sensitive Groups)
54 (Unhealthy for Sensitive Groups)
73 (Unhealthy for Sensitive Groups)
100 (Unhealthy)
81 (Unhealthy)
49 (Moderate)
58 (Unhealthy for Sensitive Groups)
47 (Moderate)
51 (Unhealthy for Sensitive Groups)
51 (Unhealthy for Sensitive Groups)
74 (Unhealthy for Sensitive Groups)
61 (Unhealthy for Sensitive Groups)
75 (Unhealthy for Sensitive Groups)
89 (Unhealthy)
134 (Very Unhealthy)
126 (Very Unhealthy)
81 (Unhealthy)
67 (Unhealthy for Sensitive Groups)
so2
4.6 (Good)
5.2 (Good)
7.5 (Good)
7.3 (Good)
7.9 (Good)
8.4 (Good)
7.8 (Good)
6.6 (Good)
6.2 (Good)
5.9 (Good)
6.6 (Good)
6.8 (Good)
8.6 (Good)
8.3 (Good)
8.8 (Good)
9.2 (Good)
12 (Good)
11 (Good)
9.9 (Good)
9.2 (Good)
data source »
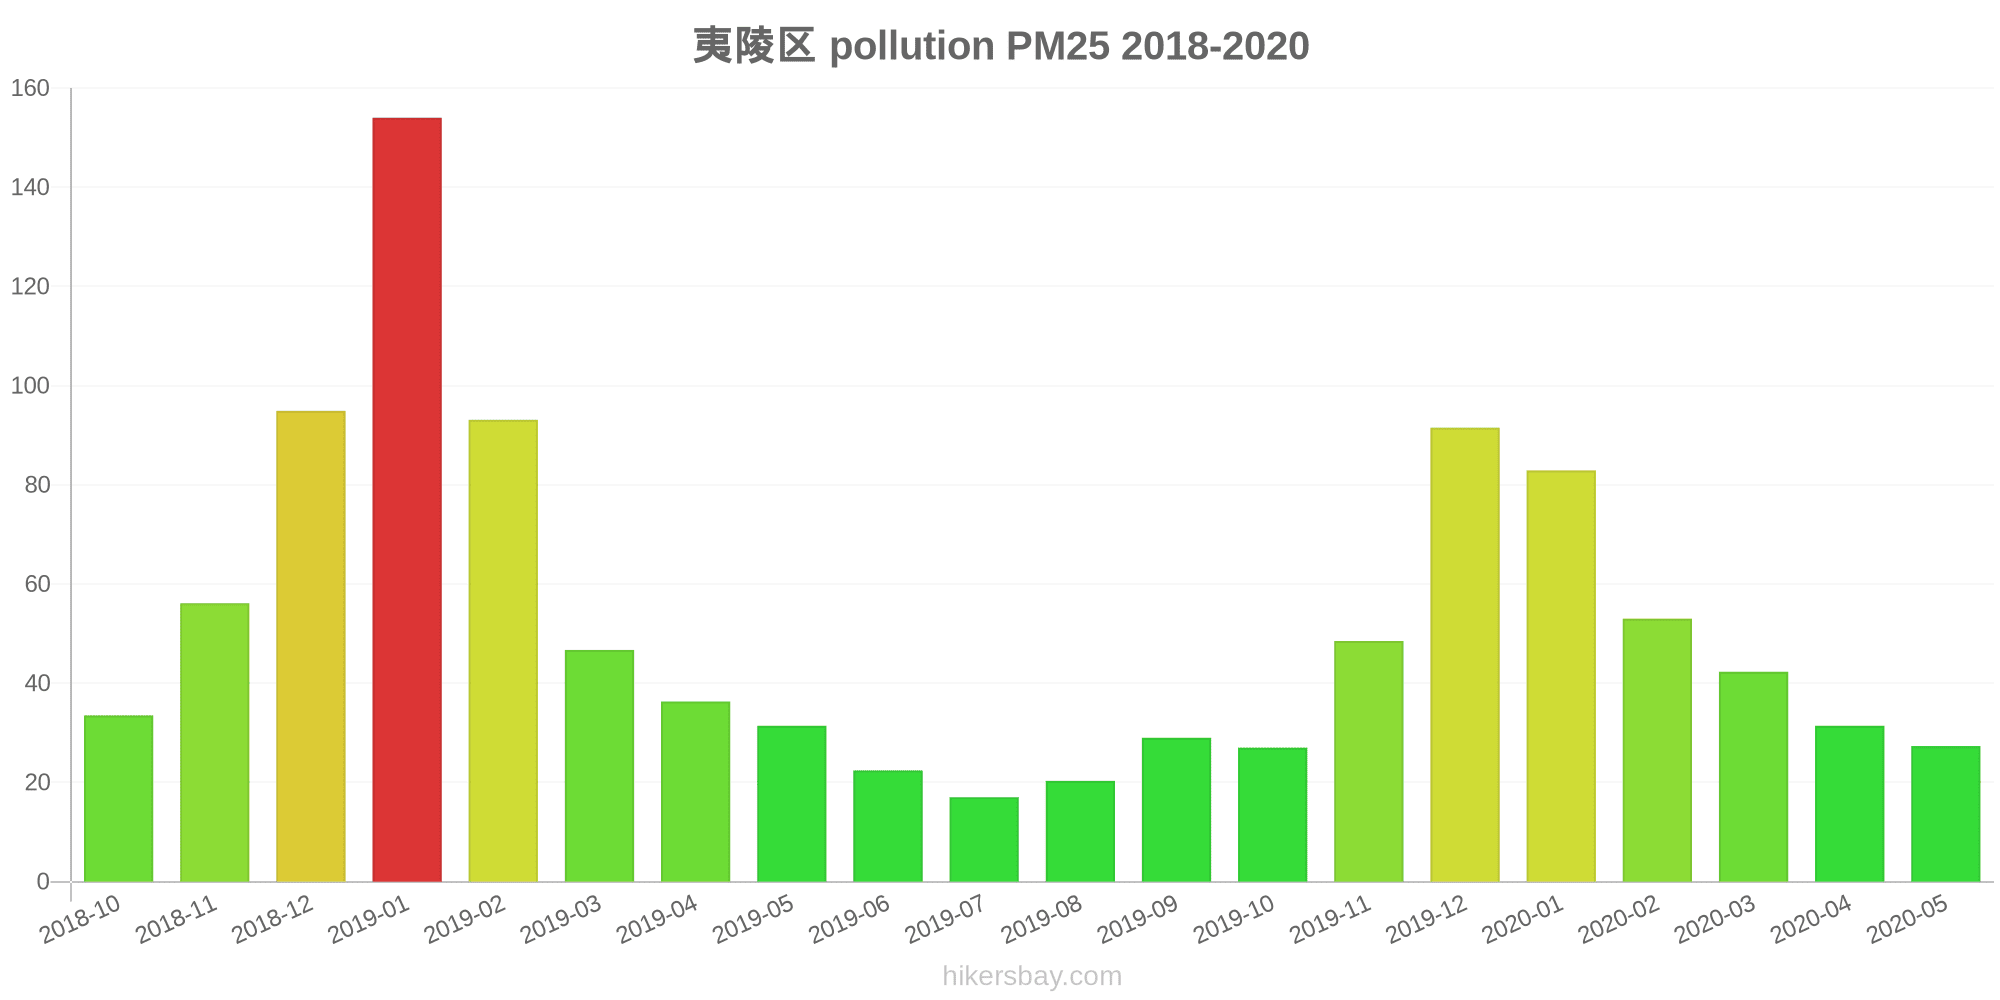
夷陵区
Friday, May 27, 2022, 3:00 PM
PM2,5 61 (Unhealthy)
particulate matter (PM2.5) dust
NO2 22 (Good)
nitrogen dioxide (NO2)
PM10 69 (Unhealthy for Sensitive Groups)
particulate matter (PM10) suspended dust
CO 219 (Good)
carbon monoxide (CO)
O3 0.05 (Good)
ozone (O3)
SO2 7.7 (Good)
sulfur dioxide (SO2)
夷陵区
index
2022-05-27
pm25
28
no2
22
pm10
35
co
579
o3
22
so2
4.6
夷陵区
2018-10 2020-05

index
2020-05
2020-04
2020-03
2020-02
2020-01
2019-12
2019-11
2019-10
2019-09
2019-08
2019-07
2019-06
2019-05
2019-04
2019-03
2019-02
2019-01
2018-12
2018-11
2018-10
pm25
27
31
42
53
83
92
49
27
29
20
17
22
31
36
47
93
154
95
56
34
co
663
585
607
699
1
1
742
612
612
580
524
583
568
682
698
1
1
1
1
816
no2
21
27
18
13
29
43
39
28
23
18
20
24
27
30
36
28
46
41
39
35
o3
124
118
98
83
59
59
83
102
165
164
153
139
121
109
91
60
41
40
70
99
pm10
49
54
63
54
73
100
81
49
58
47
51
51
74
61
75
89
134
126
81
67
so2
4.6
5.2
7.5
7.3
7.9
8.4
7.8
6.6
6.2
5.9
6.6
6.8
8.6
8.3
8.8
9.2
12
11
9.9
9.2
* Pollution data source:
https://openaq.org
(ChinaAQIData)
The data is licensed under CC-By 4.0
PM2,5 61 (Unhealthy)
NO2 22 (Good)
PM10 69 (Unhealthy for Sensitive Groups)
CO 219 (Good)
O3 0 (Good)
SO2 8 (Good)
Data on air pollution from recent days in Xiaoxita
| index | 2022-05-27 |
|---|---|
| pm25 | 28 Moderate |
| no2 | 22 Good |
| pm10 | 35 Moderate |
| co | 579 Good |
| o3 | 22 Good |
| so2 | 5 Good |

| index | 2020-05 | 2020-04 | 2020-03 | 2020-02 | 2020-01 | 2019-12 | 2019-11 | 2019-10 | 2019-09 | 2019-08 | 2019-07 | 2019-06 | 2019-05 | 2019-04 | 2019-03 | 2019-02 | 2019-01 | 2018-12 | 2018-11 | 2018-10 |
|---|---|---|---|---|---|---|---|---|---|---|---|---|---|---|---|---|---|---|---|---|
| pm25 | 27 (Moderate) | 31 (Moderate) | 42 (Unhealthy for Sensitive Groups) | 53 (Unhealthy for Sensitive Groups) | 83 (Very Unhealthy) | 92 (Very Unhealthy) | 49 (Unhealthy for Sensitive Groups) | 27 (Moderate) | 29 (Moderate) | 20 (Moderate) | 17 (Moderate) | 22 (Moderate) | 31 (Moderate) | 36 (Unhealthy for Sensitive Groups) | 47 (Unhealthy for Sensitive Groups) | 93 (Very Unhealthy) | 154 (Very bad Hazardous) | 95 (Very Unhealthy) | 56 (Unhealthy) | 34 (Moderate) |
| co | 663 (Good) | 585 (Good) | 607 (Good) | 699 (Good) | 1 (Good) | 1 (Good) | 742 (Good) | 612 (Good) | 612 (Good) | 580 (Good) | 524 (Good) | 583 (Good) | 568 (Good) | 682 (Good) | 698 (Good) | 1 (Good) | 1 (Good) | 1 (Good) | 1 (Good) | 816 (Good) |
| no2 | 21 (Good) | 27 (Good) | 18 (Good) | 13 (Good) | 29 (Good) | 43 (Moderate) | 39 (Good) | 28 (Good) | 23 (Good) | 18 (Good) | 20 (Good) | 24 (Good) | 27 (Good) | 30 (Good) | 36 (Good) | 28 (Good) | 46 (Moderate) | 41 (Moderate) | 39 (Good) | 35 (Good) |
| o3 | 124 (Unhealthy for Sensitive Groups) | 118 (Moderate) | 98 (Moderate) | 83 (Moderate) | 59 (Good) | 59 (Good) | 83 (Moderate) | 102 (Moderate) | 165 (Unhealthy) | 164 (Unhealthy) | 153 (Unhealthy) | 139 (Unhealthy for Sensitive Groups) | 121 (Unhealthy for Sensitive Groups) | 109 (Moderate) | 91 (Moderate) | 60 (Good) | 41 (Good) | 40 (Good) | 70 (Good) | 99 (Moderate) |
| pm10 | 49 (Moderate) | 54 (Unhealthy for Sensitive Groups) | 63 (Unhealthy for Sensitive Groups) | 54 (Unhealthy for Sensitive Groups) | 73 (Unhealthy for Sensitive Groups) | 100 (Unhealthy) | 81 (Unhealthy) | 49 (Moderate) | 58 (Unhealthy for Sensitive Groups) | 47 (Moderate) | 51 (Unhealthy for Sensitive Groups) | 51 (Unhealthy for Sensitive Groups) | 74 (Unhealthy for Sensitive Groups) | 61 (Unhealthy for Sensitive Groups) | 75 (Unhealthy for Sensitive Groups) | 89 (Unhealthy) | 134 (Very Unhealthy) | 126 (Very Unhealthy) | 81 (Unhealthy) | 67 (Unhealthy for Sensitive Groups) |
| so2 | 4.6 (Good) | 5.2 (Good) | 7.5 (Good) | 7.3 (Good) | 7.9 (Good) | 8.4 (Good) | 7.8 (Good) | 6.6 (Good) | 6.2 (Good) | 5.9 (Good) | 6.6 (Good) | 6.8 (Good) | 8.6 (Good) | 8.3 (Good) | 8.8 (Good) | 9.2 (Good) | 12 (Good) | 11 (Good) | 9.9 (Good) | 9.2 (Good) |
PM2,5 61 (Unhealthy)
particulate matter (PM2.5) dustNO2 22 (Good)
nitrogen dioxide (NO2)PM10 69 (Unhealthy for Sensitive Groups)
particulate matter (PM10) suspended dustCO 219 (Good)
carbon monoxide (CO)O3 0.05 (Good)
ozone (O3)SO2 7.7 (Good)
sulfur dioxide (SO2)夷陵区
| index | 2022-05-27 |
|---|---|
| pm25 | 28 |
| no2 | 22 |
| pm10 | 35 |
| co | 579 |
| o3 | 22 |
| so2 | 4.6 |
夷陵区
| index | 2020-05 | 2020-04 | 2020-03 | 2020-02 | 2020-01 | 2019-12 | 2019-11 | 2019-10 | 2019-09 | 2019-08 | 2019-07 | 2019-06 | 2019-05 | 2019-04 | 2019-03 | 2019-02 | 2019-01 | 2018-12 | 2018-11 | 2018-10 |
|---|---|---|---|---|---|---|---|---|---|---|---|---|---|---|---|---|---|---|---|---|
| pm25 | 27 | 31 | 42 | 53 | 83 | 92 | 49 | 27 | 29 | 20 | 17 | 22 | 31 | 36 | 47 | 93 | 154 | 95 | 56 | 34 |
| co | 663 | 585 | 607 | 699 | 1 | 1 | 742 | 612 | 612 | 580 | 524 | 583 | 568 | 682 | 698 | 1 | 1 | 1 | 1 | 816 |
| no2 | 21 | 27 | 18 | 13 | 29 | 43 | 39 | 28 | 23 | 18 | 20 | 24 | 27 | 30 | 36 | 28 | 46 | 41 | 39 | 35 |
| o3 | 124 | 118 | 98 | 83 | 59 | 59 | 83 | 102 | 165 | 164 | 153 | 139 | 121 | 109 | 91 | 60 | 41 | 40 | 70 | 99 |
| pm10 | 49 | 54 | 63 | 54 | 73 | 100 | 81 | 49 | 58 | 47 | 51 | 51 | 74 | 61 | 75 | 89 | 134 | 126 | 81 | 67 |
| so2 | 4.6 | 5.2 | 7.5 | 7.3 | 7.9 | 8.4 | 7.8 | 6.6 | 6.2 | 5.9 | 6.6 | 6.8 | 8.6 | 8.3 | 8.8 | 9.2 | 12 | 11 | 9.9 | 9.2 |