Air Pollution in Xinxiang Shi: Real-time Air Quality Index and smog alert.
Pollution and air quality forecast for Xinxiang Shi. Today is Tuesday, June 2, 2026. The following air pollution values have been recorded for Xinxiang Shi:- particulate matter (PM2.5) dust - 61 (Unhealthy)
- nitrogen dioxide (NO2) - 22 (Good)
- particulate matter (PM10) suspended dust - 69 (Unhealthy for Sensitive Groups)
- carbon monoxide (CO) - 219 (Good)
- ozone (O3) - 0 (Good)
- sulfur dioxide (SO2) - 8 (Good)

What is the air quality in Xinxiang Shi today? Is the air polluted in Xinxiang Shi?. Is there smog?
What is the current level of PM2.5 in Xinxiang Shi? (particulate matter (PM2.5) dust)
Today's PM2.5 level is:
61 (Unhealthy)
For comparison, the highest level of PM2.5 in Xinxiang Shi in the last 7 days was: 28 (Friday, May 27, 2022) and the lowest: 28 (Friday, May 27, 2022).
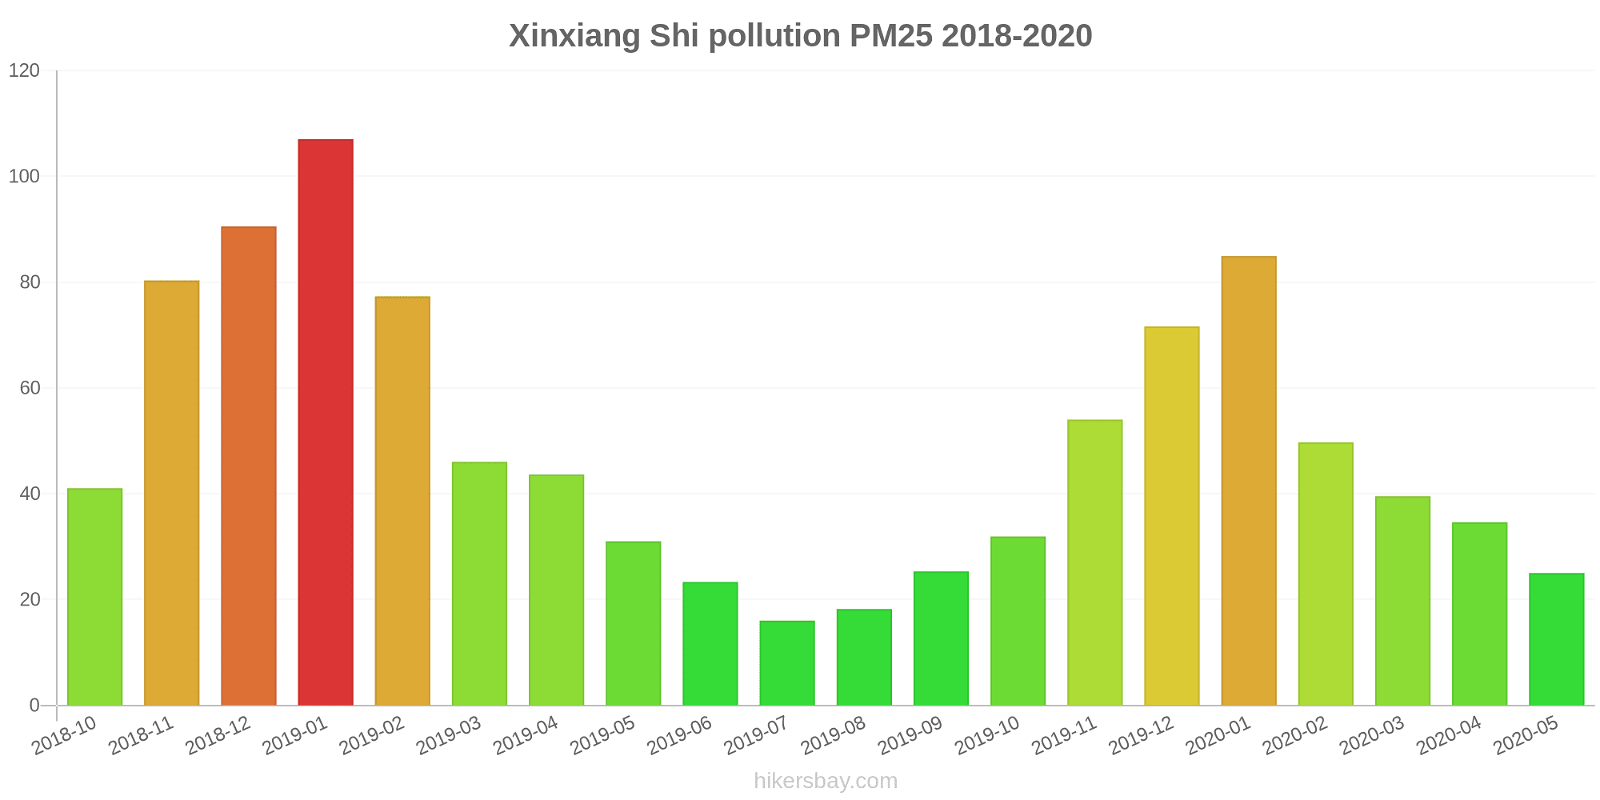
The highest PM2.5 values were recorded: 107 (January 2019).
The lowest level of particulate matter PM2.5 pollution occurs in month: July (16).
How high is the level of NO2? (nitrogen dioxide (NO2))
22 (Good)
What is the level of PM10 today in Xinxiang Shi? (particulate matter (PM10) suspended dust)
The current level of particulate matter PM10 in Xinxiang Shi is:
69 (Unhealthy for Sensitive Groups)
The highest PM10 values usually occur in month: 143 (January 2019).
The lowest value of particulate matter PM10 pollution in Xinxiang Shi is usually recorded in: July (31).
How high is the CO level? (carbon monoxide (CO))
219 (Good)
How is the O3 level today in Xinxiang Shi? (ozone (O3))
0 (Good)
What is the level of SO2 pollution? (sulfur dioxide (SO2))
8 (Good)
Current data Friday, May 27, 2022, 3:00 PM
PM2,5 61 (Unhealthy)
NO2 22 (Good)
PM10 69 (Unhealthy for Sensitive Groups)
CO 219 (Good)
O3 0 (Good)
SO2 8 (Good)
Data on air pollution from recent days in Xinxiang Shi
index
2022-05-27
pm25
28
Moderate
no2
22
Good
pm10
35
Moderate
co
579
Good
o3
22
Good
so2
5
Good
data source »
Air pollution in Xinxiang Shi from October 2018 to May 2020
index
2020-05
2020-04
2020-03
2020-02
2020-01
2019-12
2019-11
2019-10
2019-09
2019-08
2019-07
2019-06
2019-05
2019-04
2019-03
2019-02
2019-01
2018-12
2018-11
2018-10
pm25
25 (Moderate)
35 (Moderate)
40 (Unhealthy for Sensitive Groups)
50 (Unhealthy for Sensitive Groups)
85 (Very Unhealthy)
72 (Unhealthy)
54 (Unhealthy for Sensitive Groups)
32 (Moderate)
25 (Moderate)
18 (Moderate)
16 (Moderate)
23 (Moderate)
31 (Moderate)
44 (Unhealthy for Sensitive Groups)
46 (Unhealthy for Sensitive Groups)
77 (Very Unhealthy)
107 (Very Unhealthy)
91 (Very Unhealthy)
80 (Very Unhealthy)
41 (Unhealthy for Sensitive Groups)
co
723 (Good)
681 (Good)
692 (Good)
744 (Good)
1 (Good)
964 (Good)
614 (Good)
365 (Good)
288 (Good)
345 (Good)
429 (Good)
598 (Good)
550 (Good)
660 (Good)
635 (Good)
913 (Good)
1 (Good)
1 (Good)
1 (Good)
658 (Good)
no2
14 (Good)
23 (Good)
19 (Good)
13 (Good)
35 (Good)
43 (Moderate)
39 (Good)
30 (Good)
25 (Good)
17 (Good)
13 (Good)
13 (Good)
19 (Good)
24 (Good)
26 (Good)
25 (Good)
42 (Moderate)
47 (Moderate)
41 (Moderate)
38 (Good)
o3
133 (Unhealthy for Sensitive Groups)
142 (Unhealthy for Sensitive Groups)
114 (Moderate)
95 (Moderate)
74 (Moderate)
68 (Good)
109 (Moderate)
119 (Moderate)
172 (Unhealthy)
159 (Unhealthy)
152 (Unhealthy)
166 (Unhealthy)
147 (Unhealthy for Sensitive Groups)
133 (Unhealthy for Sensitive Groups)
125 (Unhealthy for Sensitive Groups)
84 (Moderate)
70 (Good)
52 (Good)
95 (Moderate)
129 (Unhealthy for Sensitive Groups)
pm10
47 (Moderate)
59 (Unhealthy for Sensitive Groups)
67 (Unhealthy for Sensitive Groups)
63 (Unhealthy for Sensitive Groups)
104 (Unhealthy)
99 (Unhealthy)
87 (Unhealthy)
54 (Unhealthy for Sensitive Groups)
46 (Moderate)
35 (Moderate)
31 (Moderate)
40 (Moderate)
66 (Unhealthy for Sensitive Groups)
69 (Unhealthy for Sensitive Groups)
80 (Unhealthy)
103 (Unhealthy)
143 (Very Unhealthy)
137 (Very Unhealthy)
122 (Very Unhealthy)
70 (Unhealthy for Sensitive Groups)
so2
8.4 (Good)
8.1 (Good)
7 (Good)
6.1 (Good)
6 (Good)
7.4 (Good)
8 (Good)
5.7 (Good)
5.9 (Good)
6.7 (Good)
7.1 (Good)
6.7 (Good)
7.1 (Good)
7.3 (Good)
7 (Good)
4.6 (Good)
5.9 (Good)
6.9 (Good)
6 (Good)
6.1 (Good)
data source »
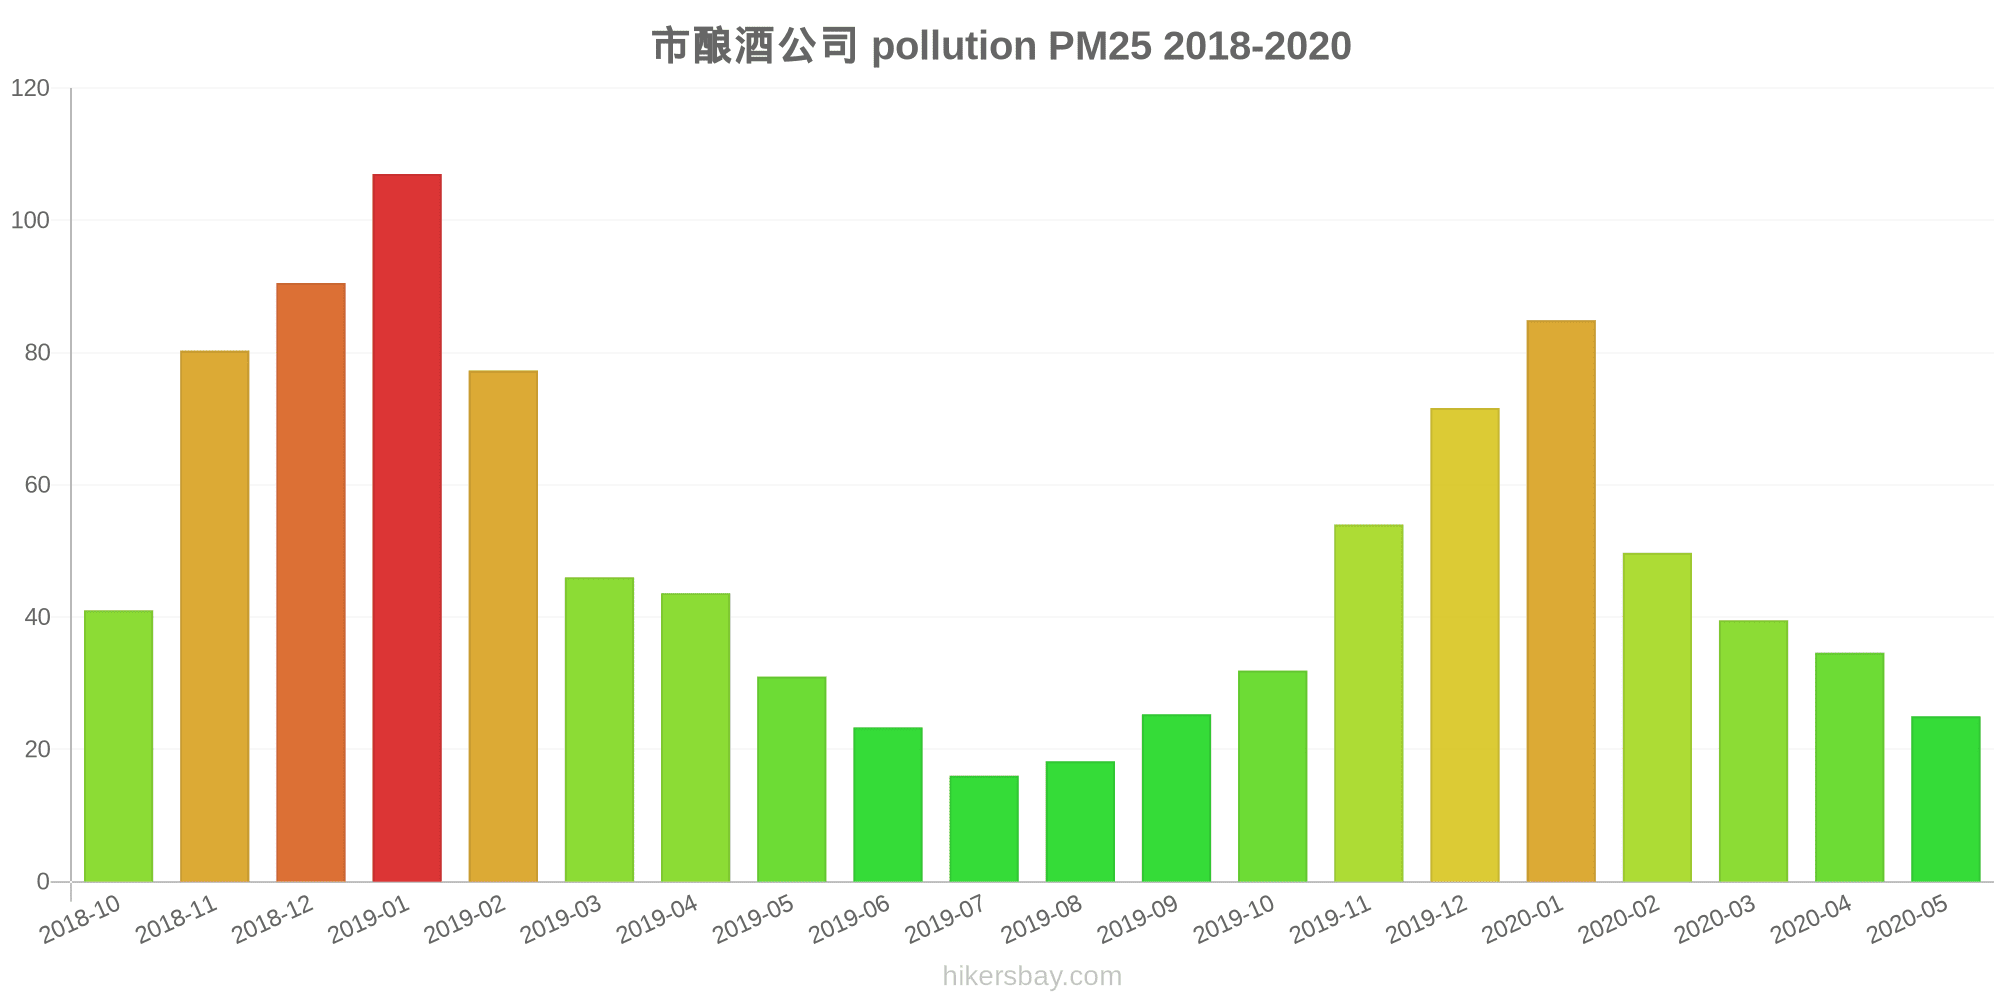
市酿酒公司
Friday, May 27, 2022, 3:00 PM
PM2,5 61 (Unhealthy)
particulate matter (PM2.5) dust
NO2 22 (Good)
nitrogen dioxide (NO2)
PM10 69 (Unhealthy for Sensitive Groups)
particulate matter (PM10) suspended dust
CO 219 (Good)
carbon monoxide (CO)
O3 0.05 (Good)
ozone (O3)
SO2 7.7 (Good)
sulfur dioxide (SO2)
市酿酒公司
index
2022-05-27
pm25
28
no2
22
pm10
35
co
579
o3
22
so2
4.6
市酿酒公司
2018-10 2020-05

index
2020-05
2020-04
2020-03
2020-02
2020-01
2019-12
2019-11
2019-10
2019-09
2019-08
2019-07
2019-06
2019-05
2019-04
2019-03
2019-02
2019-01
2018-12
2018-11
2018-10
pm25
25
35
40
50
85
72
54
32
25
18
16
23
31
44
46
77
107
91
80
41
co
723
681
692
744
1
964
614
365
288
345
429
598
550
660
635
913
1
1
1
658
no2
14
23
19
13
35
43
39
30
25
17
13
13
19
24
26
25
42
47
41
38
o3
133
142
114
95
74
68
109
119
172
159
152
166
147
133
125
84
70
52
95
129
pm10
47
59
67
63
104
99
87
54
46
35
31
40
66
69
80
103
143
137
122
70
so2
8.4
8.1
7
6.1
6
7.4
8
5.7
5.9
6.7
7.1
6.7
7.1
7.3
7
4.6
5.9
6.9
6
6.1
* Pollution data source:
https://openaq.org
(ChinaAQIData)
The data is licensed under CC-By 4.0
PM2,5 61 (Unhealthy)
NO2 22 (Good)
PM10 69 (Unhealthy for Sensitive Groups)
CO 219 (Good)
O3 0 (Good)
SO2 8 (Good)
Data on air pollution from recent days in Xinxiang Shi
| index | 2022-05-27 |
|---|---|
| pm25 | 28 Moderate |
| no2 | 22 Good |
| pm10 | 35 Moderate |
| co | 579 Good |
| o3 | 22 Good |
| so2 | 5 Good |

| index | 2020-05 | 2020-04 | 2020-03 | 2020-02 | 2020-01 | 2019-12 | 2019-11 | 2019-10 | 2019-09 | 2019-08 | 2019-07 | 2019-06 | 2019-05 | 2019-04 | 2019-03 | 2019-02 | 2019-01 | 2018-12 | 2018-11 | 2018-10 |
|---|---|---|---|---|---|---|---|---|---|---|---|---|---|---|---|---|---|---|---|---|
| pm25 | 25 (Moderate) | 35 (Moderate) | 40 (Unhealthy for Sensitive Groups) | 50 (Unhealthy for Sensitive Groups) | 85 (Very Unhealthy) | 72 (Unhealthy) | 54 (Unhealthy for Sensitive Groups) | 32 (Moderate) | 25 (Moderate) | 18 (Moderate) | 16 (Moderate) | 23 (Moderate) | 31 (Moderate) | 44 (Unhealthy for Sensitive Groups) | 46 (Unhealthy for Sensitive Groups) | 77 (Very Unhealthy) | 107 (Very Unhealthy) | 91 (Very Unhealthy) | 80 (Very Unhealthy) | 41 (Unhealthy for Sensitive Groups) |
| co | 723 (Good) | 681 (Good) | 692 (Good) | 744 (Good) | 1 (Good) | 964 (Good) | 614 (Good) | 365 (Good) | 288 (Good) | 345 (Good) | 429 (Good) | 598 (Good) | 550 (Good) | 660 (Good) | 635 (Good) | 913 (Good) | 1 (Good) | 1 (Good) | 1 (Good) | 658 (Good) |
| no2 | 14 (Good) | 23 (Good) | 19 (Good) | 13 (Good) | 35 (Good) | 43 (Moderate) | 39 (Good) | 30 (Good) | 25 (Good) | 17 (Good) | 13 (Good) | 13 (Good) | 19 (Good) | 24 (Good) | 26 (Good) | 25 (Good) | 42 (Moderate) | 47 (Moderate) | 41 (Moderate) | 38 (Good) |
| o3 | 133 (Unhealthy for Sensitive Groups) | 142 (Unhealthy for Sensitive Groups) | 114 (Moderate) | 95 (Moderate) | 74 (Moderate) | 68 (Good) | 109 (Moderate) | 119 (Moderate) | 172 (Unhealthy) | 159 (Unhealthy) | 152 (Unhealthy) | 166 (Unhealthy) | 147 (Unhealthy for Sensitive Groups) | 133 (Unhealthy for Sensitive Groups) | 125 (Unhealthy for Sensitive Groups) | 84 (Moderate) | 70 (Good) | 52 (Good) | 95 (Moderate) | 129 (Unhealthy for Sensitive Groups) |
| pm10 | 47 (Moderate) | 59 (Unhealthy for Sensitive Groups) | 67 (Unhealthy for Sensitive Groups) | 63 (Unhealthy for Sensitive Groups) | 104 (Unhealthy) | 99 (Unhealthy) | 87 (Unhealthy) | 54 (Unhealthy for Sensitive Groups) | 46 (Moderate) | 35 (Moderate) | 31 (Moderate) | 40 (Moderate) | 66 (Unhealthy for Sensitive Groups) | 69 (Unhealthy for Sensitive Groups) | 80 (Unhealthy) | 103 (Unhealthy) | 143 (Very Unhealthy) | 137 (Very Unhealthy) | 122 (Very Unhealthy) | 70 (Unhealthy for Sensitive Groups) |
| so2 | 8.4 (Good) | 8.1 (Good) | 7 (Good) | 6.1 (Good) | 6 (Good) | 7.4 (Good) | 8 (Good) | 5.7 (Good) | 5.9 (Good) | 6.7 (Good) | 7.1 (Good) | 6.7 (Good) | 7.1 (Good) | 7.3 (Good) | 7 (Good) | 4.6 (Good) | 5.9 (Good) | 6.9 (Good) | 6 (Good) | 6.1 (Good) |
PM2,5 61 (Unhealthy)
particulate matter (PM2.5) dustNO2 22 (Good)
nitrogen dioxide (NO2)PM10 69 (Unhealthy for Sensitive Groups)
particulate matter (PM10) suspended dustCO 219 (Good)
carbon monoxide (CO)O3 0.05 (Good)
ozone (O3)SO2 7.7 (Good)
sulfur dioxide (SO2)市酿酒公司
| index | 2022-05-27 |
|---|---|
| pm25 | 28 |
| no2 | 22 |
| pm10 | 35 |
| co | 579 |
| o3 | 22 |
| so2 | 4.6 |
市酿酒公司
| index | 2020-05 | 2020-04 | 2020-03 | 2020-02 | 2020-01 | 2019-12 | 2019-11 | 2019-10 | 2019-09 | 2019-08 | 2019-07 | 2019-06 | 2019-05 | 2019-04 | 2019-03 | 2019-02 | 2019-01 | 2018-12 | 2018-11 | 2018-10 |
|---|---|---|---|---|---|---|---|---|---|---|---|---|---|---|---|---|---|---|---|---|
| pm25 | 25 | 35 | 40 | 50 | 85 | 72 | 54 | 32 | 25 | 18 | 16 | 23 | 31 | 44 | 46 | 77 | 107 | 91 | 80 | 41 |
| co | 723 | 681 | 692 | 744 | 1 | 964 | 614 | 365 | 288 | 345 | 429 | 598 | 550 | 660 | 635 | 913 | 1 | 1 | 1 | 658 |
| no2 | 14 | 23 | 19 | 13 | 35 | 43 | 39 | 30 | 25 | 17 | 13 | 13 | 19 | 24 | 26 | 25 | 42 | 47 | 41 | 38 |
| o3 | 133 | 142 | 114 | 95 | 74 | 68 | 109 | 119 | 172 | 159 | 152 | 166 | 147 | 133 | 125 | 84 | 70 | 52 | 95 | 129 |
| pm10 | 47 | 59 | 67 | 63 | 104 | 99 | 87 | 54 | 46 | 35 | 31 | 40 | 66 | 69 | 80 | 103 | 143 | 137 | 122 | 70 |
| so2 | 8.4 | 8.1 | 7 | 6.1 | 6 | 7.4 | 8 | 5.7 | 5.9 | 6.7 | 7.1 | 6.7 | 7.1 | 7.3 | 7 | 4.6 | 5.9 | 6.9 | 6 | 6.1 |