Air Pollution in Shangrao: Real-time Air Quality Index and smog alert.
Pollution and air quality forecast for Shangrao. Today is Tuesday, June 2, 2026. The following air pollution values have been recorded for Shangrao:- particulate matter (PM2.5) dust - 61 (Unhealthy)
- nitrogen dioxide (NO2) - 22 (Good)
- particulate matter (PM10) suspended dust - 69 (Unhealthy for Sensitive Groups)
- carbon monoxide (CO) - 219 (Good)
- ozone (O3) - 0 (Good)
- sulfur dioxide (SO2) - 8 (Good)

What is the air quality in Shangrao today? Is the air polluted in Shangrao?. Is there smog?
What is the current level of PM2.5 in Shangrao? (particulate matter (PM2.5) dust)
Today's PM2.5 level is:
61 (Unhealthy)
For comparison, the highest level of PM2.5 in Shangrao in the last 7 days was: 28 (Friday, May 27, 2022) and the lowest: 28 (Friday, May 27, 2022).
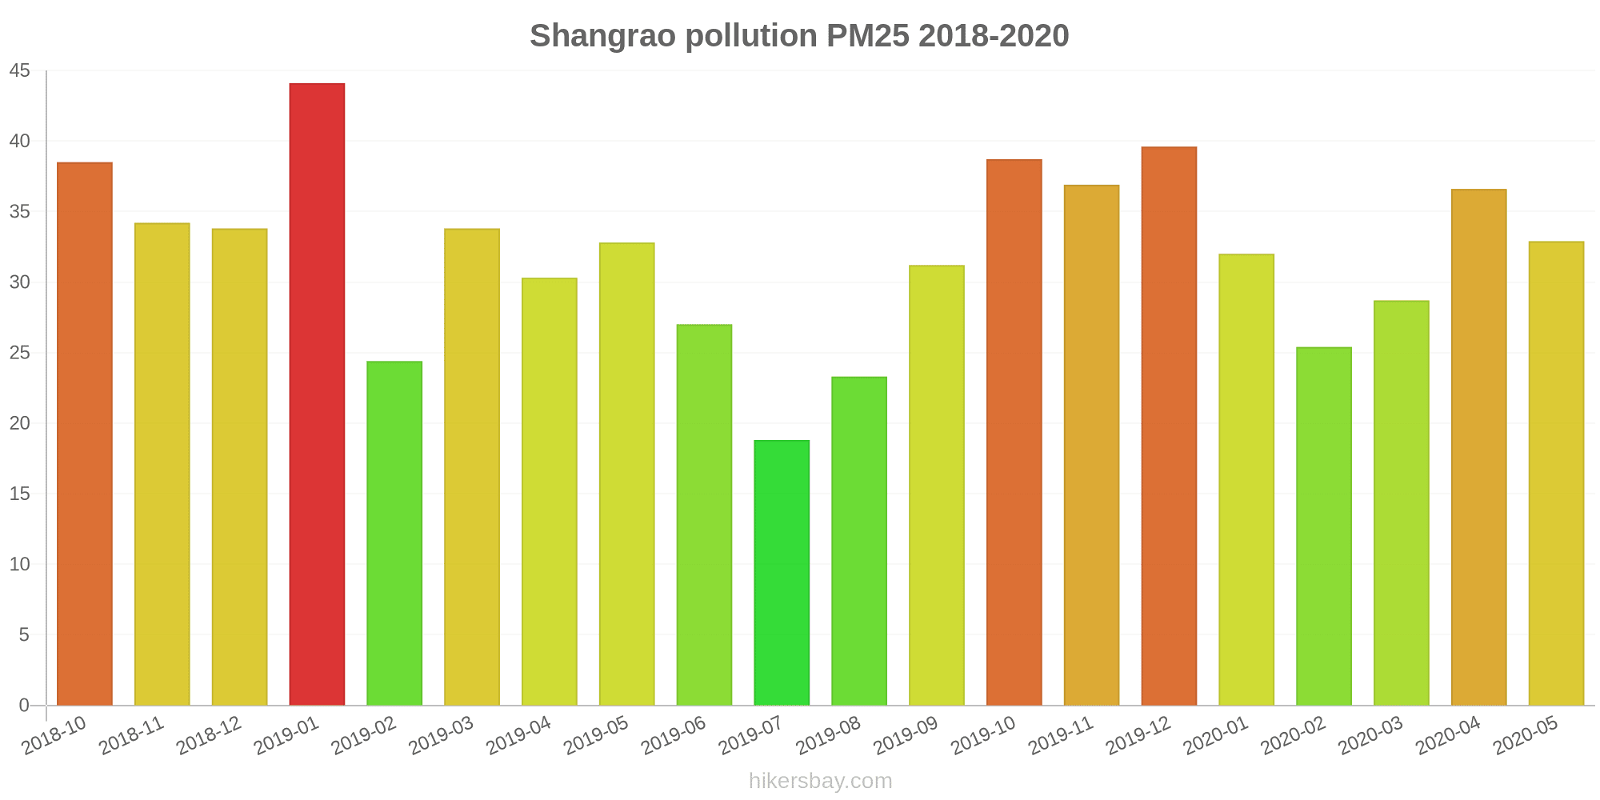
The highest PM2.5 values were recorded: 44 (January 2019).
The lowest level of particulate matter PM2.5 pollution occurs in month: July (19).
How high is the level of NO2? (nitrogen dioxide (NO2))
22 (Good)
What is the level of PM10 today in Shangrao? (particulate matter (PM10) suspended dust)
The current level of particulate matter PM10 in Shangrao is:
69 (Unhealthy for Sensitive Groups)
The highest PM10 values usually occur in month: 80 (January 2019).
The lowest value of particulate matter PM10 pollution in Shangrao is usually recorded in: July (34).
How high is the CO level? (carbon monoxide (CO))
219 (Good)
How is the O3 level today in Shangrao? (ozone (O3))
0 (Good)
What is the level of SO2 pollution? (sulfur dioxide (SO2))
8 (Good)
Current data Friday, May 27, 2022, 3:00 PM
PM2,5 61 (Unhealthy)
NO2 22 (Good)
PM10 69 (Unhealthy for Sensitive Groups)
CO 219 (Good)
O3 0 (Good)
SO2 8 (Good)
Data on air pollution from recent days in Shangrao
index
2022-05-27
pm25
28
Moderate
no2
22
Good
pm10
35
Moderate
co
579
Good
o3
22
Good
so2
5
Good
data source »
Air pollution in Shangrao from October 2018 to May 2020
index
2020-05
2020-04
2020-03
2020-02
2020-01
2019-12
2019-11
2019-10
2019-09
2019-08
2019-07
2019-06
2019-05
2019-04
2019-03
2019-02
2019-01
2018-12
2018-11
2018-10
pm25
33 (Moderate)
37 (Unhealthy for Sensitive Groups)
29 (Moderate)
25 (Moderate)
32 (Moderate)
40 (Unhealthy for Sensitive Groups)
37 (Unhealthy for Sensitive Groups)
39 (Unhealthy for Sensitive Groups)
31 (Moderate)
23 (Moderate)
19 (Moderate)
27 (Moderate)
33 (Moderate)
30 (Moderate)
34 (Moderate)
24 (Moderate)
44 (Unhealthy for Sensitive Groups)
34 (Moderate)
34 (Moderate)
39 (Unhealthy for Sensitive Groups)
co
933 (Good)
681 (Good)
863 (Good)
734 (Good)
932 (Good)
980 (Good)
656 (Good)
781 (Good)
736 (Good)
651 (Good)
476 (Good)
588 (Good)
586 (Good)
713 (Good)
941 (Good)
1 (Good)
1 (Good)
1 (Good)
942 (Good)
1 (Good)
no2
19 (Good)
31 (Good)
26 (Good)
13 (Good)
26 (Good)
45 (Moderate)
41 (Moderate)
31 (Good)
25 (Good)
15 (Good)
13 (Good)
20 (Good)
24 (Good)
30 (Good)
31 (Good)
19 (Good)
42 (Moderate)
38 (Good)
32 (Good)
32 (Good)
o3
136 (Unhealthy for Sensitive Groups)
140 (Unhealthy for Sensitive Groups)
84 (Moderate)
84 (Moderate)
58 (Good)
69 (Good)
108 (Moderate)
139 (Unhealthy for Sensitive Groups)
157 (Unhealthy)
122 (Unhealthy for Sensitive Groups)
106 (Moderate)
126 (Unhealthy for Sensitive Groups)
137 (Unhealthy for Sensitive Groups)
107 (Moderate)
100 (Moderate)
58 (Good)
55 (Good)
42 (Good)
73 (Moderate)
108 (Moderate)
pm10
51 (Unhealthy for Sensitive Groups)
62 (Unhealthy for Sensitive Groups)
46 (Moderate)
41 (Moderate)
51 (Unhealthy for Sensitive Groups)
74 (Unhealthy for Sensitive Groups)
77 (Unhealthy for Sensitive Groups)
74 (Unhealthy for Sensitive Groups)
56 (Unhealthy for Sensitive Groups)
41 (Moderate)
34 (Moderate)
46 (Moderate)
64 (Unhealthy for Sensitive Groups)
58 (Unhealthy for Sensitive Groups)
63 (Unhealthy for Sensitive Groups)
40 (Moderate)
80 (Unhealthy for Sensitive Groups)
61 (Unhealthy for Sensitive Groups)
68 (Unhealthy for Sensitive Groups)
75 (Unhealthy for Sensitive Groups)
so2
15 (Good)
15 (Good)
15 (Good)
9.3 (Good)
9.1 (Good)
35 (Good)
24 (Good)
27 (Good)
12 (Good)
11 (Good)
13 (Good)
15 (Good)
17 (Good)
17 (Good)
16 (Good)
6.5 (Good)
11 (Good)
16 (Good)
20 (Good)
23 (Good)
data source »
凤凰光学
Friday, May 27, 2022, 3:00 PM
PM2,5 61 (Unhealthy)
particulate matter (PM2.5) dust
NO2 22 (Good)
nitrogen dioxide (NO2)
PM10 69 (Unhealthy for Sensitive Groups)
particulate matter (PM10) suspended dust
CO 219 (Good)
carbon monoxide (CO)
O3 0.05 (Good)
ozone (O3)
SO2 7.7 (Good)
sulfur dioxide (SO2)
凤凰光学
index
2022-05-27
pm25
28
no2
22
pm10
35
co
579
o3
22
so2
4.6
凤凰光学
2018-10 2020-05

index
2020-05
2020-04
2020-03
2020-02
2020-01
2019-12
2019-11
2019-10
2019-09
2019-08
2019-07
2019-06
2019-05
2019-04
2019-03
2019-02
2019-01
2018-12
2018-11
2018-10
pm25
33
37
29
25
32
40
37
39
31
23
19
27
33
30
34
24
44
34
34
39
co
933
681
863
734
932
980
656
781
736
651
476
588
586
713
941
1
1
1
942
1
no2
19
31
26
13
26
45
41
31
25
15
13
20
24
30
31
19
42
38
32
32
o3
136
140
84
84
58
69
108
139
157
122
106
126
137
107
100
58
55
42
73
108
pm10
51
62
46
41
51
74
77
74
56
41
34
46
64
58
63
40
80
61
68
75
so2
15
15
15
9.3
9.1
35
24
27
12
11
13
15
17
17
16
6.5
11
16
20
23
* Pollution data source:
https://openaq.org
(ChinaAQIData)
The data is licensed under CC-By 4.0
PM2,5 61 (Unhealthy)
NO2 22 (Good)
PM10 69 (Unhealthy for Sensitive Groups)
CO 219 (Good)
O3 0 (Good)
SO2 8 (Good)
Data on air pollution from recent days in Shangrao
| index | 2022-05-27 |
|---|---|
| pm25 | 28 Moderate |
| no2 | 22 Good |
| pm10 | 35 Moderate |
| co | 579 Good |
| o3 | 22 Good |
| so2 | 5 Good |

| index | 2020-05 | 2020-04 | 2020-03 | 2020-02 | 2020-01 | 2019-12 | 2019-11 | 2019-10 | 2019-09 | 2019-08 | 2019-07 | 2019-06 | 2019-05 | 2019-04 | 2019-03 | 2019-02 | 2019-01 | 2018-12 | 2018-11 | 2018-10 |
|---|---|---|---|---|---|---|---|---|---|---|---|---|---|---|---|---|---|---|---|---|
| pm25 | 33 (Moderate) | 37 (Unhealthy for Sensitive Groups) | 29 (Moderate) | 25 (Moderate) | 32 (Moderate) | 40 (Unhealthy for Sensitive Groups) | 37 (Unhealthy for Sensitive Groups) | 39 (Unhealthy for Sensitive Groups) | 31 (Moderate) | 23 (Moderate) | 19 (Moderate) | 27 (Moderate) | 33 (Moderate) | 30 (Moderate) | 34 (Moderate) | 24 (Moderate) | 44 (Unhealthy for Sensitive Groups) | 34 (Moderate) | 34 (Moderate) | 39 (Unhealthy for Sensitive Groups) |
| co | 933 (Good) | 681 (Good) | 863 (Good) | 734 (Good) | 932 (Good) | 980 (Good) | 656 (Good) | 781 (Good) | 736 (Good) | 651 (Good) | 476 (Good) | 588 (Good) | 586 (Good) | 713 (Good) | 941 (Good) | 1 (Good) | 1 (Good) | 1 (Good) | 942 (Good) | 1 (Good) |
| no2 | 19 (Good) | 31 (Good) | 26 (Good) | 13 (Good) | 26 (Good) | 45 (Moderate) | 41 (Moderate) | 31 (Good) | 25 (Good) | 15 (Good) | 13 (Good) | 20 (Good) | 24 (Good) | 30 (Good) | 31 (Good) | 19 (Good) | 42 (Moderate) | 38 (Good) | 32 (Good) | 32 (Good) |
| o3 | 136 (Unhealthy for Sensitive Groups) | 140 (Unhealthy for Sensitive Groups) | 84 (Moderate) | 84 (Moderate) | 58 (Good) | 69 (Good) | 108 (Moderate) | 139 (Unhealthy for Sensitive Groups) | 157 (Unhealthy) | 122 (Unhealthy for Sensitive Groups) | 106 (Moderate) | 126 (Unhealthy for Sensitive Groups) | 137 (Unhealthy for Sensitive Groups) | 107 (Moderate) | 100 (Moderate) | 58 (Good) | 55 (Good) | 42 (Good) | 73 (Moderate) | 108 (Moderate) |
| pm10 | 51 (Unhealthy for Sensitive Groups) | 62 (Unhealthy for Sensitive Groups) | 46 (Moderate) | 41 (Moderate) | 51 (Unhealthy for Sensitive Groups) | 74 (Unhealthy for Sensitive Groups) | 77 (Unhealthy for Sensitive Groups) | 74 (Unhealthy for Sensitive Groups) | 56 (Unhealthy for Sensitive Groups) | 41 (Moderate) | 34 (Moderate) | 46 (Moderate) | 64 (Unhealthy for Sensitive Groups) | 58 (Unhealthy for Sensitive Groups) | 63 (Unhealthy for Sensitive Groups) | 40 (Moderate) | 80 (Unhealthy for Sensitive Groups) | 61 (Unhealthy for Sensitive Groups) | 68 (Unhealthy for Sensitive Groups) | 75 (Unhealthy for Sensitive Groups) |
| so2 | 15 (Good) | 15 (Good) | 15 (Good) | 9.3 (Good) | 9.1 (Good) | 35 (Good) | 24 (Good) | 27 (Good) | 12 (Good) | 11 (Good) | 13 (Good) | 15 (Good) | 17 (Good) | 17 (Good) | 16 (Good) | 6.5 (Good) | 11 (Good) | 16 (Good) | 20 (Good) | 23 (Good) |
PM2,5 61 (Unhealthy)
particulate matter (PM2.5) dustNO2 22 (Good)
nitrogen dioxide (NO2)PM10 69 (Unhealthy for Sensitive Groups)
particulate matter (PM10) suspended dustCO 219 (Good)
carbon monoxide (CO)O3 0.05 (Good)
ozone (O3)SO2 7.7 (Good)
sulfur dioxide (SO2)凤凰光学
| index | 2022-05-27 |
|---|---|
| pm25 | 28 |
| no2 | 22 |
| pm10 | 35 |
| co | 579 |
| o3 | 22 |
| so2 | 4.6 |
凤凰光学

| index | 2020-05 | 2020-04 | 2020-03 | 2020-02 | 2020-01 | 2019-12 | 2019-11 | 2019-10 | 2019-09 | 2019-08 | 2019-07 | 2019-06 | 2019-05 | 2019-04 | 2019-03 | 2019-02 | 2019-01 | 2018-12 | 2018-11 | 2018-10 |
|---|---|---|---|---|---|---|---|---|---|---|---|---|---|---|---|---|---|---|---|---|
| pm25 | 33 | 37 | 29 | 25 | 32 | 40 | 37 | 39 | 31 | 23 | 19 | 27 | 33 | 30 | 34 | 24 | 44 | 34 | 34 | 39 |
| co | 933 | 681 | 863 | 734 | 932 | 980 | 656 | 781 | 736 | 651 | 476 | 588 | 586 | 713 | 941 | 1 | 1 | 1 | 942 | 1 |
| no2 | 19 | 31 | 26 | 13 | 26 | 45 | 41 | 31 | 25 | 15 | 13 | 20 | 24 | 30 | 31 | 19 | 42 | 38 | 32 | 32 |
| o3 | 136 | 140 | 84 | 84 | 58 | 69 | 108 | 139 | 157 | 122 | 106 | 126 | 137 | 107 | 100 | 58 | 55 | 42 | 73 | 108 |
| pm10 | 51 | 62 | 46 | 41 | 51 | 74 | 77 | 74 | 56 | 41 | 34 | 46 | 64 | 58 | 63 | 40 | 80 | 61 | 68 | 75 |
| so2 | 15 | 15 | 15 | 9.3 | 9.1 | 35 | 24 | 27 | 12 | 11 | 13 | 15 | 17 | 17 | 16 | 6.5 | 11 | 16 | 20 | 23 |