Air Pollution in Yucheng: Real-time Air Quality Index and smog alert.
Pollution and air quality forecast for Yucheng. Today is Tuesday, June 16, 2026. The following air pollution values have been recorded for Yucheng:- particulate matter (PM2.5) dust - 61 (Unhealthy)
- nitrogen dioxide (NO2) - 22 (Good)
- particulate matter (PM10) suspended dust - 69 (Unhealthy for Sensitive Groups)
- carbon monoxide (CO) - 219 (Good)
- ozone (O3) - 0 (Good)
- sulfur dioxide (SO2) - 8 (Good)

What is the air quality in Yucheng today? Is the air polluted in Yucheng?. Is there smog?
What is the current level of PM2.5 in Yucheng? (particulate matter (PM2.5) dust)
Today's PM2.5 level is:
61 (Unhealthy)
For comparison, the highest level of PM2.5 in Yucheng in the last 7 days was: 28 (Friday, May 27, 2022) and the lowest: 28 (Friday, May 27, 2022).
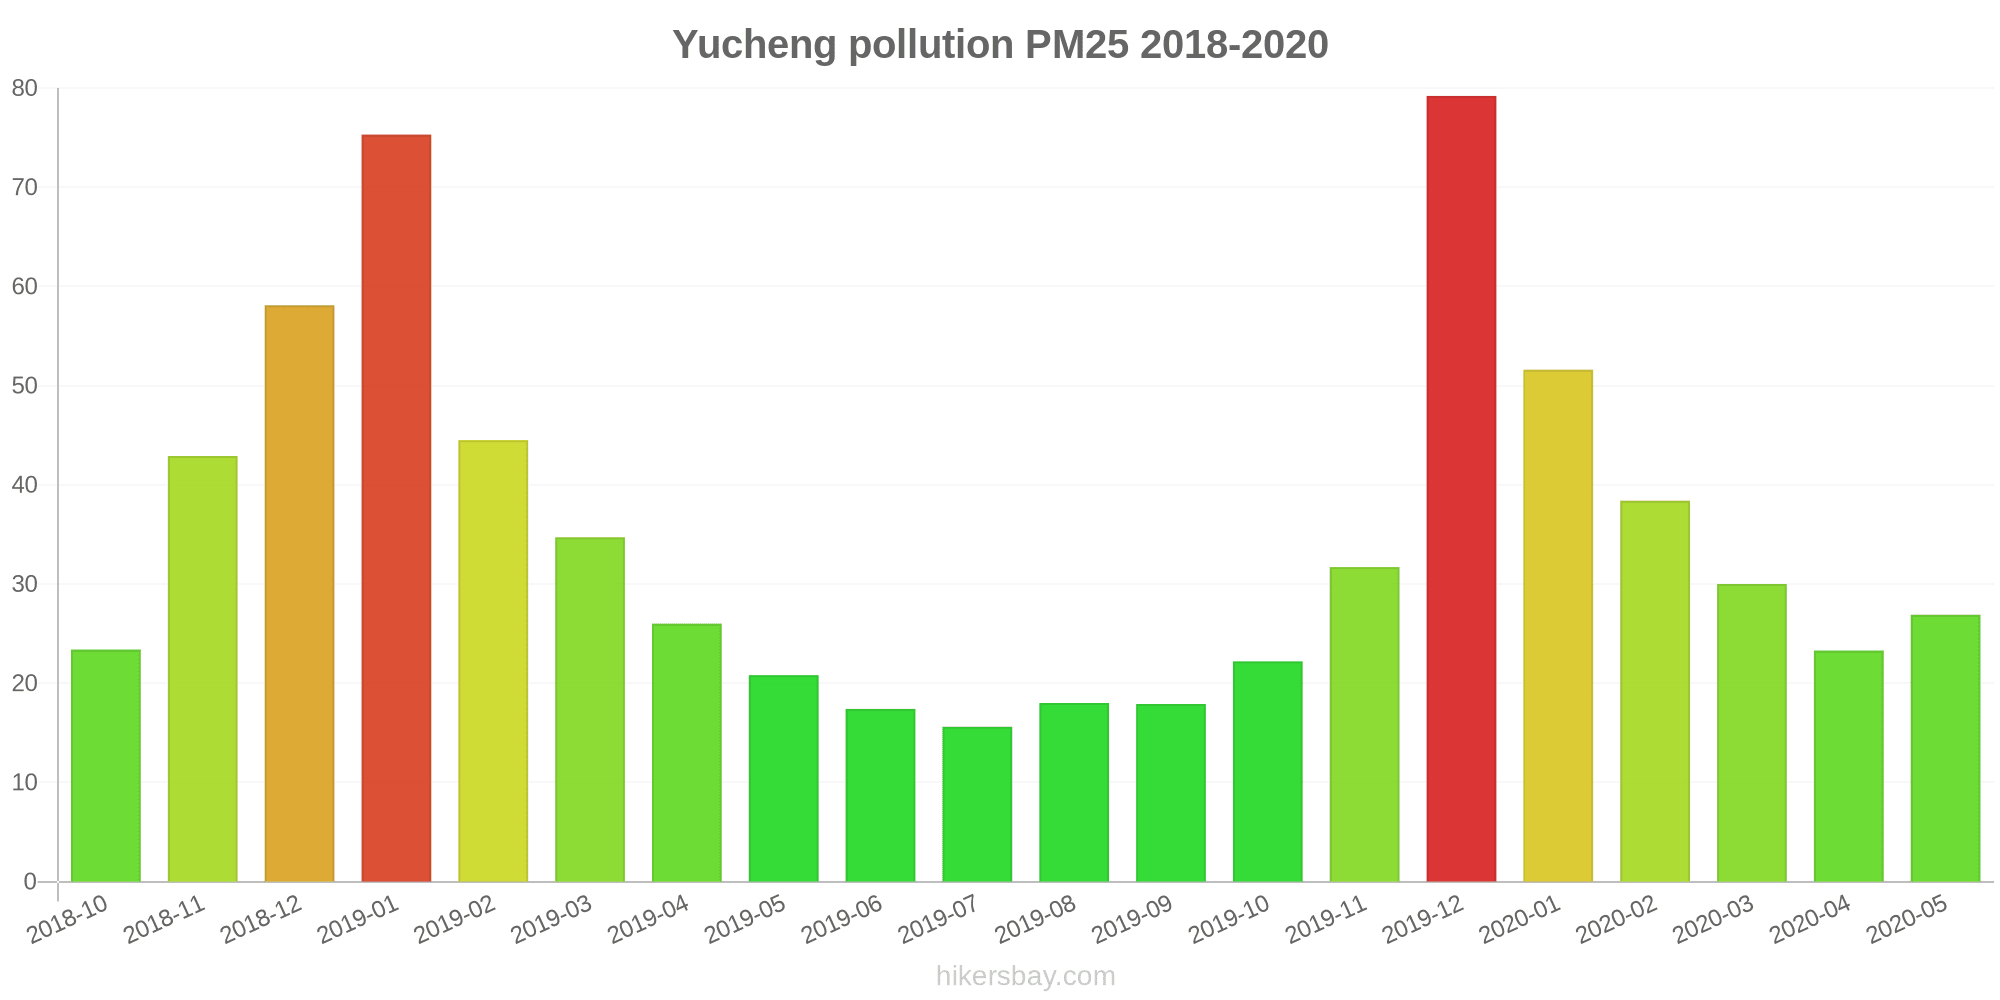
The highest PM2.5 values were recorded: 79 (December 2019).
The lowest level of particulate matter PM2.5 pollution occurs in month: July (16).
How high is the level of NO2? (nitrogen dioxide (NO2))
22 (Good)
What is the level of PM10 today in Yucheng? (particulate matter (PM10) suspended dust)
The current level of particulate matter PM10 in Yucheng is:
69 (Unhealthy for Sensitive Groups)
The highest PM10 values usually occur in month: 96 (December 2019).
The lowest value of particulate matter PM10 pollution in Yucheng is usually recorded in: July (25).
How high is the CO level? (carbon monoxide (CO))
219 (Good)
How is the O3 level today in Yucheng? (ozone (O3))
0 (Good)
What is the level of SO2 pollution? (sulfur dioxide (SO2))
8 (Good)
Current data Friday, May 27, 2022, 3:00 PM
PM2,5 61 (Unhealthy)
NO2 22 (Good)
PM10 69 (Unhealthy for Sensitive Groups)
CO 219 (Good)
O3 0 (Good)
SO2 8 (Good)
Data on air pollution from recent days in Yucheng
index
2022-05-27
pm25
28
Moderate
no2
22
Good
pm10
35
Moderate
co
579
Good
o3
22
Good
so2
5
Good
data source »
Air pollution in Yucheng from October 2018 to May 2020

index
2020-05
2020-04
2020-03
2020-02
2020-01
2019-12
2019-11
2019-10
2019-09
2019-08
2019-07
2019-06
2019-05
2019-04
2019-03
2019-02
2019-01
2018-12
2018-11
2018-10
pm25
27 (Moderate)
23 (Moderate)
30 (Moderate)
38 (Unhealthy for Sensitive Groups)
52 (Unhealthy for Sensitive Groups)
79 (Very Unhealthy)
32 (Moderate)
22 (Moderate)
18 (Moderate)
18 (Moderate)
16 (Moderate)
17 (Moderate)
21 (Moderate)
26 (Moderate)
35 (Moderate)
45 (Unhealthy for Sensitive Groups)
75 (Very Unhealthy)
58 (Unhealthy)
43 (Unhealthy for Sensitive Groups)
23 (Moderate)
co
461 (Good)
386 (Good)
405 (Good)
559 (Good)
899 (Good)
801 (Good)
519 (Good)
480 (Good)
485 (Good)
397 (Good)
390 (Good)
440 (Good)
416 (Good)
434 (Good)
556 (Good)
785 (Good)
971 (Good)
855 (Good)
621 (Good)
484 (Good)
no2
25 (Good)
30 (Good)
28 (Good)
19 (Good)
33 (Good)
43 (Moderate)
37 (Good)
32 (Good)
27 (Good)
23 (Good)
24 (Good)
26 (Good)
25 (Good)
31 (Good)
35 (Good)
26 (Good)
44 (Moderate)
33 (Good)
38 (Good)
29 (Good)
o3
161 (Unhealthy)
114 (Moderate)
104 (Moderate)
79 (Moderate)
56 (Good)
49 (Good)
47 (Good)
74 (Moderate)
93 (Moderate)
140 (Unhealthy for Sensitive Groups)
122 (Unhealthy for Sensitive Groups)
128 (Unhealthy for Sensitive Groups)
118 (Moderate)
128 (Unhealthy for Sensitive Groups)
93 (Moderate)
69 (Good)
59 (Good)
66 (Good)
82 (Moderate)
83 (Moderate)
pm10
43 (Moderate)
39 (Moderate)
50 (Moderate)
49 (Moderate)
62 (Unhealthy for Sensitive Groups)
96 (Unhealthy)
49 (Moderate)
32 (Moderate)
29 (Moderate)
28 (Moderate)
25 (Moderate)
28 (Moderate)
33 (Moderate)
41 (Moderate)
48 (Moderate)
56 (Unhealthy for Sensitive Groups)
95 (Unhealthy)
87 (Unhealthy)
62 (Unhealthy for Sensitive Groups)
33 (Moderate)
so2
9 (Good)
9.7 (Good)
9.6 (Good)
8.3 (Good)
8.9 (Good)
9.8 (Good)
10 (Good)
8.6 (Good)
8.3 (Good)
9.6 (Good)
9.5 (Good)
7.8 (Good)
9 (Good)
8 (Good)
7.5 (Good)
4.4 (Good)
5 (Good)
6.1 (Good)
20 (Good)
20 (Good)
data source »
建安厂
Friday, May 27, 2022, 3:00 PM
PM2,5 61 (Unhealthy)
particulate matter (PM2.5) dust
NO2 22 (Good)
nitrogen dioxide (NO2)
PM10 69 (Unhealthy for Sensitive Groups)
particulate matter (PM10) suspended dust
CO 219 (Good)
carbon monoxide (CO)
O3 0.05 (Good)
ozone (O3)
SO2 7.7 (Good)
sulfur dioxide (SO2)
建安厂
index
2022-05-27
pm25
28
no2
22
pm10
35
co
579
o3
22
so2
4.6
建安厂
2018-10 2020-05

index
2020-05
2020-04
2020-03
2020-02
2020-01
2019-12
2019-11
2019-10
2019-09
2019-08
2019-07
2019-06
2019-05
2019-04
2019-03
2019-02
2019-01
2018-12
2018-11
2018-10
pm25
27
23
30
38
52
79
32
22
18
18
16
17
21
26
35
45
75
58
43
23
co
461
386
405
559
899
801
519
480
485
397
390
440
416
434
556
785
971
855
621
484
no2
25
30
28
19
33
43
37
32
27
23
24
26
25
31
35
26
44
33
38
29
o3
161
114
104
79
56
49
47
74
93
140
122
128
118
128
93
69
59
66
82
83
pm10
43
39
50
49
62
96
49
32
29
28
25
28
33
41
48
56
95
87
62
33
so2
9
9.7
9.6
8.3
8.9
9.8
10
8.6
8.3
9.6
9.5
7.8
9
8
7.5
4.4
5
6.1
20
20
* Pollution data source:
https://openaq.org
(ChinaAQIData)
The data is licensed under CC-By 4.0
PM2,5 61 (Unhealthy)
NO2 22 (Good)
PM10 69 (Unhealthy for Sensitive Groups)
CO 219 (Good)
O3 0 (Good)
SO2 8 (Good)
Data on air pollution from recent days in Yucheng
| index | 2022-05-27 |
|---|---|
| pm25 | 28 Moderate |
| no2 | 22 Good |
| pm10 | 35 Moderate |
| co | 579 Good |
| o3 | 22 Good |
| so2 | 5 Good |
| index | 2020-05 | 2020-04 | 2020-03 | 2020-02 | 2020-01 | 2019-12 | 2019-11 | 2019-10 | 2019-09 | 2019-08 | 2019-07 | 2019-06 | 2019-05 | 2019-04 | 2019-03 | 2019-02 | 2019-01 | 2018-12 | 2018-11 | 2018-10 |
|---|---|---|---|---|---|---|---|---|---|---|---|---|---|---|---|---|---|---|---|---|
| pm25 | 27 (Moderate) | 23 (Moderate) | 30 (Moderate) | 38 (Unhealthy for Sensitive Groups) | 52 (Unhealthy for Sensitive Groups) | 79 (Very Unhealthy) | 32 (Moderate) | 22 (Moderate) | 18 (Moderate) | 18 (Moderate) | 16 (Moderate) | 17 (Moderate) | 21 (Moderate) | 26 (Moderate) | 35 (Moderate) | 45 (Unhealthy for Sensitive Groups) | 75 (Very Unhealthy) | 58 (Unhealthy) | 43 (Unhealthy for Sensitive Groups) | 23 (Moderate) |
| co | 461 (Good) | 386 (Good) | 405 (Good) | 559 (Good) | 899 (Good) | 801 (Good) | 519 (Good) | 480 (Good) | 485 (Good) | 397 (Good) | 390 (Good) | 440 (Good) | 416 (Good) | 434 (Good) | 556 (Good) | 785 (Good) | 971 (Good) | 855 (Good) | 621 (Good) | 484 (Good) |
| no2 | 25 (Good) | 30 (Good) | 28 (Good) | 19 (Good) | 33 (Good) | 43 (Moderate) | 37 (Good) | 32 (Good) | 27 (Good) | 23 (Good) | 24 (Good) | 26 (Good) | 25 (Good) | 31 (Good) | 35 (Good) | 26 (Good) | 44 (Moderate) | 33 (Good) | 38 (Good) | 29 (Good) |
| o3 | 161 (Unhealthy) | 114 (Moderate) | 104 (Moderate) | 79 (Moderate) | 56 (Good) | 49 (Good) | 47 (Good) | 74 (Moderate) | 93 (Moderate) | 140 (Unhealthy for Sensitive Groups) | 122 (Unhealthy for Sensitive Groups) | 128 (Unhealthy for Sensitive Groups) | 118 (Moderate) | 128 (Unhealthy for Sensitive Groups) | 93 (Moderate) | 69 (Good) | 59 (Good) | 66 (Good) | 82 (Moderate) | 83 (Moderate) |
| pm10 | 43 (Moderate) | 39 (Moderate) | 50 (Moderate) | 49 (Moderate) | 62 (Unhealthy for Sensitive Groups) | 96 (Unhealthy) | 49 (Moderate) | 32 (Moderate) | 29 (Moderate) | 28 (Moderate) | 25 (Moderate) | 28 (Moderate) | 33 (Moderate) | 41 (Moderate) | 48 (Moderate) | 56 (Unhealthy for Sensitive Groups) | 95 (Unhealthy) | 87 (Unhealthy) | 62 (Unhealthy for Sensitive Groups) | 33 (Moderate) |
| so2 | 9 (Good) | 9.7 (Good) | 9.6 (Good) | 8.3 (Good) | 8.9 (Good) | 9.8 (Good) | 10 (Good) | 8.6 (Good) | 8.3 (Good) | 9.6 (Good) | 9.5 (Good) | 7.8 (Good) | 9 (Good) | 8 (Good) | 7.5 (Good) | 4.4 (Good) | 5 (Good) | 6.1 (Good) | 20 (Good) | 20 (Good) |
PM2,5 61 (Unhealthy)
particulate matter (PM2.5) dustNO2 22 (Good)
nitrogen dioxide (NO2)PM10 69 (Unhealthy for Sensitive Groups)
particulate matter (PM10) suspended dustCO 219 (Good)
carbon monoxide (CO)O3 0.05 (Good)
ozone (O3)SO2 7.7 (Good)
sulfur dioxide (SO2)建安厂
| index | 2022-05-27 |
|---|---|
| pm25 | 28 |
| no2 | 22 |
| pm10 | 35 |
| co | 579 |
| o3 | 22 |
| so2 | 4.6 |
建安厂

| index | 2020-05 | 2020-04 | 2020-03 | 2020-02 | 2020-01 | 2019-12 | 2019-11 | 2019-10 | 2019-09 | 2019-08 | 2019-07 | 2019-06 | 2019-05 | 2019-04 | 2019-03 | 2019-02 | 2019-01 | 2018-12 | 2018-11 | 2018-10 |
|---|---|---|---|---|---|---|---|---|---|---|---|---|---|---|---|---|---|---|---|---|
| pm25 | 27 | 23 | 30 | 38 | 52 | 79 | 32 | 22 | 18 | 18 | 16 | 17 | 21 | 26 | 35 | 45 | 75 | 58 | 43 | 23 |
| co | 461 | 386 | 405 | 559 | 899 | 801 | 519 | 480 | 485 | 397 | 390 | 440 | 416 | 434 | 556 | 785 | 971 | 855 | 621 | 484 |
| no2 | 25 | 30 | 28 | 19 | 33 | 43 | 37 | 32 | 27 | 23 | 24 | 26 | 25 | 31 | 35 | 26 | 44 | 33 | 38 | 29 |
| o3 | 161 | 114 | 104 | 79 | 56 | 49 | 47 | 74 | 93 | 140 | 122 | 128 | 118 | 128 | 93 | 69 | 59 | 66 | 82 | 83 |
| pm10 | 43 | 39 | 50 | 49 | 62 | 96 | 49 | 32 | 29 | 28 | 25 | 28 | 33 | 41 | 48 | 56 | 95 | 87 | 62 | 33 |
| so2 | 9 | 9.7 | 9.6 | 8.3 | 8.9 | 9.8 | 10 | 8.6 | 8.3 | 9.6 | 9.5 | 7.8 | 9 | 8 | 7.5 | 4.4 | 5 | 6.1 | 20 | 20 |