Air Pollution in Yangpu: Real-time Air Quality Index and smog alert.
Pollution and air quality forecast for Yangpu. Today is Wednesday, June 10, 2026. The following air pollution values have been recorded for Yangpu:- particulate matter (PM2.5) dust - 61 (Unhealthy)
- nitrogen dioxide (NO2) - 22 (Good)
- particulate matter (PM10) suspended dust - 69 (Unhealthy for Sensitive Groups)
- carbon monoxide (CO) - 219 (Good)
- ozone (O3) - 0 (Good)
- sulfur dioxide (SO2) - 8 (Good)

What is the air quality in Yangpu today? Is the air polluted in Yangpu?. Is there smog?
What is the current level of PM2.5 in Yangpu? (particulate matter (PM2.5) dust)
Today's PM2.5 level is:
61 (Unhealthy)
For comparison, the highest level of PM2.5 in Yangpu in the last 7 days was: 28 (Friday, May 27, 2022) and the lowest: 28 (Friday, May 27, 2022).
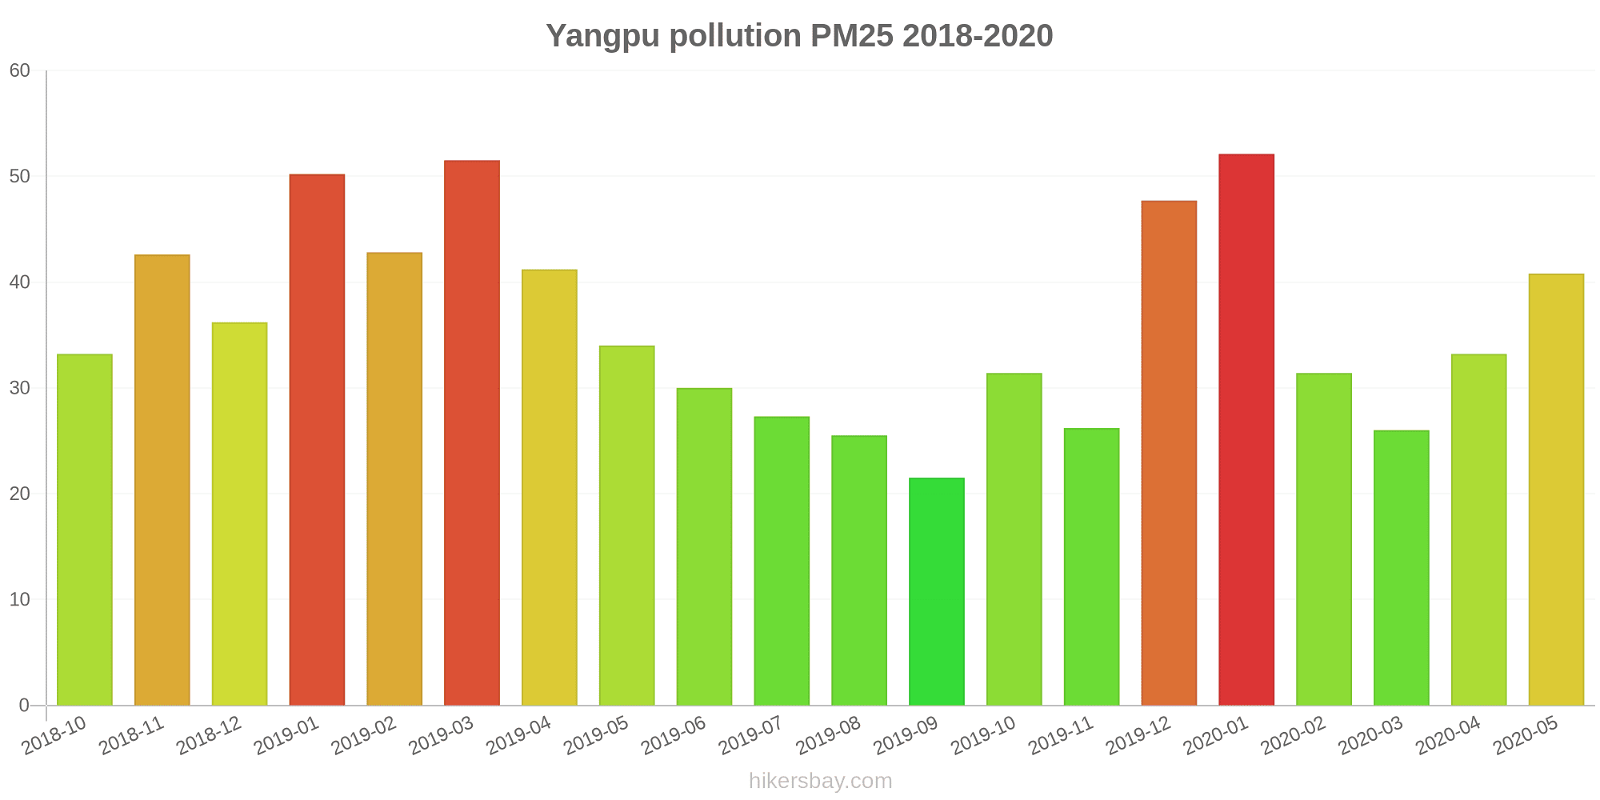
The highest PM2.5 values were recorded: 52 (January 2020).
The lowest level of particulate matter PM2.5 pollution occurs in month: September (22).
How high is the level of NO2? (nitrogen dioxide (NO2))
22 (Good)
What is the level of PM10 today in Yangpu? (particulate matter (PM10) suspended dust)
The current level of particulate matter PM10 in Yangpu is:
69 (Unhealthy for Sensitive Groups)
The highest PM10 values usually occur in month: 69 (March 2019).
The lowest value of particulate matter PM10 pollution in Yangpu is usually recorded in: June (33).
How high is the CO level? (carbon monoxide (CO))
219 (Good)
How is the O3 level today in Yangpu? (ozone (O3))
0 (Good)
What is the level of SO2 pollution? (sulfur dioxide (SO2))
8 (Good)
Current data Friday, May 27, 2022, 3:00 PM
PM2,5 61 (Unhealthy)
NO2 22 (Good)
PM10 69 (Unhealthy for Sensitive Groups)
CO 219 (Good)
O3 0 (Good)
SO2 8 (Good)
Data on air pollution from recent days in Yangpu
index
2022-05-27
pm25
28
Moderate
no2
22
Good
pm10
35
Moderate
co
579
Good
o3
22
Good
so2
5
Good
data source »
Air pollution in Yangpu from October 2018 to May 2020
index
2020-05
2020-04
2020-03
2020-02
2020-01
2019-12
2019-11
2019-10
2019-09
2019-08
2019-07
2019-06
2019-05
2019-04
2019-03
2019-02
2019-01
2018-12
2018-11
2018-10
pm25
41 (Unhealthy for Sensitive Groups)
33 (Moderate)
26 (Moderate)
31 (Moderate)
52 (Unhealthy for Sensitive Groups)
48 (Unhealthy for Sensitive Groups)
26 (Moderate)
31 (Moderate)
22 (Moderate)
26 (Moderate)
27 (Moderate)
30 (Moderate)
34 (Moderate)
41 (Unhealthy for Sensitive Groups)
52 (Unhealthy for Sensitive Groups)
43 (Unhealthy for Sensitive Groups)
50 (Unhealthy for Sensitive Groups)
36 (Unhealthy for Sensitive Groups)
43 (Unhealthy for Sensitive Groups)
33 (Moderate)
co
715 (Good)
527 (Good)
634 (Good)
750 (Good)
923 (Good)
941 (Good)
674 (Good)
707 (Good)
664 (Good)
562 (Good)
550 (Good)
455 (Good)
502 (Good)
593 (Good)
751 (Good)
858 (Good)
934 (Good)
760 (Good)
797 (Good)
671 (Good)
no2
40 (Moderate)
43 (Moderate)
35 (Good)
29 (Good)
47 (Moderate)
67 (Moderate)
50 (Moderate)
47 (Moderate)
37 (Good)
32 (Good)
35 (Good)
31 (Good)
46 (Moderate)
55 (Moderate)
60 (Moderate)
40 (Good)
59 (Moderate)
51 (Moderate)
59 (Moderate)
48 (Moderate)
o3
143 (Unhealthy for Sensitive Groups)
145 (Unhealthy for Sensitive Groups)
116 (Moderate)
97 (Moderate)
77 (Moderate)
75 (Moderate)
100 (Moderate)
112 (Moderate)
121 (Unhealthy for Sensitive Groups)
130 (Unhealthy for Sensitive Groups)
139 (Unhealthy for Sensitive Groups)
143 (Unhealthy for Sensitive Groups)
154 (Unhealthy)
127 (Unhealthy for Sensitive Groups)
127 (Unhealthy for Sensitive Groups)
94 (Moderate)
78 (Moderate)
68 (Good)
101 (Moderate)
121 (Unhealthy for Sensitive Groups)
pm10
49 (Moderate)
59 (Unhealthy for Sensitive Groups)
43 (Moderate)
37 (Moderate)
49 (Moderate)
56 (Unhealthy for Sensitive Groups)
62 (Unhealthy for Sensitive Groups)
58 (Unhealthy for Sensitive Groups)
34 (Moderate)
35 (Moderate)
34 (Moderate)
33 (Moderate)
53 (Unhealthy for Sensitive Groups)
51 (Unhealthy for Sensitive Groups)
69 (Unhealthy for Sensitive Groups)
53 (Unhealthy for Sensitive Groups)
61 (Unhealthy for Sensitive Groups)
54 (Unhealthy for Sensitive Groups)
54 (Unhealthy for Sensitive Groups)
54 (Unhealthy for Sensitive Groups)
so2
7.5 (Good)
8.7 (Good)
7.8 (Good)
6.8 (Good)
6.6 (Good)
7.3 (Good)
6.6 (Good)
6.4 (Good)
5 (Good)
3.6 (Good)
4 (Good)
5.4 (Good)
6.7 (Good)
3.9 (Good)
4.7 (Good)
6.8 (Good)
9.1 (Good)
8.4 (Good)
8.3 (Good)
9.6 (Good)
data source »
杨浦四漂
Friday, May 27, 2022, 3:00 PM
PM2,5 61 (Unhealthy)
particulate matter (PM2.5) dust
NO2 22 (Good)
nitrogen dioxide (NO2)
PM10 69 (Unhealthy for Sensitive Groups)
particulate matter (PM10) suspended dust
CO 219 (Good)
carbon monoxide (CO)
O3 0.05 (Good)
ozone (O3)
SO2 7.7 (Good)
sulfur dioxide (SO2)
杨浦四漂
index
2022-05-27
pm25
28
no2
22
pm10
35
co
579
o3
22
so2
4.6
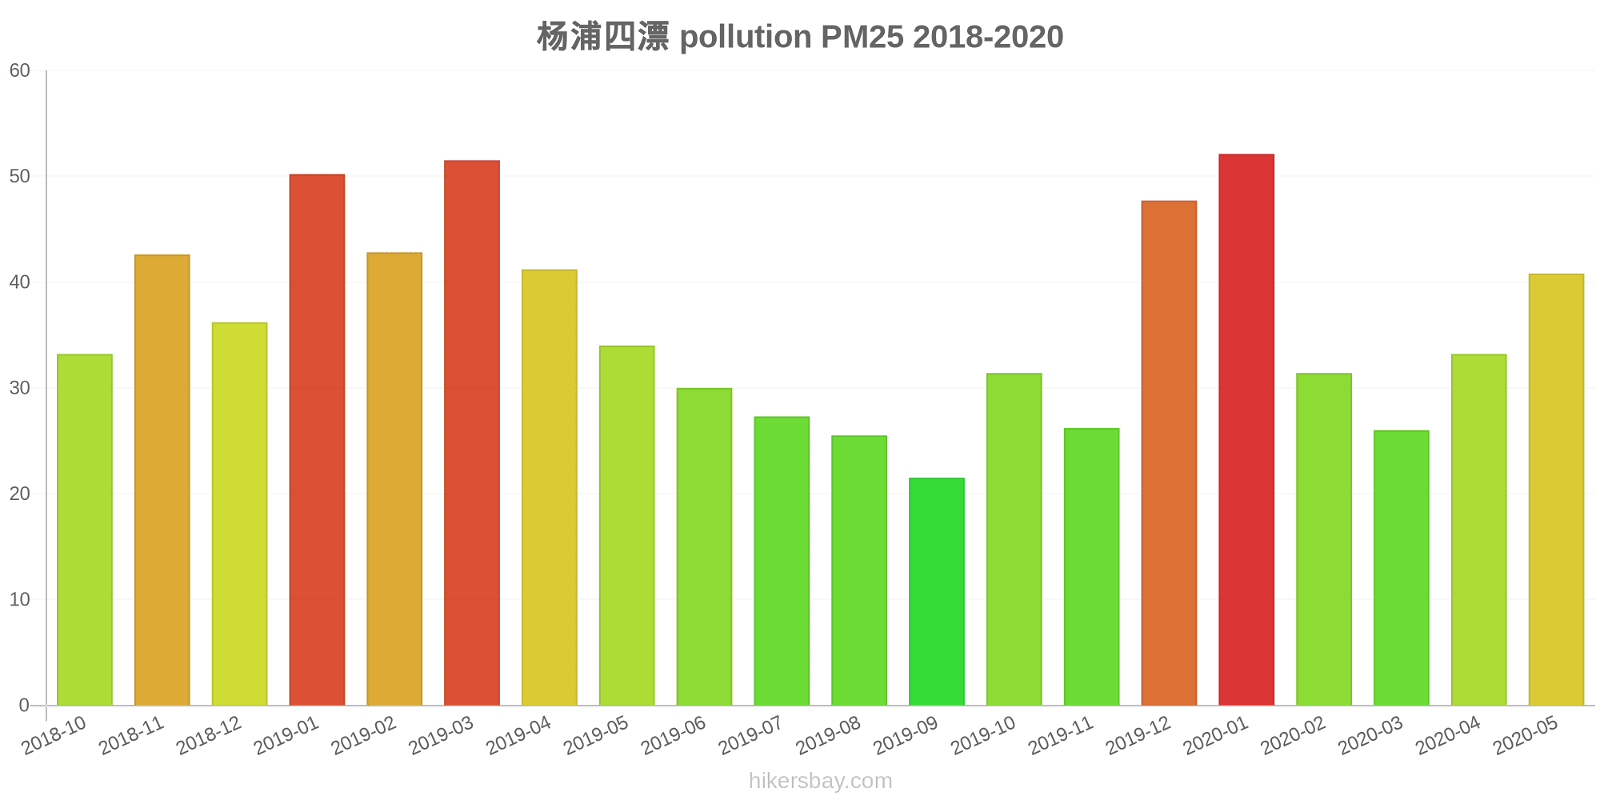
杨浦四漂
2018-10 2020-05
index
2020-05
2020-04
2020-03
2020-02
2020-01
2019-12
2019-11
2019-10
2019-09
2019-08
2019-07
2019-06
2019-05
2019-04
2019-03
2019-02
2019-01
2018-12
2018-11
2018-10
pm25
41
33
26
31
52
48
26
31
22
26
27
30
34
41
52
43
50
36
43
33
co
715
527
634
750
923
941
674
707
664
562
550
455
502
593
751
858
934
760
797
671
no2
40
43
35
29
47
67
50
47
37
32
35
31
46
55
60
40
59
51
59
48
o3
143
145
116
97
77
75
100
112
121
130
139
143
154
127
127
94
78
68
101
121
pm10
49
59
43
37
49
56
62
58
34
35
34
33
53
51
69
53
61
54
54
54
so2
7.5
8.7
7.8
6.8
6.6
7.3
6.6
6.4
5
3.6
4
5.4
6.7
3.9
4.7
6.8
9.1
8.4
8.3
9.6
* Pollution data source:
https://openaq.org
(ChinaAQIData)
The data is licensed under CC-By 4.0
PM2,5 61 (Unhealthy)
NO2 22 (Good)
PM10 69 (Unhealthy for Sensitive Groups)
CO 219 (Good)
O3 0 (Good)
SO2 8 (Good)
Data on air pollution from recent days in Yangpu
| index | 2022-05-27 |
|---|---|
| pm25 | 28 Moderate |
| no2 | 22 Good |
| pm10 | 35 Moderate |
| co | 579 Good |
| o3 | 22 Good |
| so2 | 5 Good |

| index | 2020-05 | 2020-04 | 2020-03 | 2020-02 | 2020-01 | 2019-12 | 2019-11 | 2019-10 | 2019-09 | 2019-08 | 2019-07 | 2019-06 | 2019-05 | 2019-04 | 2019-03 | 2019-02 | 2019-01 | 2018-12 | 2018-11 | 2018-10 |
|---|---|---|---|---|---|---|---|---|---|---|---|---|---|---|---|---|---|---|---|---|
| pm25 | 41 (Unhealthy for Sensitive Groups) | 33 (Moderate) | 26 (Moderate) | 31 (Moderate) | 52 (Unhealthy for Sensitive Groups) | 48 (Unhealthy for Sensitive Groups) | 26 (Moderate) | 31 (Moderate) | 22 (Moderate) | 26 (Moderate) | 27 (Moderate) | 30 (Moderate) | 34 (Moderate) | 41 (Unhealthy for Sensitive Groups) | 52 (Unhealthy for Sensitive Groups) | 43 (Unhealthy for Sensitive Groups) | 50 (Unhealthy for Sensitive Groups) | 36 (Unhealthy for Sensitive Groups) | 43 (Unhealthy for Sensitive Groups) | 33 (Moderate) |
| co | 715 (Good) | 527 (Good) | 634 (Good) | 750 (Good) | 923 (Good) | 941 (Good) | 674 (Good) | 707 (Good) | 664 (Good) | 562 (Good) | 550 (Good) | 455 (Good) | 502 (Good) | 593 (Good) | 751 (Good) | 858 (Good) | 934 (Good) | 760 (Good) | 797 (Good) | 671 (Good) |
| no2 | 40 (Moderate) | 43 (Moderate) | 35 (Good) | 29 (Good) | 47 (Moderate) | 67 (Moderate) | 50 (Moderate) | 47 (Moderate) | 37 (Good) | 32 (Good) | 35 (Good) | 31 (Good) | 46 (Moderate) | 55 (Moderate) | 60 (Moderate) | 40 (Good) | 59 (Moderate) | 51 (Moderate) | 59 (Moderate) | 48 (Moderate) |
| o3 | 143 (Unhealthy for Sensitive Groups) | 145 (Unhealthy for Sensitive Groups) | 116 (Moderate) | 97 (Moderate) | 77 (Moderate) | 75 (Moderate) | 100 (Moderate) | 112 (Moderate) | 121 (Unhealthy for Sensitive Groups) | 130 (Unhealthy for Sensitive Groups) | 139 (Unhealthy for Sensitive Groups) | 143 (Unhealthy for Sensitive Groups) | 154 (Unhealthy) | 127 (Unhealthy for Sensitive Groups) | 127 (Unhealthy for Sensitive Groups) | 94 (Moderate) | 78 (Moderate) | 68 (Good) | 101 (Moderate) | 121 (Unhealthy for Sensitive Groups) |
| pm10 | 49 (Moderate) | 59 (Unhealthy for Sensitive Groups) | 43 (Moderate) | 37 (Moderate) | 49 (Moderate) | 56 (Unhealthy for Sensitive Groups) | 62 (Unhealthy for Sensitive Groups) | 58 (Unhealthy for Sensitive Groups) | 34 (Moderate) | 35 (Moderate) | 34 (Moderate) | 33 (Moderate) | 53 (Unhealthy for Sensitive Groups) | 51 (Unhealthy for Sensitive Groups) | 69 (Unhealthy for Sensitive Groups) | 53 (Unhealthy for Sensitive Groups) | 61 (Unhealthy for Sensitive Groups) | 54 (Unhealthy for Sensitive Groups) | 54 (Unhealthy for Sensitive Groups) | 54 (Unhealthy for Sensitive Groups) |
| so2 | 7.5 (Good) | 8.7 (Good) | 7.8 (Good) | 6.8 (Good) | 6.6 (Good) | 7.3 (Good) | 6.6 (Good) | 6.4 (Good) | 5 (Good) | 3.6 (Good) | 4 (Good) | 5.4 (Good) | 6.7 (Good) | 3.9 (Good) | 4.7 (Good) | 6.8 (Good) | 9.1 (Good) | 8.4 (Good) | 8.3 (Good) | 9.6 (Good) |
PM2,5 61 (Unhealthy)
particulate matter (PM2.5) dustNO2 22 (Good)
nitrogen dioxide (NO2)PM10 69 (Unhealthy for Sensitive Groups)
particulate matter (PM10) suspended dustCO 219 (Good)
carbon monoxide (CO)O3 0.05 (Good)
ozone (O3)SO2 7.7 (Good)
sulfur dioxide (SO2)杨浦四漂
| index | 2022-05-27 |
|---|---|
| pm25 | 28 |
| no2 | 22 |
| pm10 | 35 |
| co | 579 |
| o3 | 22 |
| so2 | 4.6 |
杨浦四漂

| index | 2020-05 | 2020-04 | 2020-03 | 2020-02 | 2020-01 | 2019-12 | 2019-11 | 2019-10 | 2019-09 | 2019-08 | 2019-07 | 2019-06 | 2019-05 | 2019-04 | 2019-03 | 2019-02 | 2019-01 | 2018-12 | 2018-11 | 2018-10 |
|---|---|---|---|---|---|---|---|---|---|---|---|---|---|---|---|---|---|---|---|---|
| pm25 | 41 | 33 | 26 | 31 | 52 | 48 | 26 | 31 | 22 | 26 | 27 | 30 | 34 | 41 | 52 | 43 | 50 | 36 | 43 | 33 |
| co | 715 | 527 | 634 | 750 | 923 | 941 | 674 | 707 | 664 | 562 | 550 | 455 | 502 | 593 | 751 | 858 | 934 | 760 | 797 | 671 |
| no2 | 40 | 43 | 35 | 29 | 47 | 67 | 50 | 47 | 37 | 32 | 35 | 31 | 46 | 55 | 60 | 40 | 59 | 51 | 59 | 48 |
| o3 | 143 | 145 | 116 | 97 | 77 | 75 | 100 | 112 | 121 | 130 | 139 | 143 | 154 | 127 | 127 | 94 | 78 | 68 | 101 | 121 |
| pm10 | 49 | 59 | 43 | 37 | 49 | 56 | 62 | 58 | 34 | 35 | 34 | 33 | 53 | 51 | 69 | 53 | 61 | 54 | 54 | 54 |
| so2 | 7.5 | 8.7 | 7.8 | 6.8 | 6.6 | 7.3 | 6.6 | 6.4 | 5 | 3.6 | 4 | 5.4 | 6.7 | 3.9 | 4.7 | 6.8 | 9.1 | 8.4 | 8.3 | 9.6 |