Air Pollution in Yangqu: Real-time Air Quality Index and smog alert.
Pollution and air quality forecast for Yangqu. Today is Tuesday, June 16, 2026. The following air pollution values have been recorded for Yangqu:- particulate matter (PM2.5) dust - 61 (Unhealthy)
- nitrogen dioxide (NO2) - 22 (Good)
- particulate matter (PM10) suspended dust - 69 (Unhealthy for Sensitive Groups)
- carbon monoxide (CO) - 219 (Good)
- ozone (O3) - 0 (Good)
- sulfur dioxide (SO2) - 8 (Good)

What is the air quality in Yangqu today? Is the air polluted in Yangqu?. Is there smog?
What is the current level of PM2.5 in Yangqu? (particulate matter (PM2.5) dust)
Today's PM2.5 level is:
61 (Unhealthy)
For comparison, the highest level of PM2.5 in Yangqu in the last 7 days was: 28 (Friday, May 27, 2022) and the lowest: 28 (Friday, May 27, 2022).
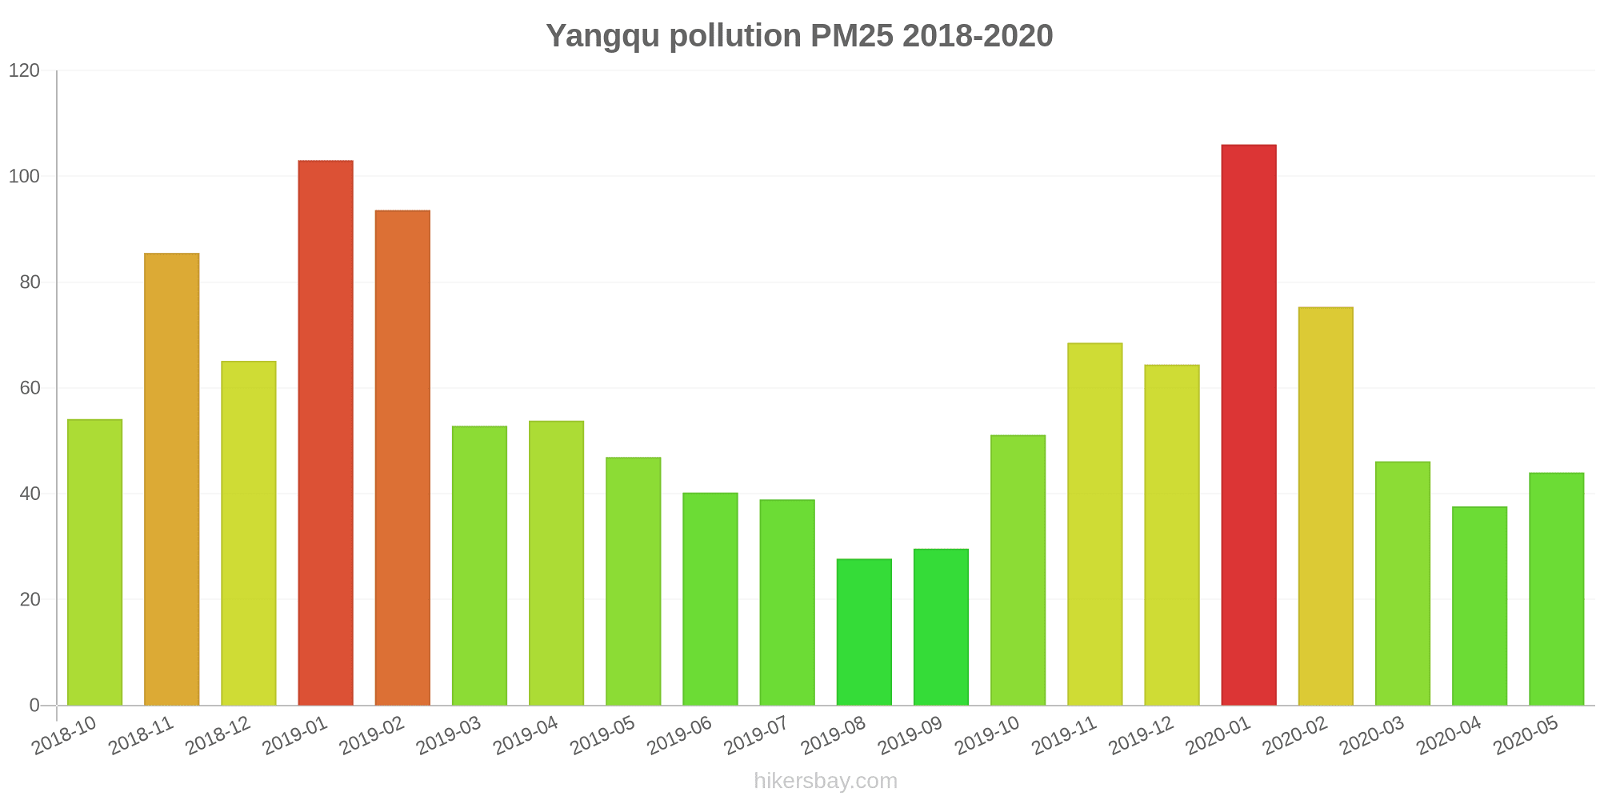
The highest PM2.5 values were recorded: 106 (January 2020).
The lowest level of particulate matter PM2.5 pollution occurs in month: August (28).
How high is the level of NO2? (nitrogen dioxide (NO2))
22 (Good)
What is the level of PM10 today in Yangqu? (particulate matter (PM10) suspended dust)
The current level of particulate matter PM10 in Yangqu is:
69 (Unhealthy for Sensitive Groups)
The highest PM10 values usually occur in month: 160 (January 2019).
The lowest value of particulate matter PM10 pollution in Yangqu is usually recorded in: August (47).
How high is the CO level? (carbon monoxide (CO))
219 (Good)
How is the O3 level today in Yangqu? (ozone (O3))
0 (Good)
What is the level of SO2 pollution? (sulfur dioxide (SO2))
8 (Good)
Current data Friday, May 27, 2022, 3:00 PM
PM2,5 61 (Unhealthy)
NO2 22 (Good)
PM10 69 (Unhealthy for Sensitive Groups)
CO 219 (Good)
O3 0 (Good)
SO2 8 (Good)
Data on air pollution from recent days in Yangqu
index
2022-05-27
pm25
28
Moderate
no2
22
Good
pm10
35
Moderate
co
579
Good
o3
22
Good
so2
5
Good
data source »
Air pollution in Yangqu from October 2018 to May 2020
index
2020-05
2020-04
2020-03
2020-02
2020-01
2019-12
2019-11
2019-10
2019-09
2019-08
2019-07
2019-06
2019-05
2019-04
2019-03
2019-02
2019-01
2018-12
2018-11
2018-10
pm25
44 (Unhealthy for Sensitive Groups)
38 (Unhealthy for Sensitive Groups)
46 (Unhealthy for Sensitive Groups)
75 (Very Unhealthy)
106 (Very Unhealthy)
64 (Unhealthy)
69 (Unhealthy)
51 (Unhealthy for Sensitive Groups)
30 (Moderate)
28 (Moderate)
39 (Unhealthy for Sensitive Groups)
40 (Unhealthy for Sensitive Groups)
47 (Unhealthy for Sensitive Groups)
54 (Unhealthy for Sensitive Groups)
53 (Unhealthy for Sensitive Groups)
94 (Very Unhealthy)
103 (Very Unhealthy)
65 (Unhealthy)
86 (Very Unhealthy)
54 (Unhealthy for Sensitive Groups)
co
703 (Good)
553 (Good)
559 (Good)
927 (Good)
1 (Good)
938 (Good)
882 (Good)
847 (Good)
646 (Good)
666 (Good)
721 (Good)
740 (Good)
650 (Good)
864 (Good)
844 (Good)
1 (Good)
1 (Good)
1 (Good)
1 (Good)
901 (Good)
no2
37 (Good)
46 (Moderate)
43 (Moderate)
38 (Good)
50 (Moderate)
51 (Moderate)
53 (Moderate)
43 (Moderate)
38 (Good)
31 (Good)
32 (Good)
34 (Good)
46 (Moderate)
48 (Moderate)
50 (Moderate)
49 (Moderate)
68 (Moderate)
57 (Moderate)
60 (Moderate)
51 (Moderate)
o3
167 (Unhealthy)
137 (Unhealthy for Sensitive Groups)
113 (Moderate)
93 (Moderate)
66 (Good)
52 (Good)
57 (Good)
91 (Moderate)
145 (Unhealthy for Sensitive Groups)
153 (Unhealthy)
199 (Very Unhealthy)
201 (Very Unhealthy)
150 (Unhealthy)
127 (Unhealthy for Sensitive Groups)
109 (Moderate)
80 (Moderate)
46 (Good)
46 (Good)
62 (Good)
89 (Moderate)
pm10
104 (Unhealthy)
99 (Unhealthy)
89 (Unhealthy)
98 (Unhealthy)
126 (Very Unhealthy)
104 (Unhealthy)
132 (Very Unhealthy)
98 (Unhealthy)
56 (Unhealthy for Sensitive Groups)
47 (Moderate)
57 (Unhealthy for Sensitive Groups)
62 (Unhealthy for Sensitive Groups)
103 (Unhealthy)
123 (Very Unhealthy)
105 (Unhealthy)
119 (Very Unhealthy)
160 (Very bad Hazardous)
132 (Very Unhealthy)
160 (Very bad Hazardous)
132 (Very Unhealthy)
so2
11 (Good)
12 (Good)
13 (Good)
16 (Good)
22 (Good)
20 (Good)
18 (Good)
13 (Good)
9.5 (Good)
7.2 (Good)
7.5 (Good)
9.5 (Good)
11 (Good)
15 (Good)
17 (Good)
28 (Good)
38 (Good)
33 (Good)
26 (Good)
17 (Good)
data source »
南寨
Friday, May 27, 2022, 3:00 PM
PM2,5 61 (Unhealthy)
particulate matter (PM2.5) dust
NO2 22 (Good)
nitrogen dioxide (NO2)
PM10 69 (Unhealthy for Sensitive Groups)
particulate matter (PM10) suspended dust
CO 219 (Good)
carbon monoxide (CO)
O3 0.05 (Good)
ozone (O3)
SO2 7.7 (Good)
sulfur dioxide (SO2)
南寨
index
2022-05-27
pm25
28
no2
22
pm10
35
co
579
o3
22
so2
4.6
南寨
2018-10 2020-05

index
2020-05
2020-04
2020-03
2020-02
2020-01
2019-12
2019-11
2019-10
2019-09
2019-08
2019-07
2019-06
2019-05
2019-04
2019-03
2019-02
2019-01
2018-12
2018-11
2018-10
pm25
44
38
46
75
106
64
69
51
30
28
39
40
47
54
53
94
103
65
86
54
co
703
553
559
927
1
938
882
847
646
666
721
740
650
864
844
1
1
1
1
901
no2
37
46
43
38
50
51
53
43
38
31
32
34
46
48
50
49
68
57
60
51
o3
167
137
113
93
66
52
57
91
145
153
199
201
150
127
109
80
46
46
62
89
pm10
104
99
89
98
126
104
132
98
56
47
57
62
103
123
105
119
160
132
160
132
so2
11
12
13
16
22
20
18
13
9.5
7.2
7.5
9.5
11
15
17
28
38
33
26
17
* Pollution data source:
https://openaq.org
(ChinaAQIData)
The data is licensed under CC-By 4.0
PM2,5 61 (Unhealthy)
NO2 22 (Good)
PM10 69 (Unhealthy for Sensitive Groups)
CO 219 (Good)
O3 0 (Good)
SO2 8 (Good)
Data on air pollution from recent days in Yangqu
| index | 2022-05-27 |
|---|---|
| pm25 | 28 Moderate |
| no2 | 22 Good |
| pm10 | 35 Moderate |
| co | 579 Good |
| o3 | 22 Good |
| so2 | 5 Good |

| index | 2020-05 | 2020-04 | 2020-03 | 2020-02 | 2020-01 | 2019-12 | 2019-11 | 2019-10 | 2019-09 | 2019-08 | 2019-07 | 2019-06 | 2019-05 | 2019-04 | 2019-03 | 2019-02 | 2019-01 | 2018-12 | 2018-11 | 2018-10 |
|---|---|---|---|---|---|---|---|---|---|---|---|---|---|---|---|---|---|---|---|---|
| pm25 | 44 (Unhealthy for Sensitive Groups) | 38 (Unhealthy for Sensitive Groups) | 46 (Unhealthy for Sensitive Groups) | 75 (Very Unhealthy) | 106 (Very Unhealthy) | 64 (Unhealthy) | 69 (Unhealthy) | 51 (Unhealthy for Sensitive Groups) | 30 (Moderate) | 28 (Moderate) | 39 (Unhealthy for Sensitive Groups) | 40 (Unhealthy for Sensitive Groups) | 47 (Unhealthy for Sensitive Groups) | 54 (Unhealthy for Sensitive Groups) | 53 (Unhealthy for Sensitive Groups) | 94 (Very Unhealthy) | 103 (Very Unhealthy) | 65 (Unhealthy) | 86 (Very Unhealthy) | 54 (Unhealthy for Sensitive Groups) |
| co | 703 (Good) | 553 (Good) | 559 (Good) | 927 (Good) | 1 (Good) | 938 (Good) | 882 (Good) | 847 (Good) | 646 (Good) | 666 (Good) | 721 (Good) | 740 (Good) | 650 (Good) | 864 (Good) | 844 (Good) | 1 (Good) | 1 (Good) | 1 (Good) | 1 (Good) | 901 (Good) |
| no2 | 37 (Good) | 46 (Moderate) | 43 (Moderate) | 38 (Good) | 50 (Moderate) | 51 (Moderate) | 53 (Moderate) | 43 (Moderate) | 38 (Good) | 31 (Good) | 32 (Good) | 34 (Good) | 46 (Moderate) | 48 (Moderate) | 50 (Moderate) | 49 (Moderate) | 68 (Moderate) | 57 (Moderate) | 60 (Moderate) | 51 (Moderate) |
| o3 | 167 (Unhealthy) | 137 (Unhealthy for Sensitive Groups) | 113 (Moderate) | 93 (Moderate) | 66 (Good) | 52 (Good) | 57 (Good) | 91 (Moderate) | 145 (Unhealthy for Sensitive Groups) | 153 (Unhealthy) | 199 (Very Unhealthy) | 201 (Very Unhealthy) | 150 (Unhealthy) | 127 (Unhealthy for Sensitive Groups) | 109 (Moderate) | 80 (Moderate) | 46 (Good) | 46 (Good) | 62 (Good) | 89 (Moderate) |
| pm10 | 104 (Unhealthy) | 99 (Unhealthy) | 89 (Unhealthy) | 98 (Unhealthy) | 126 (Very Unhealthy) | 104 (Unhealthy) | 132 (Very Unhealthy) | 98 (Unhealthy) | 56 (Unhealthy for Sensitive Groups) | 47 (Moderate) | 57 (Unhealthy for Sensitive Groups) | 62 (Unhealthy for Sensitive Groups) | 103 (Unhealthy) | 123 (Very Unhealthy) | 105 (Unhealthy) | 119 (Very Unhealthy) | 160 (Very bad Hazardous) | 132 (Very Unhealthy) | 160 (Very bad Hazardous) | 132 (Very Unhealthy) |
| so2 | 11 (Good) | 12 (Good) | 13 (Good) | 16 (Good) | 22 (Good) | 20 (Good) | 18 (Good) | 13 (Good) | 9.5 (Good) | 7.2 (Good) | 7.5 (Good) | 9.5 (Good) | 11 (Good) | 15 (Good) | 17 (Good) | 28 (Good) | 38 (Good) | 33 (Good) | 26 (Good) | 17 (Good) |
PM2,5 61 (Unhealthy)
particulate matter (PM2.5) dustNO2 22 (Good)
nitrogen dioxide (NO2)PM10 69 (Unhealthy for Sensitive Groups)
particulate matter (PM10) suspended dustCO 219 (Good)
carbon monoxide (CO)O3 0.05 (Good)
ozone (O3)SO2 7.7 (Good)
sulfur dioxide (SO2)南寨
| index | 2022-05-27 |
|---|---|
| pm25 | 28 |
| no2 | 22 |
| pm10 | 35 |
| co | 579 |
| o3 | 22 |
| so2 | 4.6 |
南寨

| index | 2020-05 | 2020-04 | 2020-03 | 2020-02 | 2020-01 | 2019-12 | 2019-11 | 2019-10 | 2019-09 | 2019-08 | 2019-07 | 2019-06 | 2019-05 | 2019-04 | 2019-03 | 2019-02 | 2019-01 | 2018-12 | 2018-11 | 2018-10 |
|---|---|---|---|---|---|---|---|---|---|---|---|---|---|---|---|---|---|---|---|---|
| pm25 | 44 | 38 | 46 | 75 | 106 | 64 | 69 | 51 | 30 | 28 | 39 | 40 | 47 | 54 | 53 | 94 | 103 | 65 | 86 | 54 |
| co | 703 | 553 | 559 | 927 | 1 | 938 | 882 | 847 | 646 | 666 | 721 | 740 | 650 | 864 | 844 | 1 | 1 | 1 | 1 | 901 |
| no2 | 37 | 46 | 43 | 38 | 50 | 51 | 53 | 43 | 38 | 31 | 32 | 34 | 46 | 48 | 50 | 49 | 68 | 57 | 60 | 51 |
| o3 | 167 | 137 | 113 | 93 | 66 | 52 | 57 | 91 | 145 | 153 | 199 | 201 | 150 | 127 | 109 | 80 | 46 | 46 | 62 | 89 |
| pm10 | 104 | 99 | 89 | 98 | 126 | 104 | 132 | 98 | 56 | 47 | 57 | 62 | 103 | 123 | 105 | 119 | 160 | 132 | 160 | 132 |
| so2 | 11 | 12 | 13 | 16 | 22 | 20 | 18 | 13 | 9.5 | 7.2 | 7.5 | 9.5 | 11 | 15 | 17 | 28 | 38 | 33 | 26 | 17 |