Air Pollution in Yanshenzhen: Real-time Air Quality Index and smog alert.
Pollution and air quality forecast for Yanshenzhen. Today is Tuesday, June 16, 2026. The following air pollution values have been recorded for Yanshenzhen:- particulate matter (PM2.5) dust - 61 (Unhealthy)
- nitrogen dioxide (NO2) - 22 (Good)
- particulate matter (PM10) suspended dust - 69 (Unhealthy for Sensitive Groups)
- carbon monoxide (CO) - 219 (Good)
- ozone (O3) - 0 (Good)
- sulfur dioxide (SO2) - 8 (Good)

What is the air quality in Yanshenzhen today? Is the air polluted in Yanshenzhen?. Is there smog?
What is the current level of PM2.5 in Yanshenzhen? (particulate matter (PM2.5) dust)
Today's PM2.5 level is:
61 (Unhealthy)
For comparison, the highest level of PM2.5 in Yanshenzhen in the last 7 days was: 28 (Friday, May 27, 2022) and the lowest: 28 (Friday, May 27, 2022).
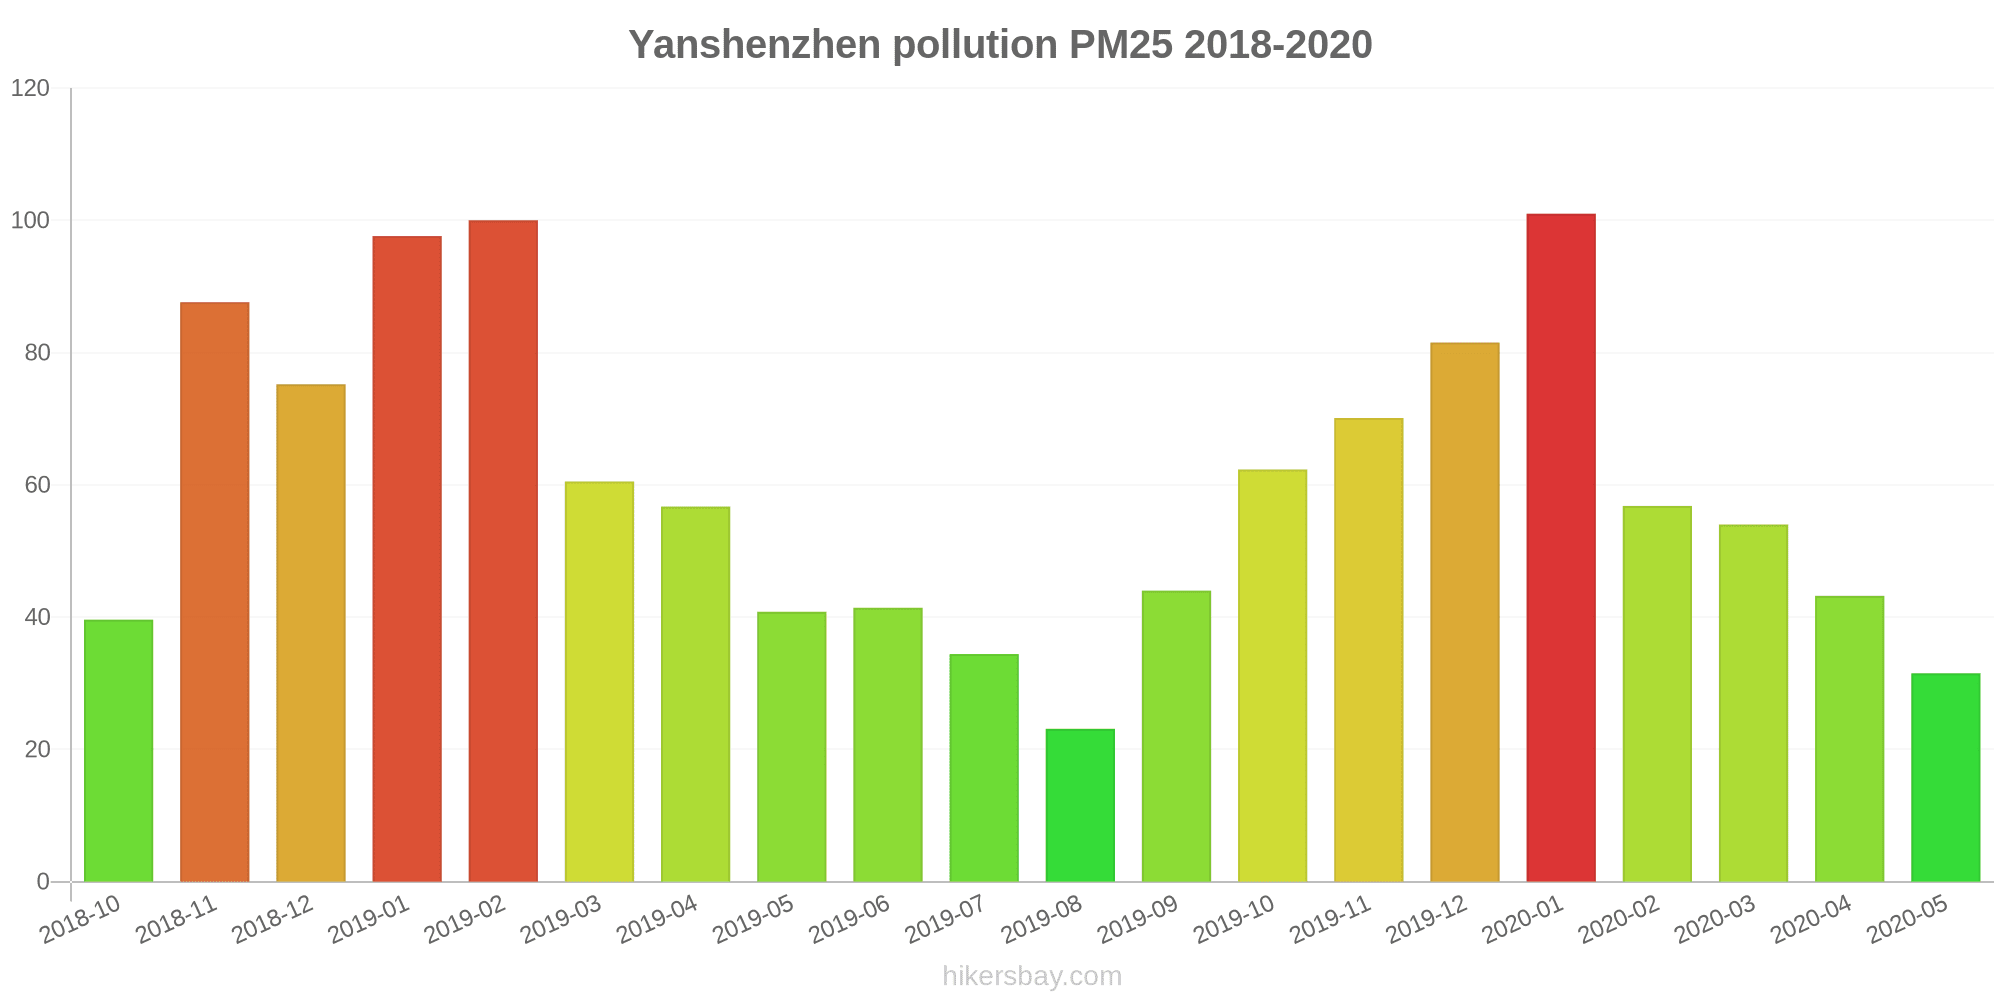
The highest PM2.5 values were recorded: 101 (January 2020).
The lowest level of particulate matter PM2.5 pollution occurs in month: August (23).
How high is the level of NO2? (nitrogen dioxide (NO2))
22 (Good)
What is the level of PM10 today in Yanshenzhen? (particulate matter (PM10) suspended dust)
The current level of particulate matter PM10 in Yanshenzhen is:
69 (Unhealthy for Sensitive Groups)
The highest PM10 values usually occur in month: 152 (November 2018).
The lowest value of particulate matter PM10 pollution in Yanshenzhen is usually recorded in: August (39).
How high is the CO level? (carbon monoxide (CO))
219 (Good)
How is the O3 level today in Yanshenzhen? (ozone (O3))
0 (Good)
What is the level of SO2 pollution? (sulfur dioxide (SO2))
8 (Good)
Current data Friday, May 27, 2022, 3:00 PM
PM2,5 61 (Unhealthy)
NO2 22 (Good)
PM10 69 (Unhealthy for Sensitive Groups)
CO 219 (Good)
O3 0 (Good)
SO2 8 (Good)
Data on air pollution from recent days in Yanshenzhen
index
2022-05-27
pm25
28
Moderate
no2
22
Good
pm10
35
Moderate
co
579
Good
o3
22
Good
so2
5
Good
data source »
Air pollution in Yanshenzhen from October 2018 to May 2020

index
2020-05
2020-04
2020-03
2020-02
2020-01
2019-12
2019-11
2019-10
2019-09
2019-08
2019-07
2019-06
2019-05
2019-04
2019-03
2019-02
2019-01
2018-12
2018-11
2018-10
pm25
32 (Moderate)
43 (Unhealthy for Sensitive Groups)
54 (Unhealthy for Sensitive Groups)
57 (Unhealthy)
101 (Very Unhealthy)
82 (Very Unhealthy)
70 (Unhealthy)
62 (Unhealthy)
44 (Unhealthy for Sensitive Groups)
23 (Moderate)
34 (Moderate)
41 (Unhealthy for Sensitive Groups)
41 (Unhealthy for Sensitive Groups)
57 (Unhealthy)
61 (Unhealthy)
100 (Very Unhealthy)
98 (Very Unhealthy)
75 (Very Unhealthy)
88 (Very Unhealthy)
40 (Unhealthy for Sensitive Groups)
co
433 (Good)
511 (Good)
588 (Good)
806 (Good)
1 (Good)
1 (Good)
939 (Good)
749 (Good)
695 (Good)
511 (Good)
502 (Good)
579 (Good)
625 (Good)
674 (Good)
692 (Good)
1 (Good)
1 (Good)
1 (Good)
1 (Good)
906 (Good)
no2
18 (Good)
24 (Good)
24 (Good)
20 (Good)
40 (Good)
47 (Moderate)
43 (Moderate)
37 (Good)
30 (Good)
22 (Good)
21 (Good)
27 (Good)
28 (Good)
37 (Good)
37 (Good)
39 (Good)
50 (Moderate)
50 (Moderate)
46 (Moderate)
41 (Moderate)
o3
170 (Unhealthy)
148 (Unhealthy for Sensitive Groups)
120 (Unhealthy for Sensitive Groups)
100 (Moderate)
78 (Moderate)
68 (Good)
91 (Moderate)
131 (Unhealthy for Sensitive Groups)
187 (Very Unhealthy)
150 (Unhealthy)
203 (Very Unhealthy)
226 (Very Unhealthy)
187 (Very Unhealthy)
151 (Unhealthy)
128 (Unhealthy for Sensitive Groups)
102 (Moderate)
72 (Moderate)
60 (Good)
91 (Moderate)
105 (Moderate)
pm10
58 (Unhealthy for Sensitive Groups)
82 (Unhealthy)
95 (Unhealthy)
71 (Unhealthy for Sensitive Groups)
138 (Very Unhealthy)
114 (Very Unhealthy)
120 (Very Unhealthy)
105 (Unhealthy)
73 (Unhealthy for Sensitive Groups)
39 (Moderate)
53 (Unhealthy for Sensitive Groups)
72 (Unhealthy for Sensitive Groups)
79 (Unhealthy for Sensitive Groups)
102 (Unhealthy)
111 (Very Unhealthy)
140 (Very Unhealthy)
151 (Very bad Hazardous)
136 (Very Unhealthy)
152 (Very bad Hazardous)
88 (Unhealthy)
so2
9.7 (Good)
14 (Good)
15 (Good)
12 (Good)
24 (Good)
23 (Good)
20 (Good)
19 (Good)
12 (Good)
10 (Good)
15 (Good)
17 (Good)
17 (Good)
22 (Good)
22 (Good)
23 (Good)
33 (Good)
28 (Good)
22 (Good)
19 (Good)
data source »
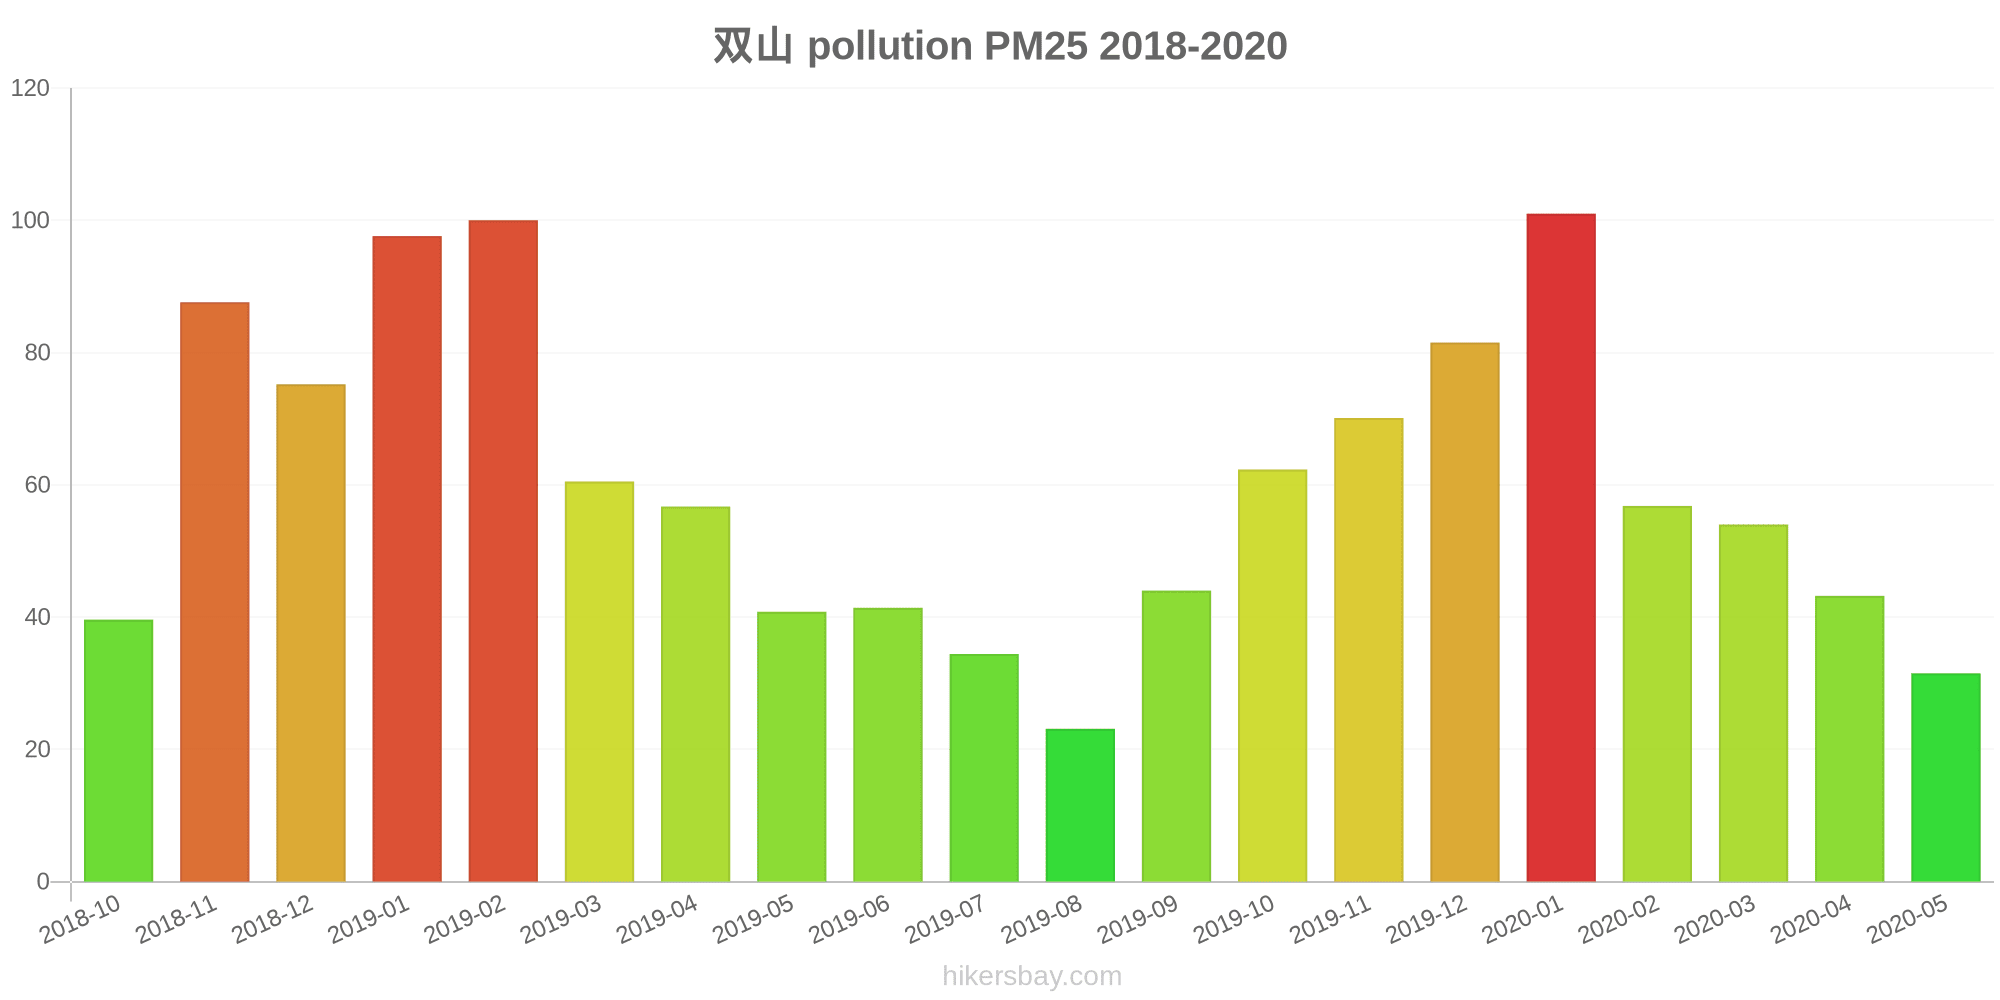
双山
Friday, May 27, 2022, 3:00 PM
PM2,5 61 (Unhealthy)
particulate matter (PM2.5) dust
NO2 22 (Good)
nitrogen dioxide (NO2)
PM10 69 (Unhealthy for Sensitive Groups)
particulate matter (PM10) suspended dust
CO 219 (Good)
carbon monoxide (CO)
O3 0.05 (Good)
ozone (O3)
SO2 7.7 (Good)
sulfur dioxide (SO2)
双山
index
2022-05-27
pm25
28
no2
22
pm10
35
co
579
o3
22
so2
4.6
双山
2018-10 2020-05

index
2020-05
2020-04
2020-03
2020-02
2020-01
2019-12
2019-11
2019-10
2019-09
2019-08
2019-07
2019-06
2019-05
2019-04
2019-03
2019-02
2019-01
2018-12
2018-11
2018-10
pm25
32
43
54
57
101
82
70
62
44
23
34
41
41
57
61
100
98
75
88
40
co
433
511
588
806
1
1
939
749
695
511
502
579
625
674
692
1
1
1
1
906
no2
18
24
24
20
40
47
43
37
30
22
21
27
28
37
37
39
50
50
46
41
o3
170
148
120
100
78
68
91
131
187
150
203
226
187
151
128
102
72
60
91
105
pm10
58
82
95
71
138
114
120
105
73
39
53
72
79
102
111
140
151
136
152
88
so2
9.7
14
15
12
24
23
20
19
12
10
15
17
17
22
22
23
33
28
22
19
* Pollution data source:
https://openaq.org
(ChinaAQIData)
The data is licensed under CC-By 4.0
PM2,5 61 (Unhealthy)
NO2 22 (Good)
PM10 69 (Unhealthy for Sensitive Groups)
CO 219 (Good)
O3 0 (Good)
SO2 8 (Good)
Data on air pollution from recent days in Yanshenzhen
| index | 2022-05-27 |
|---|---|
| pm25 | 28 Moderate |
| no2 | 22 Good |
| pm10 | 35 Moderate |
| co | 579 Good |
| o3 | 22 Good |
| so2 | 5 Good |
| index | 2020-05 | 2020-04 | 2020-03 | 2020-02 | 2020-01 | 2019-12 | 2019-11 | 2019-10 | 2019-09 | 2019-08 | 2019-07 | 2019-06 | 2019-05 | 2019-04 | 2019-03 | 2019-02 | 2019-01 | 2018-12 | 2018-11 | 2018-10 |
|---|---|---|---|---|---|---|---|---|---|---|---|---|---|---|---|---|---|---|---|---|
| pm25 | 32 (Moderate) | 43 (Unhealthy for Sensitive Groups) | 54 (Unhealthy for Sensitive Groups) | 57 (Unhealthy) | 101 (Very Unhealthy) | 82 (Very Unhealthy) | 70 (Unhealthy) | 62 (Unhealthy) | 44 (Unhealthy for Sensitive Groups) | 23 (Moderate) | 34 (Moderate) | 41 (Unhealthy for Sensitive Groups) | 41 (Unhealthy for Sensitive Groups) | 57 (Unhealthy) | 61 (Unhealthy) | 100 (Very Unhealthy) | 98 (Very Unhealthy) | 75 (Very Unhealthy) | 88 (Very Unhealthy) | 40 (Unhealthy for Sensitive Groups) |
| co | 433 (Good) | 511 (Good) | 588 (Good) | 806 (Good) | 1 (Good) | 1 (Good) | 939 (Good) | 749 (Good) | 695 (Good) | 511 (Good) | 502 (Good) | 579 (Good) | 625 (Good) | 674 (Good) | 692 (Good) | 1 (Good) | 1 (Good) | 1 (Good) | 1 (Good) | 906 (Good) |
| no2 | 18 (Good) | 24 (Good) | 24 (Good) | 20 (Good) | 40 (Good) | 47 (Moderate) | 43 (Moderate) | 37 (Good) | 30 (Good) | 22 (Good) | 21 (Good) | 27 (Good) | 28 (Good) | 37 (Good) | 37 (Good) | 39 (Good) | 50 (Moderate) | 50 (Moderate) | 46 (Moderate) | 41 (Moderate) |
| o3 | 170 (Unhealthy) | 148 (Unhealthy for Sensitive Groups) | 120 (Unhealthy for Sensitive Groups) | 100 (Moderate) | 78 (Moderate) | 68 (Good) | 91 (Moderate) | 131 (Unhealthy for Sensitive Groups) | 187 (Very Unhealthy) | 150 (Unhealthy) | 203 (Very Unhealthy) | 226 (Very Unhealthy) | 187 (Very Unhealthy) | 151 (Unhealthy) | 128 (Unhealthy for Sensitive Groups) | 102 (Moderate) | 72 (Moderate) | 60 (Good) | 91 (Moderate) | 105 (Moderate) |
| pm10 | 58 (Unhealthy for Sensitive Groups) | 82 (Unhealthy) | 95 (Unhealthy) | 71 (Unhealthy for Sensitive Groups) | 138 (Very Unhealthy) | 114 (Very Unhealthy) | 120 (Very Unhealthy) | 105 (Unhealthy) | 73 (Unhealthy for Sensitive Groups) | 39 (Moderate) | 53 (Unhealthy for Sensitive Groups) | 72 (Unhealthy for Sensitive Groups) | 79 (Unhealthy for Sensitive Groups) | 102 (Unhealthy) | 111 (Very Unhealthy) | 140 (Very Unhealthy) | 151 (Very bad Hazardous) | 136 (Very Unhealthy) | 152 (Very bad Hazardous) | 88 (Unhealthy) |
| so2 | 9.7 (Good) | 14 (Good) | 15 (Good) | 12 (Good) | 24 (Good) | 23 (Good) | 20 (Good) | 19 (Good) | 12 (Good) | 10 (Good) | 15 (Good) | 17 (Good) | 17 (Good) | 22 (Good) | 22 (Good) | 23 (Good) | 33 (Good) | 28 (Good) | 22 (Good) | 19 (Good) |
PM2,5 61 (Unhealthy)
particulate matter (PM2.5) dustNO2 22 (Good)
nitrogen dioxide (NO2)PM10 69 (Unhealthy for Sensitive Groups)
particulate matter (PM10) suspended dustCO 219 (Good)
carbon monoxide (CO)O3 0.05 (Good)
ozone (O3)SO2 7.7 (Good)
sulfur dioxide (SO2)双山
| index | 2022-05-27 |
|---|---|
| pm25 | 28 |
| no2 | 22 |
| pm10 | 35 |
| co | 579 |
| o3 | 22 |
| so2 | 4.6 |
双山
| index | 2020-05 | 2020-04 | 2020-03 | 2020-02 | 2020-01 | 2019-12 | 2019-11 | 2019-10 | 2019-09 | 2019-08 | 2019-07 | 2019-06 | 2019-05 | 2019-04 | 2019-03 | 2019-02 | 2019-01 | 2018-12 | 2018-11 | 2018-10 |
|---|---|---|---|---|---|---|---|---|---|---|---|---|---|---|---|---|---|---|---|---|
| pm25 | 32 | 43 | 54 | 57 | 101 | 82 | 70 | 62 | 44 | 23 | 34 | 41 | 41 | 57 | 61 | 100 | 98 | 75 | 88 | 40 |
| co | 433 | 511 | 588 | 806 | 1 | 1 | 939 | 749 | 695 | 511 | 502 | 579 | 625 | 674 | 692 | 1 | 1 | 1 | 1 | 906 |
| no2 | 18 | 24 | 24 | 20 | 40 | 47 | 43 | 37 | 30 | 22 | 21 | 27 | 28 | 37 | 37 | 39 | 50 | 50 | 46 | 41 |
| o3 | 170 | 148 | 120 | 100 | 78 | 68 | 91 | 131 | 187 | 150 | 203 | 226 | 187 | 151 | 128 | 102 | 72 | 60 | 91 | 105 |
| pm10 | 58 | 82 | 95 | 71 | 138 | 114 | 120 | 105 | 73 | 39 | 53 | 72 | 79 | 102 | 111 | 140 | 151 | 136 | 152 | 88 |
| so2 | 9.7 | 14 | 15 | 12 | 24 | 23 | 20 | 19 | 12 | 10 | 15 | 17 | 17 | 22 | 22 | 23 | 33 | 28 | 22 | 19 |