Air Pollution in Yijing: Real-time Air Quality Index and smog alert.
Pollution and air quality forecast for Yijing. Today is Tuesday, June 16, 2026. The following air pollution values have been recorded for Yijing:- particulate matter (PM2.5) dust - 61 (Unhealthy)
- nitrogen dioxide (NO2) - 22 (Good)
- particulate matter (PM10) suspended dust - 69 (Unhealthy for Sensitive Groups)
- carbon monoxide (CO) - 219 (Good)
- ozone (O3) - 0 (Good)
- sulfur dioxide (SO2) - 8 (Good)

What is the air quality in Yijing today? Is the air polluted in Yijing?. Is there smog?
What is the current level of PM2.5 in Yijing? (particulate matter (PM2.5) dust)
Today's PM2.5 level is:
61 (Unhealthy)
For comparison, the highest level of PM2.5 in Yijing in the last 7 days was: 28 (Friday, May 27, 2022) and the lowest: 28 (Friday, May 27, 2022).
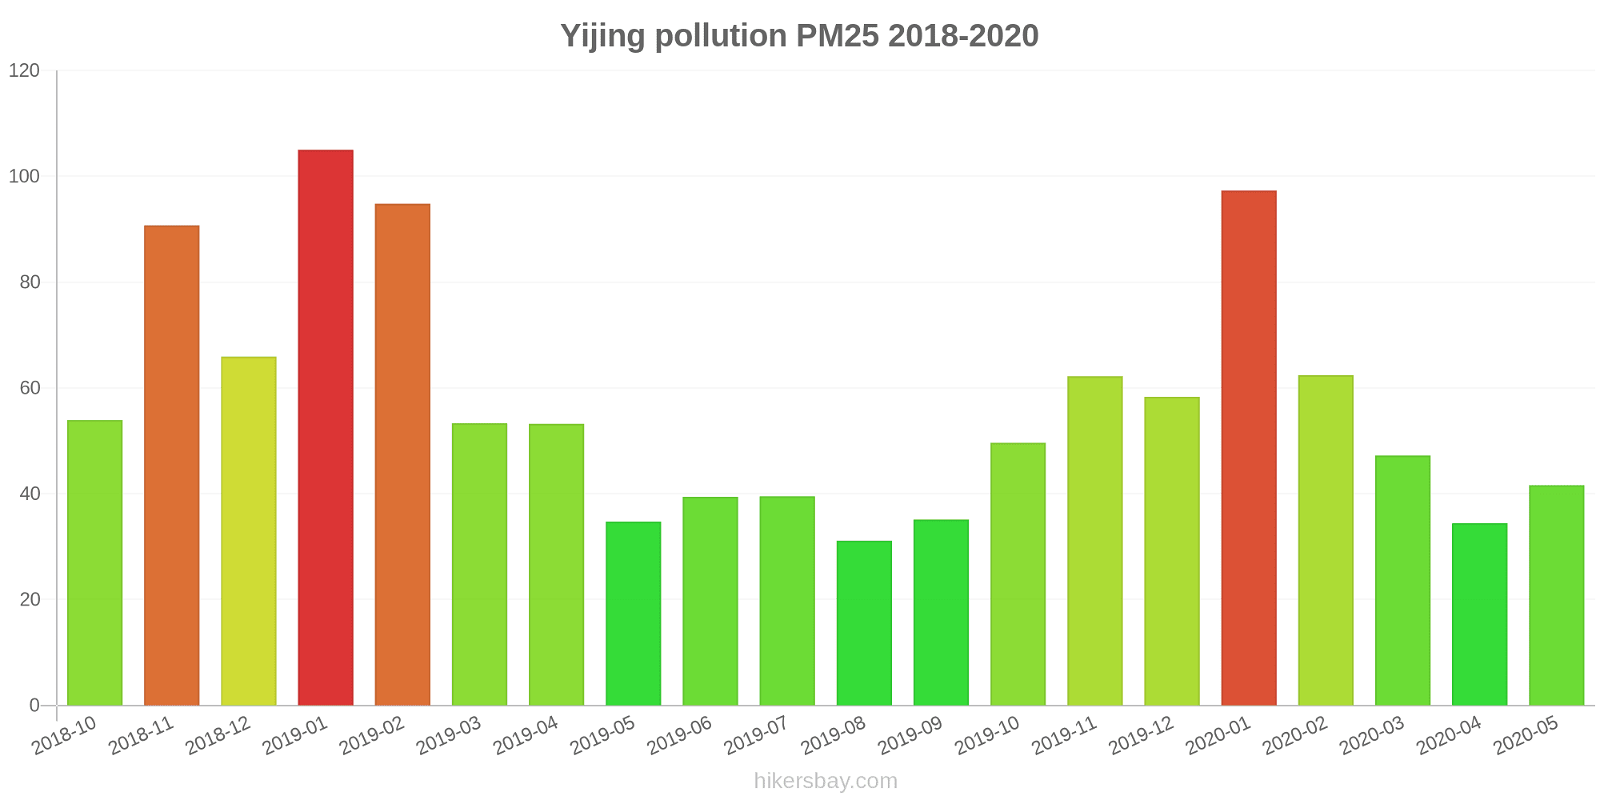
The highest PM2.5 values were recorded: 105 (January 2019).
The lowest level of particulate matter PM2.5 pollution occurs in month: August (31).
How high is the level of NO2? (nitrogen dioxide (NO2))
22 (Good)
What is the level of PM10 today in Yijing? (particulate matter (PM10) suspended dust)
The current level of particulate matter PM10 in Yijing is:
69 (Unhealthy for Sensitive Groups)
The highest PM10 values usually occur in month: 153 (January 2019).
The lowest value of particulate matter PM10 pollution in Yijing is usually recorded in: August (50).
How high is the CO level? (carbon monoxide (CO))
219 (Good)
How is the O3 level today in Yijing? (ozone (O3))
0 (Good)
What is the level of SO2 pollution? (sulfur dioxide (SO2))
8 (Good)
Current data Friday, May 27, 2022, 3:00 PM
PM2,5 61 (Unhealthy)
NO2 22 (Good)
PM10 69 (Unhealthy for Sensitive Groups)
CO 219 (Good)
O3 0 (Good)
SO2 8 (Good)
Data on air pollution from recent days in Yijing
index
2022-05-27
pm25
28
Moderate
no2
22
Good
pm10
35
Moderate
co
579
Good
o3
22
Good
so2
5
Good
data source »
Air pollution in Yijing from October 2018 to May 2020
index
2020-05
2020-04
2020-03
2020-02
2020-01
2019-12
2019-11
2019-10
2019-09
2019-08
2019-07
2019-06
2019-05
2019-04
2019-03
2019-02
2019-01
2018-12
2018-11
2018-10
pm25
42 (Unhealthy for Sensitive Groups)
34 (Moderate)
47 (Unhealthy for Sensitive Groups)
62 (Unhealthy)
97 (Very Unhealthy)
58 (Unhealthy)
62 (Unhealthy)
50 (Unhealthy for Sensitive Groups)
35 (Unhealthy for Sensitive Groups)
31 (Moderate)
40 (Unhealthy for Sensitive Groups)
39 (Unhealthy for Sensitive Groups)
35 (Moderate)
53 (Unhealthy for Sensitive Groups)
53 (Unhealthy for Sensitive Groups)
95 (Very Unhealthy)
105 (Very Unhealthy)
66 (Unhealthy)
91 (Very Unhealthy)
54 (Unhealthy for Sensitive Groups)
co
842 (Good)
710 (Good)
889 (Good)
1 (Good)
1 (Good)
1 (Good)
1 (Good)
1 (Good)
929 (Good)
970 (Good)
941 (Good)
781 (Good)
703 (Good)
876 (Good)
1 (Good)
1 (Good)
2 (Good)
1 (Good)
1 (Good)
973 (Good)
no2
32 (Good)
39 (Good)
38 (Good)
34 (Good)
55 (Moderate)
53 (Moderate)
53 (Moderate)
40 (Good)
35 (Good)
29 (Good)
29 (Good)
30 (Good)
34 (Good)
35 (Good)
39 (Good)
42 (Moderate)
66 (Moderate)
53 (Moderate)
57 (Moderate)
41 (Moderate)
o3
149 (Unhealthy for Sensitive Groups)
130 (Unhealthy for Sensitive Groups)
106 (Moderate)
88 (Moderate)
69 (Good)
56 (Good)
63 (Good)
99 (Moderate)
151 (Unhealthy)
150 (Unhealthy)
191 (Very Unhealthy)
207 (Very Unhealthy)
167 (Unhealthy)
132 (Unhealthy for Sensitive Groups)
118 (Moderate)
90 (Moderate)
53 (Good)
63 (Good)
69 (Good)
99 (Moderate)
pm10
79 (Unhealthy for Sensitive Groups)
72 (Unhealthy for Sensitive Groups)
83 (Unhealthy)
82 (Unhealthy)
118 (Very Unhealthy)
88 (Unhealthy)
105 (Unhealthy)
80 (Unhealthy)
57 (Unhealthy for Sensitive Groups)
50 (Moderate)
57 (Unhealthy for Sensitive Groups)
64 (Unhealthy for Sensitive Groups)
74 (Unhealthy for Sensitive Groups)
91 (Unhealthy)
86 (Unhealthy)
125 (Very Unhealthy)
153 (Very bad Hazardous)
112 (Very Unhealthy)
149 (Very Unhealthy)
93 (Unhealthy)
so2
15 (Good)
16 (Good)
18 (Good)
19 (Good)
39 (Good)
31 (Good)
22 (Good)
12 (Good)
9.9 (Good)
12 (Good)
16 (Good)
20 (Good)
20 (Good)
19 (Good)
26 (Good)
36 (Good)
76 (Moderate)
45 (Good)
43 (Good)
24 (Good)
data source »
南庄
Friday, May 27, 2022, 3:00 PM
PM2,5 61 (Unhealthy)
particulate matter (PM2.5) dust
NO2 22 (Good)
nitrogen dioxide (NO2)
PM10 69 (Unhealthy for Sensitive Groups)
particulate matter (PM10) suspended dust
CO 219 (Good)
carbon monoxide (CO)
O3 0.05 (Good)
ozone (O3)
SO2 7.7 (Good)
sulfur dioxide (SO2)
南庄
index
2022-05-27
pm25
28
no2
22
pm10
35
co
579
o3
22
so2
4.6
南庄
2018-10 2020-05

index
2020-05
2020-04
2020-03
2020-02
2020-01
2019-12
2019-11
2019-10
2019-09
2019-08
2019-07
2019-06
2019-05
2019-04
2019-03
2019-02
2019-01
2018-12
2018-11
2018-10
pm25
42
34
47
62
97
58
62
50
35
31
40
39
35
53
53
95
105
66
91
54
co
842
710
889
1
1
1
1
1
929
970
941
781
703
876
1
1
2
1
1
973
no2
32
39
38
34
55
53
53
40
35
29
29
30
34
35
39
42
66
53
57
41
o3
149
130
106
88
69
56
63
99
151
150
191
207
167
132
118
90
53
63
69
99
pm10
79
72
83
82
118
88
105
80
57
50
57
64
74
91
86
125
153
112
149
93
so2
15
16
18
19
39
31
22
12
9.9
12
16
20
20
19
26
36
76
45
43
24
* Pollution data source:
https://openaq.org
(ChinaAQIData)
The data is licensed under CC-By 4.0
PM2,5 61 (Unhealthy)
NO2 22 (Good)
PM10 69 (Unhealthy for Sensitive Groups)
CO 219 (Good)
O3 0 (Good)
SO2 8 (Good)
Data on air pollution from recent days in Yijing
| index | 2022-05-27 |
|---|---|
| pm25 | 28 Moderate |
| no2 | 22 Good |
| pm10 | 35 Moderate |
| co | 579 Good |
| o3 | 22 Good |
| so2 | 5 Good |

| index | 2020-05 | 2020-04 | 2020-03 | 2020-02 | 2020-01 | 2019-12 | 2019-11 | 2019-10 | 2019-09 | 2019-08 | 2019-07 | 2019-06 | 2019-05 | 2019-04 | 2019-03 | 2019-02 | 2019-01 | 2018-12 | 2018-11 | 2018-10 |
|---|---|---|---|---|---|---|---|---|---|---|---|---|---|---|---|---|---|---|---|---|
| pm25 | 42 (Unhealthy for Sensitive Groups) | 34 (Moderate) | 47 (Unhealthy for Sensitive Groups) | 62 (Unhealthy) | 97 (Very Unhealthy) | 58 (Unhealthy) | 62 (Unhealthy) | 50 (Unhealthy for Sensitive Groups) | 35 (Unhealthy for Sensitive Groups) | 31 (Moderate) | 40 (Unhealthy for Sensitive Groups) | 39 (Unhealthy for Sensitive Groups) | 35 (Moderate) | 53 (Unhealthy for Sensitive Groups) | 53 (Unhealthy for Sensitive Groups) | 95 (Very Unhealthy) | 105 (Very Unhealthy) | 66 (Unhealthy) | 91 (Very Unhealthy) | 54 (Unhealthy for Sensitive Groups) |
| co | 842 (Good) | 710 (Good) | 889 (Good) | 1 (Good) | 1 (Good) | 1 (Good) | 1 (Good) | 1 (Good) | 929 (Good) | 970 (Good) | 941 (Good) | 781 (Good) | 703 (Good) | 876 (Good) | 1 (Good) | 1 (Good) | 2 (Good) | 1 (Good) | 1 (Good) | 973 (Good) |
| no2 | 32 (Good) | 39 (Good) | 38 (Good) | 34 (Good) | 55 (Moderate) | 53 (Moderate) | 53 (Moderate) | 40 (Good) | 35 (Good) | 29 (Good) | 29 (Good) | 30 (Good) | 34 (Good) | 35 (Good) | 39 (Good) | 42 (Moderate) | 66 (Moderate) | 53 (Moderate) | 57 (Moderate) | 41 (Moderate) |
| o3 | 149 (Unhealthy for Sensitive Groups) | 130 (Unhealthy for Sensitive Groups) | 106 (Moderate) | 88 (Moderate) | 69 (Good) | 56 (Good) | 63 (Good) | 99 (Moderate) | 151 (Unhealthy) | 150 (Unhealthy) | 191 (Very Unhealthy) | 207 (Very Unhealthy) | 167 (Unhealthy) | 132 (Unhealthy for Sensitive Groups) | 118 (Moderate) | 90 (Moderate) | 53 (Good) | 63 (Good) | 69 (Good) | 99 (Moderate) |
| pm10 | 79 (Unhealthy for Sensitive Groups) | 72 (Unhealthy for Sensitive Groups) | 83 (Unhealthy) | 82 (Unhealthy) | 118 (Very Unhealthy) | 88 (Unhealthy) | 105 (Unhealthy) | 80 (Unhealthy) | 57 (Unhealthy for Sensitive Groups) | 50 (Moderate) | 57 (Unhealthy for Sensitive Groups) | 64 (Unhealthy for Sensitive Groups) | 74 (Unhealthy for Sensitive Groups) | 91 (Unhealthy) | 86 (Unhealthy) | 125 (Very Unhealthy) | 153 (Very bad Hazardous) | 112 (Very Unhealthy) | 149 (Very Unhealthy) | 93 (Unhealthy) |
| so2 | 15 (Good) | 16 (Good) | 18 (Good) | 19 (Good) | 39 (Good) | 31 (Good) | 22 (Good) | 12 (Good) | 9.9 (Good) | 12 (Good) | 16 (Good) | 20 (Good) | 20 (Good) | 19 (Good) | 26 (Good) | 36 (Good) | 76 (Moderate) | 45 (Good) | 43 (Good) | 24 (Good) |
PM2,5 61 (Unhealthy)
particulate matter (PM2.5) dustNO2 22 (Good)
nitrogen dioxide (NO2)PM10 69 (Unhealthy for Sensitive Groups)
particulate matter (PM10) suspended dustCO 219 (Good)
carbon monoxide (CO)O3 0.05 (Good)
ozone (O3)SO2 7.7 (Good)
sulfur dioxide (SO2)南庄
| index | 2022-05-27 |
|---|---|
| pm25 | 28 |
| no2 | 22 |
| pm10 | 35 |
| co | 579 |
| o3 | 22 |
| so2 | 4.6 |
南庄

| index | 2020-05 | 2020-04 | 2020-03 | 2020-02 | 2020-01 | 2019-12 | 2019-11 | 2019-10 | 2019-09 | 2019-08 | 2019-07 | 2019-06 | 2019-05 | 2019-04 | 2019-03 | 2019-02 | 2019-01 | 2018-12 | 2018-11 | 2018-10 |
|---|---|---|---|---|---|---|---|---|---|---|---|---|---|---|---|---|---|---|---|---|
| pm25 | 42 | 34 | 47 | 62 | 97 | 58 | 62 | 50 | 35 | 31 | 40 | 39 | 35 | 53 | 53 | 95 | 105 | 66 | 91 | 54 |
| co | 842 | 710 | 889 | 1 | 1 | 1 | 1 | 1 | 929 | 970 | 941 | 781 | 703 | 876 | 1 | 1 | 2 | 1 | 1 | 973 |
| no2 | 32 | 39 | 38 | 34 | 55 | 53 | 53 | 40 | 35 | 29 | 29 | 30 | 34 | 35 | 39 | 42 | 66 | 53 | 57 | 41 |
| o3 | 149 | 130 | 106 | 88 | 69 | 56 | 63 | 99 | 151 | 150 | 191 | 207 | 167 | 132 | 118 | 90 | 53 | 63 | 69 | 99 |
| pm10 | 79 | 72 | 83 | 82 | 118 | 88 | 105 | 80 | 57 | 50 | 57 | 64 | 74 | 91 | 86 | 125 | 153 | 112 | 149 | 93 |
| so2 | 15 | 16 | 18 | 19 | 39 | 31 | 22 | 12 | 9.9 | 12 | 16 | 20 | 20 | 19 | 26 | 36 | 76 | 45 | 43 | 24 |