Air Pollution in Yingwanzhen: Real-time Air Quality Index and smog alert.
Pollution and air quality forecast for Yingwanzhen. Today is Tuesday, June 16, 2026. The following air pollution values have been recorded for Yingwanzhen:- particulate matter (PM2.5) dust - 61 (Unhealthy)
- nitrogen dioxide (NO2) - 22 (Good)
- particulate matter (PM10) suspended dust - 69 (Unhealthy for Sensitive Groups)
- carbon monoxide (CO) - 219 (Good)
- ozone (O3) - 0 (Good)
- sulfur dioxide (SO2) - 8 (Good)

What is the air quality in Yingwanzhen today? Is the air polluted in Yingwanzhen?. Is there smog?
What is the current level of PM2.5 in Yingwanzhen? (particulate matter (PM2.5) dust)
Today's PM2.5 level is:
61 (Unhealthy)
For comparison, the highest level of PM2.5 in Yingwanzhen in the last 7 days was: 28 (Friday, May 27, 2022) and the lowest: 28 (Friday, May 27, 2022).
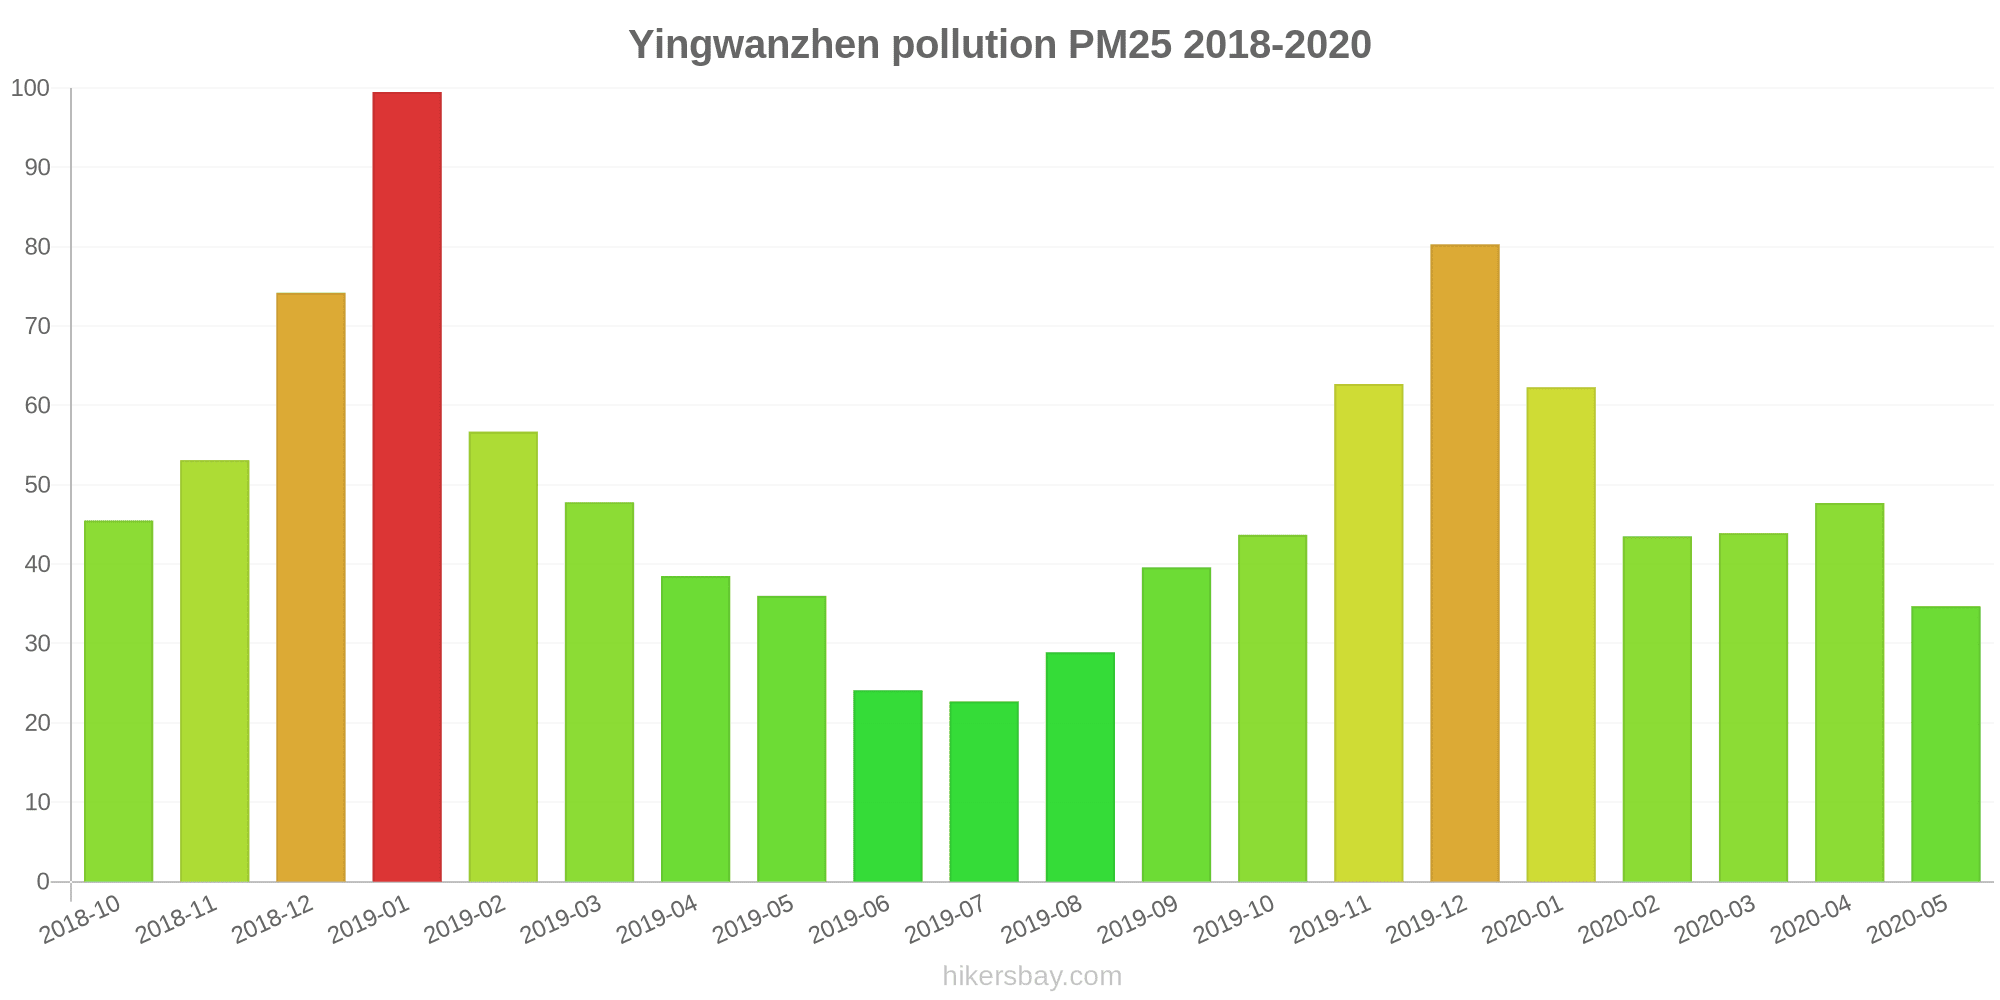
The highest PM2.5 values were recorded: 100 (January 2019).
The lowest level of particulate matter PM2.5 pollution occurs in month: July (23).
How high is the level of NO2? (nitrogen dioxide (NO2))
22 (Good)
What is the level of PM10 today in Yingwanzhen? (particulate matter (PM10) suspended dust)
The current level of particulate matter PM10 in Yingwanzhen is:
69 (Unhealthy for Sensitive Groups)
The highest PM10 values usually occur in month: 82 (January 2019).
The lowest value of particulate matter PM10 pollution in Yingwanzhen is usually recorded in: June (32).
How high is the CO level? (carbon monoxide (CO))
219 (Good)
How is the O3 level today in Yingwanzhen? (ozone (O3))
0 (Good)
What is the level of SO2 pollution? (sulfur dioxide (SO2))
8 (Good)
Current data Friday, May 27, 2022, 3:00 PM
PM2,5 61 (Unhealthy)
NO2 22 (Good)
PM10 69 (Unhealthy for Sensitive Groups)
CO 219 (Good)
O3 0 (Good)
SO2 8 (Good)
Data on air pollution from recent days in Yingwanzhen
index
2022-05-27
pm25
28
Moderate
no2
22
Good
pm10
35
Moderate
co
579
Good
o3
22
Good
so2
5
Good
data source »
Air pollution in Yingwanzhen from October 2018 to May 2020

index
2020-05
2020-04
2020-03
2020-02
2020-01
2019-12
2019-11
2019-10
2019-09
2019-08
2019-07
2019-06
2019-05
2019-04
2019-03
2019-02
2019-01
2018-12
2018-11
2018-10
pm25
35 (Moderate)
48 (Unhealthy for Sensitive Groups)
44 (Unhealthy for Sensitive Groups)
44 (Unhealthy for Sensitive Groups)
62 (Unhealthy)
80 (Very Unhealthy)
63 (Unhealthy)
44 (Unhealthy for Sensitive Groups)
40 (Unhealthy for Sensitive Groups)
29 (Moderate)
23 (Moderate)
24 (Moderate)
36 (Unhealthy for Sensitive Groups)
39 (Unhealthy for Sensitive Groups)
48 (Unhealthy for Sensitive Groups)
57 (Unhealthy)
100 (Very Unhealthy)
74 (Unhealthy)
53 (Unhealthy for Sensitive Groups)
46 (Unhealthy for Sensitive Groups)
co
664 (Good)
743 (Good)
775 (Good)
946 (Good)
1 (Good)
1 (Good)
849 (Good)
864 (Good)
796 (Good)
759 (Good)
724 (Good)
588 (Good)
827 (Good)
830 (Good)
862 (Good)
1 (Good)
1 (Good)
957 (Good)
781 (Good)
660 (Good)
no2
17 (Good)
25 (Good)
19 (Good)
13 (Good)
24 (Good)
43 (Moderate)
34 (Good)
31 (Good)
25 (Good)
15 (Good)
12 (Good)
15 (Good)
24 (Good)
26 (Good)
34 (Good)
19 (Good)
37 (Good)
31 (Good)
32 (Good)
33 (Good)
o3
119 (Moderate)
140 (Unhealthy for Sensitive Groups)
88 (Moderate)
82 (Moderate)
58 (Good)
69 (Good)
105 (Moderate)
123 (Unhealthy for Sensitive Groups)
194 (Very Unhealthy)
171 (Unhealthy)
132 (Unhealthy for Sensitive Groups)
136 (Unhealthy for Sensitive Groups)
136 (Unhealthy for Sensitive Groups)
108 (Moderate)
90 (Moderate)
62 (Good)
57 (Good)
46 (Good)
82 (Moderate)
112 (Moderate)
pm10
43 (Moderate)
50 (Unhealthy for Sensitive Groups)
41 (Moderate)
35 (Moderate)
43 (Moderate)
67 (Unhealthy for Sensitive Groups)
70 (Unhealthy for Sensitive Groups)
55 (Unhealthy for Sensitive Groups)
54 (Unhealthy for Sensitive Groups)
45 (Moderate)
34 (Moderate)
32 (Moderate)
51 (Unhealthy for Sensitive Groups)
42 (Moderate)
58 (Unhealthy for Sensitive Groups)
53 (Unhealthy for Sensitive Groups)
82 (Unhealthy)
56 (Unhealthy for Sensitive Groups)
56 (Unhealthy for Sensitive Groups)
69 (Unhealthy for Sensitive Groups)
so2
6.8 (Good)
8.2 (Good)
5.3 (Good)
5.4 (Good)
5.5 (Good)
9.6 (Good)
8.8 (Good)
9.4 (Good)
11 (Good)
7.4 (Good)
6.7 (Good)
5.8 (Good)
6 (Good)
6 (Good)
6 (Good)
4.3 (Good)
5.5 (Good)
6.9 (Good)
9.7 (Good)
13 (Good)
data source »
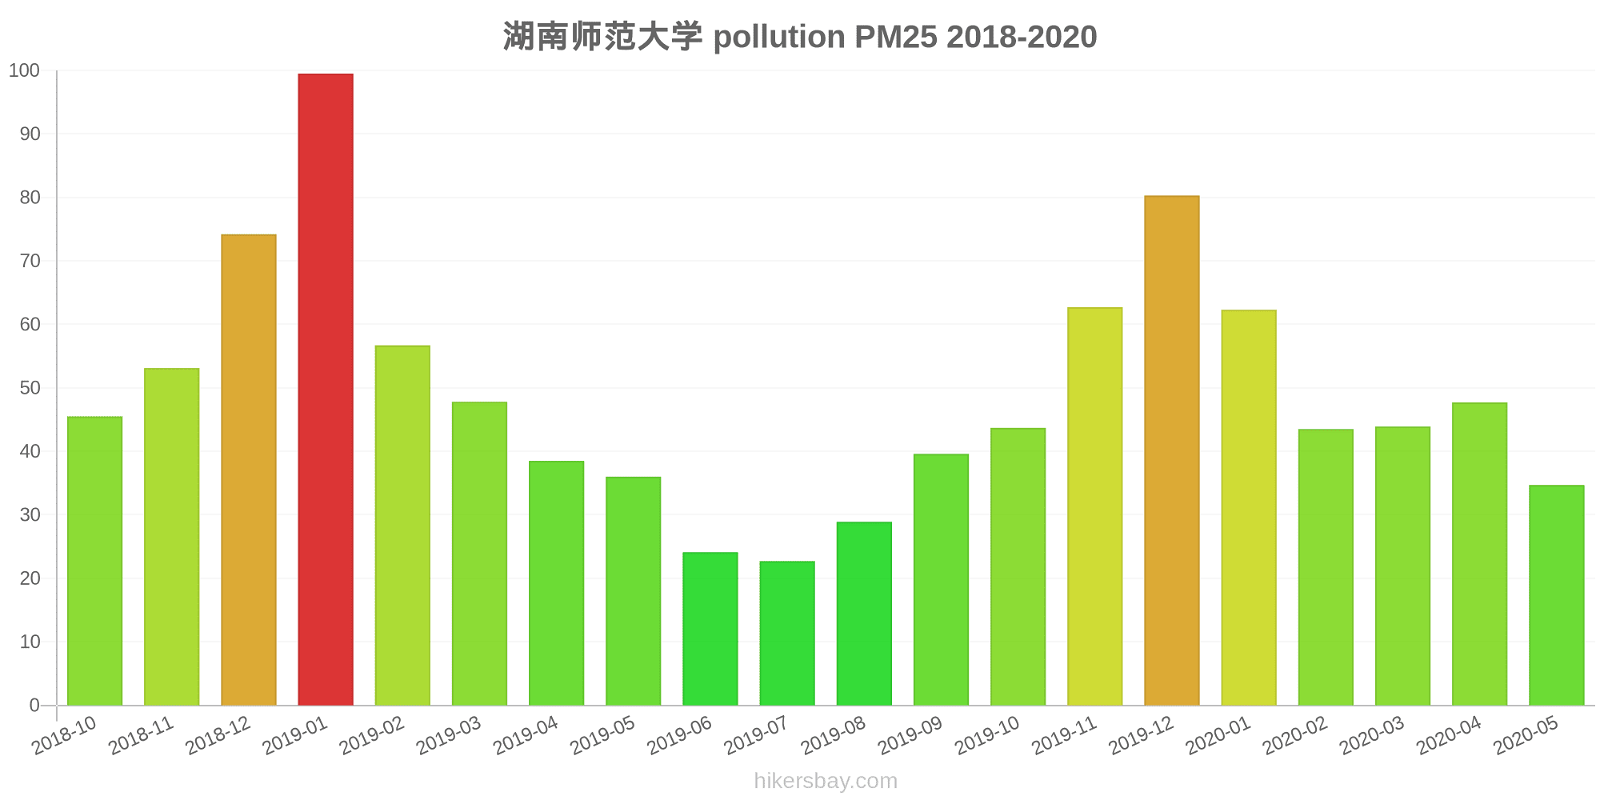
湖南师范大学
Friday, May 27, 2022, 3:00 PM
PM2,5 61 (Unhealthy)
particulate matter (PM2.5) dust
NO2 22 (Good)
nitrogen dioxide (NO2)
PM10 69 (Unhealthy for Sensitive Groups)
particulate matter (PM10) suspended dust
CO 219 (Good)
carbon monoxide (CO)
O3 0.05 (Good)
ozone (O3)
SO2 7.7 (Good)
sulfur dioxide (SO2)
湖南师范大学
index
2022-05-27
pm25
28
no2
22
pm10
35
co
579
o3
22
so2
4.6
湖南师范大学
2018-10 2020-05
index
2020-05
2020-04
2020-03
2020-02
2020-01
2019-12
2019-11
2019-10
2019-09
2019-08
2019-07
2019-06
2019-05
2019-04
2019-03
2019-02
2019-01
2018-12
2018-11
2018-10
pm25
35
48
44
44
62
80
63
44
40
29
23
24
36
39
48
57
100
74
53
46
co
664
743
775
946
1
1
849
864
796
759
724
588
827
830
862
1
1
957
781
660
no2
17
25
19
13
24
43
34
31
25
15
12
15
24
26
34
19
37
31
32
33
o3
119
140
88
82
58
69
105
123
194
171
132
136
136
108
90
62
57
46
82
112
pm10
43
50
41
35
43
67
70
55
54
45
34
32
51
42
58
53
82
56
56
69
so2
6.8
8.2
5.3
5.4
5.5
9.6
8.8
9.4
11
7.4
6.7
5.8
6
6
6
4.3
5.5
6.9
9.7
13
* Pollution data source:
https://openaq.org
(ChinaAQIData)
The data is licensed under CC-By 4.0
PM2,5 61 (Unhealthy)
NO2 22 (Good)
PM10 69 (Unhealthy for Sensitive Groups)
CO 219 (Good)
O3 0 (Good)
SO2 8 (Good)
Data on air pollution from recent days in Yingwanzhen
| index | 2022-05-27 |
|---|---|
| pm25 | 28 Moderate |
| no2 | 22 Good |
| pm10 | 35 Moderate |
| co | 579 Good |
| o3 | 22 Good |
| so2 | 5 Good |
| index | 2020-05 | 2020-04 | 2020-03 | 2020-02 | 2020-01 | 2019-12 | 2019-11 | 2019-10 | 2019-09 | 2019-08 | 2019-07 | 2019-06 | 2019-05 | 2019-04 | 2019-03 | 2019-02 | 2019-01 | 2018-12 | 2018-11 | 2018-10 |
|---|---|---|---|---|---|---|---|---|---|---|---|---|---|---|---|---|---|---|---|---|
| pm25 | 35 (Moderate) | 48 (Unhealthy for Sensitive Groups) | 44 (Unhealthy for Sensitive Groups) | 44 (Unhealthy for Sensitive Groups) | 62 (Unhealthy) | 80 (Very Unhealthy) | 63 (Unhealthy) | 44 (Unhealthy for Sensitive Groups) | 40 (Unhealthy for Sensitive Groups) | 29 (Moderate) | 23 (Moderate) | 24 (Moderate) | 36 (Unhealthy for Sensitive Groups) | 39 (Unhealthy for Sensitive Groups) | 48 (Unhealthy for Sensitive Groups) | 57 (Unhealthy) | 100 (Very Unhealthy) | 74 (Unhealthy) | 53 (Unhealthy for Sensitive Groups) | 46 (Unhealthy for Sensitive Groups) |
| co | 664 (Good) | 743 (Good) | 775 (Good) | 946 (Good) | 1 (Good) | 1 (Good) | 849 (Good) | 864 (Good) | 796 (Good) | 759 (Good) | 724 (Good) | 588 (Good) | 827 (Good) | 830 (Good) | 862 (Good) | 1 (Good) | 1 (Good) | 957 (Good) | 781 (Good) | 660 (Good) |
| no2 | 17 (Good) | 25 (Good) | 19 (Good) | 13 (Good) | 24 (Good) | 43 (Moderate) | 34 (Good) | 31 (Good) | 25 (Good) | 15 (Good) | 12 (Good) | 15 (Good) | 24 (Good) | 26 (Good) | 34 (Good) | 19 (Good) | 37 (Good) | 31 (Good) | 32 (Good) | 33 (Good) |
| o3 | 119 (Moderate) | 140 (Unhealthy for Sensitive Groups) | 88 (Moderate) | 82 (Moderate) | 58 (Good) | 69 (Good) | 105 (Moderate) | 123 (Unhealthy for Sensitive Groups) | 194 (Very Unhealthy) | 171 (Unhealthy) | 132 (Unhealthy for Sensitive Groups) | 136 (Unhealthy for Sensitive Groups) | 136 (Unhealthy for Sensitive Groups) | 108 (Moderate) | 90 (Moderate) | 62 (Good) | 57 (Good) | 46 (Good) | 82 (Moderate) | 112 (Moderate) |
| pm10 | 43 (Moderate) | 50 (Unhealthy for Sensitive Groups) | 41 (Moderate) | 35 (Moderate) | 43 (Moderate) | 67 (Unhealthy for Sensitive Groups) | 70 (Unhealthy for Sensitive Groups) | 55 (Unhealthy for Sensitive Groups) | 54 (Unhealthy for Sensitive Groups) | 45 (Moderate) | 34 (Moderate) | 32 (Moderate) | 51 (Unhealthy for Sensitive Groups) | 42 (Moderate) | 58 (Unhealthy for Sensitive Groups) | 53 (Unhealthy for Sensitive Groups) | 82 (Unhealthy) | 56 (Unhealthy for Sensitive Groups) | 56 (Unhealthy for Sensitive Groups) | 69 (Unhealthy for Sensitive Groups) |
| so2 | 6.8 (Good) | 8.2 (Good) | 5.3 (Good) | 5.4 (Good) | 5.5 (Good) | 9.6 (Good) | 8.8 (Good) | 9.4 (Good) | 11 (Good) | 7.4 (Good) | 6.7 (Good) | 5.8 (Good) | 6 (Good) | 6 (Good) | 6 (Good) | 4.3 (Good) | 5.5 (Good) | 6.9 (Good) | 9.7 (Good) | 13 (Good) |
PM2,5 61 (Unhealthy)
particulate matter (PM2.5) dustNO2 22 (Good)
nitrogen dioxide (NO2)PM10 69 (Unhealthy for Sensitive Groups)
particulate matter (PM10) suspended dustCO 219 (Good)
carbon monoxide (CO)O3 0.05 (Good)
ozone (O3)SO2 7.7 (Good)
sulfur dioxide (SO2)湖南师范大学
| index | 2022-05-27 |
|---|---|
| pm25 | 28 |
| no2 | 22 |
| pm10 | 35 |
| co | 579 |
| o3 | 22 |
| so2 | 4.6 |
湖南师范大学

| index | 2020-05 | 2020-04 | 2020-03 | 2020-02 | 2020-01 | 2019-12 | 2019-11 | 2019-10 | 2019-09 | 2019-08 | 2019-07 | 2019-06 | 2019-05 | 2019-04 | 2019-03 | 2019-02 | 2019-01 | 2018-12 | 2018-11 | 2018-10 |
|---|---|---|---|---|---|---|---|---|---|---|---|---|---|---|---|---|---|---|---|---|
| pm25 | 35 | 48 | 44 | 44 | 62 | 80 | 63 | 44 | 40 | 29 | 23 | 24 | 36 | 39 | 48 | 57 | 100 | 74 | 53 | 46 |
| co | 664 | 743 | 775 | 946 | 1 | 1 | 849 | 864 | 796 | 759 | 724 | 588 | 827 | 830 | 862 | 1 | 1 | 957 | 781 | 660 |
| no2 | 17 | 25 | 19 | 13 | 24 | 43 | 34 | 31 | 25 | 15 | 12 | 15 | 24 | 26 | 34 | 19 | 37 | 31 | 32 | 33 |
| o3 | 119 | 140 | 88 | 82 | 58 | 69 | 105 | 123 | 194 | 171 | 132 | 136 | 136 | 108 | 90 | 62 | 57 | 46 | 82 | 112 |
| pm10 | 43 | 50 | 41 | 35 | 43 | 67 | 70 | 55 | 54 | 45 | 34 | 32 | 51 | 42 | 58 | 53 | 82 | 56 | 56 | 69 |
| so2 | 6.8 | 8.2 | 5.3 | 5.4 | 5.5 | 9.6 | 8.8 | 9.4 | 11 | 7.4 | 6.7 | 5.8 | 6 | 6 | 6 | 4.3 | 5.5 | 6.9 | 9.7 | 13 |