Air Pollution in Yuci: Real-time Air Quality Index and smog alert.
Pollution and air quality forecast for Yuci. Today is Tuesday, June 16, 2026. The following air pollution values have been recorded for Yuci:- particulate matter (PM2.5) dust - 61 (Unhealthy)
- nitrogen dioxide (NO2) - 22 (Good)
- particulate matter (PM10) suspended dust - 69 (Unhealthy for Sensitive Groups)
- carbon monoxide (CO) - 219 (Good)
- ozone (O3) - 0 (Good)
- sulfur dioxide (SO2) - 8 (Good)

What is the air quality in Yuci today? Is the air polluted in Yuci?. Is there smog?
What is the current level of PM2.5 in Yuci? (particulate matter (PM2.5) dust)
Today's PM2.5 level is:
61 (Unhealthy)
For comparison, the highest level of PM2.5 in Yuci in the last 7 days was: 28 (Friday, May 27, 2022) and the lowest: 28 (Friday, May 27, 2022).
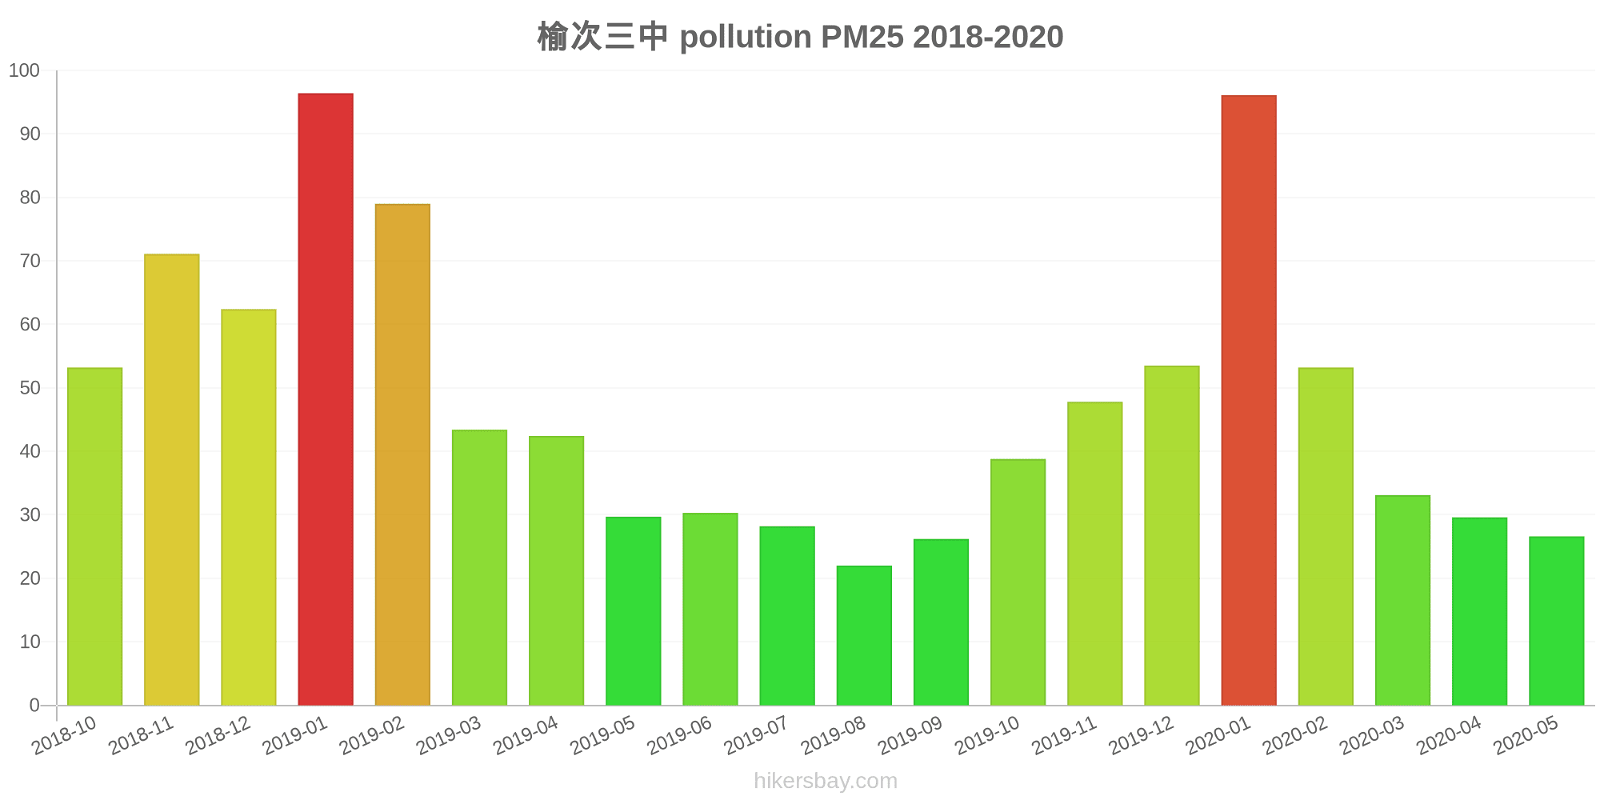
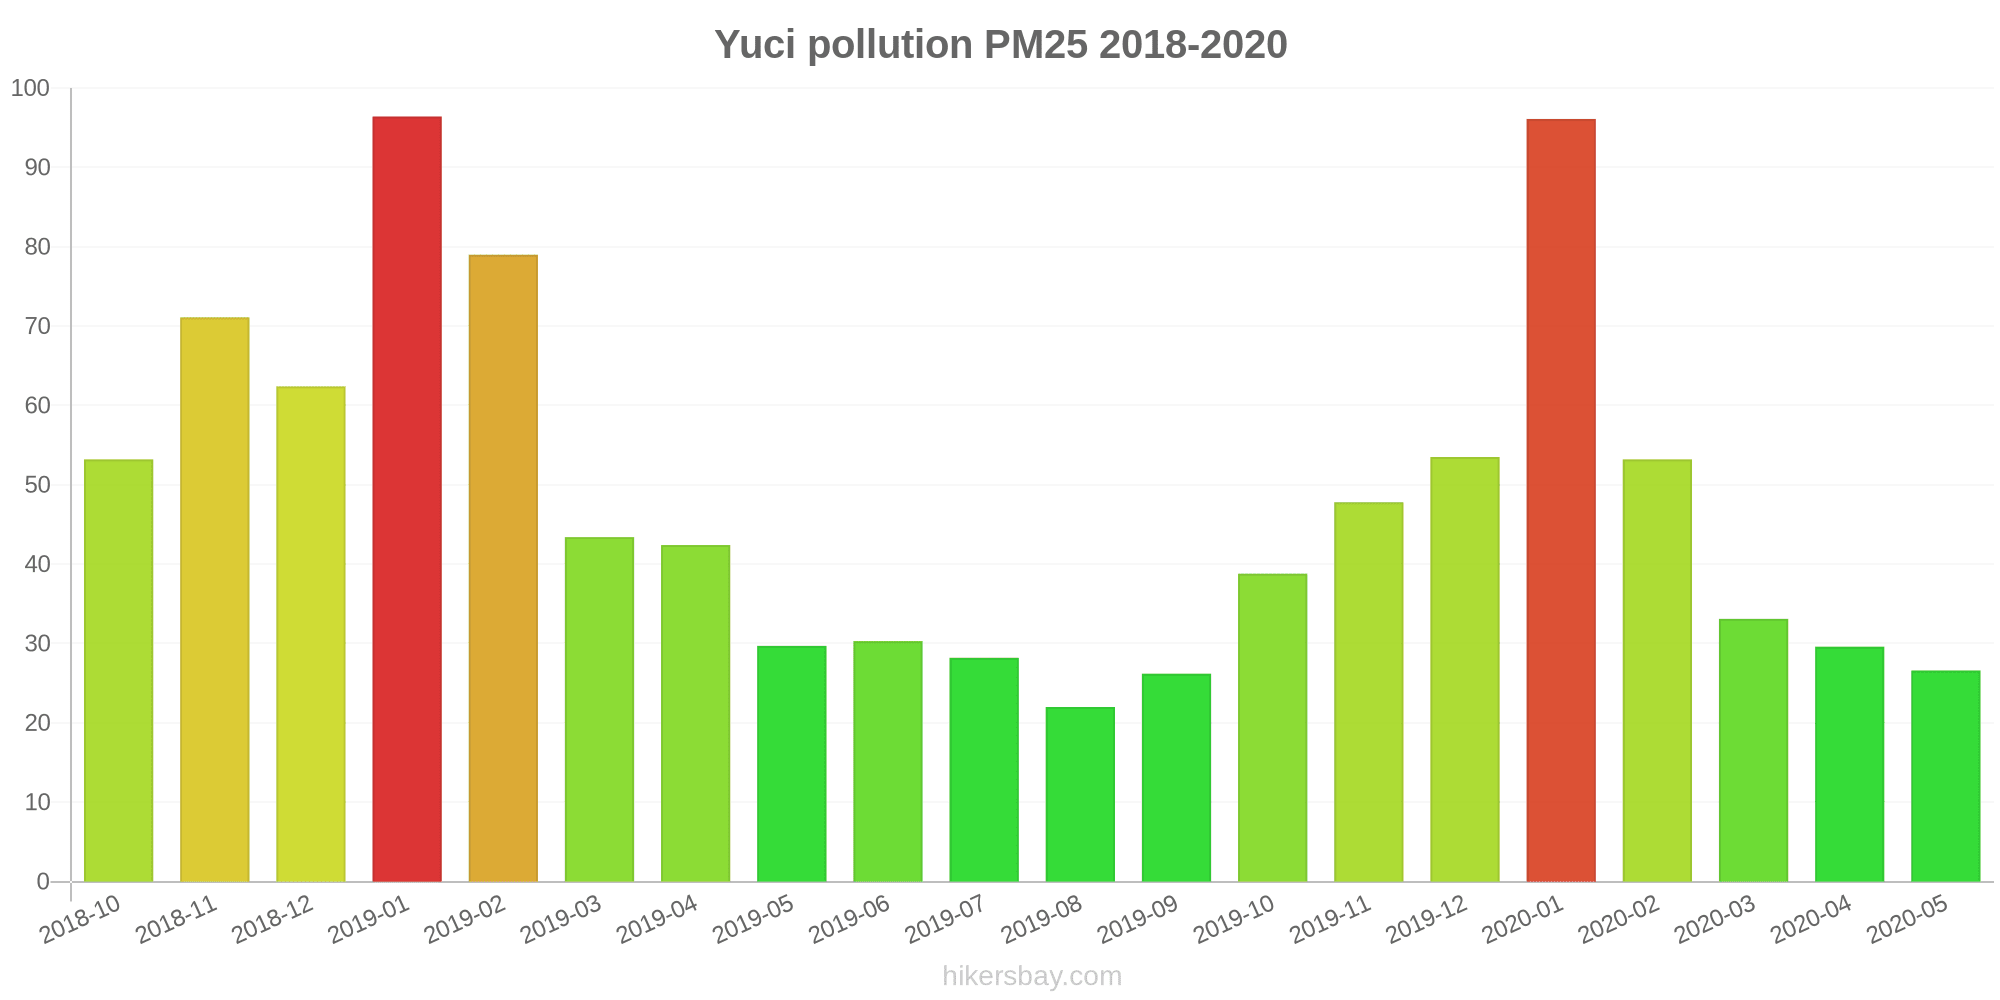
The highest PM2.5 values were recorded: 96 (January 2019).
The lowest level of particulate matter PM2.5 pollution occurs in month: August (22).
How high is the level of NO2? (nitrogen dioxide (NO2))
22 (Good)
What is the level of PM10 today in Yuci? (particulate matter (PM10) suspended dust)
The current level of particulate matter PM10 in Yuci is:
69 (Unhealthy for Sensitive Groups)
The highest PM10 values usually occur in month: 165 (January 2019).
The lowest value of particulate matter PM10 pollution in Yuci is usually recorded in: August (47).
How high is the CO level? (carbon monoxide (CO))
219 (Good)
How is the O3 level today in Yuci? (ozone (O3))
0 (Good)
What is the level of SO2 pollution? (sulfur dioxide (SO2))
8 (Good)
Current data Friday, May 27, 2022, 3:00 PM
PM2,5 61 (Unhealthy)
NO2 22 (Good)
PM10 69 (Unhealthy for Sensitive Groups)
CO 219 (Good)
O3 0 (Good)
SO2 8 (Good)
Data on air pollution from recent days in Yuci
index
2022-05-27
pm25
28
Moderate
no2
22
Good
pm10
35
Moderate
co
579
Good
o3
22
Good
so2
5
Good
data source »
Air pollution in Yuci from October 2018 to May 2020

index
2020-05
2020-04
2020-03
2020-02
2020-01
2019-12
2019-11
2019-10
2019-09
2019-08
2019-07
2019-06
2019-05
2019-04
2019-03
2019-02
2019-01
2018-12
2018-11
2018-10
pm25
27 (Moderate)
30 (Moderate)
33 (Moderate)
53 (Unhealthy for Sensitive Groups)
96 (Very Unhealthy)
54 (Unhealthy for Sensitive Groups)
48 (Unhealthy for Sensitive Groups)
39 (Unhealthy for Sensitive Groups)
26 (Moderate)
22 (Moderate)
28 (Moderate)
30 (Moderate)
30 (Moderate)
42 (Unhealthy for Sensitive Groups)
43 (Unhealthy for Sensitive Groups)
79 (Very Unhealthy)
96 (Very Unhealthy)
62 (Unhealthy)
71 (Unhealthy)
53 (Unhealthy for Sensitive Groups)
co
599 (Good)
621 (Good)
625 (Good)
966 (Good)
1 (Good)
968 (Good)
860 (Good)
773 (Good)
655 (Good)
708 (Good)
672 (Good)
736 (Good)
693 (Good)
796 (Good)
825 (Good)
1 (Good)
1 (Good)
1 (Good)
1 (Good)
1 (Good)
no2
28 (Good)
35 (Good)
33 (Good)
30 (Good)
54 (Moderate)
54 (Moderate)
51 (Moderate)
40 (Moderate)
37 (Good)
29 (Good)
26 (Good)
30 (Good)
33 (Good)
38 (Good)
42 (Moderate)
43 (Moderate)
70 (Moderate)
59 (Moderate)
64 (Moderate)
47 (Moderate)
o3
158 (Unhealthy)
130 (Unhealthy for Sensitive Groups)
114 (Moderate)
96 (Moderate)
71 (Moderate)
61 (Good)
65 (Good)
103 (Moderate)
146 (Unhealthy for Sensitive Groups)
156 (Unhealthy)
203 (Very Unhealthy)
209 (Very Unhealthy)
160 (Unhealthy)
131 (Unhealthy for Sensitive Groups)
117 (Moderate)
85 (Moderate)
45 (Good)
44 (Good)
67 (Good)
96 (Moderate)
pm10
73 (Unhealthy for Sensitive Groups)
81 (Unhealthy)
77 (Unhealthy for Sensitive Groups)
87 (Unhealthy)
143 (Very Unhealthy)
101 (Unhealthy)
109 (Unhealthy)
95 (Unhealthy)
60 (Unhealthy for Sensitive Groups)
47 (Moderate)
57 (Unhealthy for Sensitive Groups)
63 (Unhealthy for Sensitive Groups)
91 (Unhealthy)
103 (Unhealthy)
104 (Unhealthy)
125 (Very Unhealthy)
165 (Very bad Hazardous)
139 (Very Unhealthy)
143 (Very Unhealthy)
106 (Unhealthy)
so2
15 (Good)
16 (Good)
22 (Good)
29 (Good)
47 (Good)
45 (Good)
28 (Good)
14 (Good)
13 (Good)
10 (Good)
9.2 (Good)
12 (Good)
16 (Good)
21 (Good)
29 (Good)
50 (Moderate)
73 (Moderate)
60 (Moderate)
44 (Good)
24 (Good)
data source »
榆次三中
Friday, May 27, 2022, 3:00 PM
PM2,5 61 (Unhealthy)
particulate matter (PM2.5) dust
NO2 22 (Good)
nitrogen dioxide (NO2)
PM10 69 (Unhealthy for Sensitive Groups)
particulate matter (PM10) suspended dust
CO 219 (Good)
carbon monoxide (CO)
O3 0.05 (Good)
ozone (O3)
SO2 7.7 (Good)
sulfur dioxide (SO2)
榆次三中
index
2022-05-27
pm25
28
no2
22
pm10
35
co
579
o3
22
so2
4.6
榆次三中
2018-10 2020-05
index
2020-05
2020-04
2020-03
2020-02
2020-01
2019-12
2019-11
2019-10
2019-09
2019-08
2019-07
2019-06
2019-05
2019-04
2019-03
2019-02
2019-01
2018-12
2018-11
2018-10
pm25
27
30
33
53
96
54
48
39
26
22
28
30
30
42
43
79
96
62
71
53
co
599
621
625
966
1
968
860
773
655
708
672
736
693
796
825
1
1
1
1
1
no2
28
35
33
30
54
54
51
40
37
29
26
30
33
38
42
43
70
59
64
47
o3
158
130
114
96
71
61
65
103
146
156
203
209
160
131
117
85
45
44
67
96
pm10
73
81
77
87
143
101
109
95
60
47
57
63
91
103
104
125
165
139
143
106
so2
15
16
22
29
47
45
28
14
13
10
9.2
12
16
21
29
50
73
60
44
24
* Pollution data source:
https://openaq.org
(ChinaAQIData)
The data is licensed under CC-By 4.0
PM2,5 61 (Unhealthy)
NO2 22 (Good)
PM10 69 (Unhealthy for Sensitive Groups)
CO 219 (Good)
O3 0 (Good)
SO2 8 (Good)
Data on air pollution from recent days in Yuci
| index | 2022-05-27 |
|---|---|
| pm25 | 28 Moderate |
| no2 | 22 Good |
| pm10 | 35 Moderate |
| co | 579 Good |
| o3 | 22 Good |
| so2 | 5 Good |
| index | 2020-05 | 2020-04 | 2020-03 | 2020-02 | 2020-01 | 2019-12 | 2019-11 | 2019-10 | 2019-09 | 2019-08 | 2019-07 | 2019-06 | 2019-05 | 2019-04 | 2019-03 | 2019-02 | 2019-01 | 2018-12 | 2018-11 | 2018-10 |
|---|---|---|---|---|---|---|---|---|---|---|---|---|---|---|---|---|---|---|---|---|
| pm25 | 27 (Moderate) | 30 (Moderate) | 33 (Moderate) | 53 (Unhealthy for Sensitive Groups) | 96 (Very Unhealthy) | 54 (Unhealthy for Sensitive Groups) | 48 (Unhealthy for Sensitive Groups) | 39 (Unhealthy for Sensitive Groups) | 26 (Moderate) | 22 (Moderate) | 28 (Moderate) | 30 (Moderate) | 30 (Moderate) | 42 (Unhealthy for Sensitive Groups) | 43 (Unhealthy for Sensitive Groups) | 79 (Very Unhealthy) | 96 (Very Unhealthy) | 62 (Unhealthy) | 71 (Unhealthy) | 53 (Unhealthy for Sensitive Groups) |
| co | 599 (Good) | 621 (Good) | 625 (Good) | 966 (Good) | 1 (Good) | 968 (Good) | 860 (Good) | 773 (Good) | 655 (Good) | 708 (Good) | 672 (Good) | 736 (Good) | 693 (Good) | 796 (Good) | 825 (Good) | 1 (Good) | 1 (Good) | 1 (Good) | 1 (Good) | 1 (Good) |
| no2 | 28 (Good) | 35 (Good) | 33 (Good) | 30 (Good) | 54 (Moderate) | 54 (Moderate) | 51 (Moderate) | 40 (Moderate) | 37 (Good) | 29 (Good) | 26 (Good) | 30 (Good) | 33 (Good) | 38 (Good) | 42 (Moderate) | 43 (Moderate) | 70 (Moderate) | 59 (Moderate) | 64 (Moderate) | 47 (Moderate) |
| o3 | 158 (Unhealthy) | 130 (Unhealthy for Sensitive Groups) | 114 (Moderate) | 96 (Moderate) | 71 (Moderate) | 61 (Good) | 65 (Good) | 103 (Moderate) | 146 (Unhealthy for Sensitive Groups) | 156 (Unhealthy) | 203 (Very Unhealthy) | 209 (Very Unhealthy) | 160 (Unhealthy) | 131 (Unhealthy for Sensitive Groups) | 117 (Moderate) | 85 (Moderate) | 45 (Good) | 44 (Good) | 67 (Good) | 96 (Moderate) |
| pm10 | 73 (Unhealthy for Sensitive Groups) | 81 (Unhealthy) | 77 (Unhealthy for Sensitive Groups) | 87 (Unhealthy) | 143 (Very Unhealthy) | 101 (Unhealthy) | 109 (Unhealthy) | 95 (Unhealthy) | 60 (Unhealthy for Sensitive Groups) | 47 (Moderate) | 57 (Unhealthy for Sensitive Groups) | 63 (Unhealthy for Sensitive Groups) | 91 (Unhealthy) | 103 (Unhealthy) | 104 (Unhealthy) | 125 (Very Unhealthy) | 165 (Very bad Hazardous) | 139 (Very Unhealthy) | 143 (Very Unhealthy) | 106 (Unhealthy) |
| so2 | 15 (Good) | 16 (Good) | 22 (Good) | 29 (Good) | 47 (Good) | 45 (Good) | 28 (Good) | 14 (Good) | 13 (Good) | 10 (Good) | 9.2 (Good) | 12 (Good) | 16 (Good) | 21 (Good) | 29 (Good) | 50 (Moderate) | 73 (Moderate) | 60 (Moderate) | 44 (Good) | 24 (Good) |
PM2,5 61 (Unhealthy)
particulate matter (PM2.5) dustNO2 22 (Good)
nitrogen dioxide (NO2)PM10 69 (Unhealthy for Sensitive Groups)
particulate matter (PM10) suspended dustCO 219 (Good)
carbon monoxide (CO)O3 0.05 (Good)
ozone (O3)SO2 7.7 (Good)
sulfur dioxide (SO2)榆次三中
| index | 2022-05-27 |
|---|---|
| pm25 | 28 |
| no2 | 22 |
| pm10 | 35 |
| co | 579 |
| o3 | 22 |
| so2 | 4.6 |
榆次三中

| index | 2020-05 | 2020-04 | 2020-03 | 2020-02 | 2020-01 | 2019-12 | 2019-11 | 2019-10 | 2019-09 | 2019-08 | 2019-07 | 2019-06 | 2019-05 | 2019-04 | 2019-03 | 2019-02 | 2019-01 | 2018-12 | 2018-11 | 2018-10 |
|---|---|---|---|---|---|---|---|---|---|---|---|---|---|---|---|---|---|---|---|---|
| pm25 | 27 | 30 | 33 | 53 | 96 | 54 | 48 | 39 | 26 | 22 | 28 | 30 | 30 | 42 | 43 | 79 | 96 | 62 | 71 | 53 |
| co | 599 | 621 | 625 | 966 | 1 | 968 | 860 | 773 | 655 | 708 | 672 | 736 | 693 | 796 | 825 | 1 | 1 | 1 | 1 | 1 |
| no2 | 28 | 35 | 33 | 30 | 54 | 54 | 51 | 40 | 37 | 29 | 26 | 30 | 33 | 38 | 42 | 43 | 70 | 59 | 64 | 47 |
| o3 | 158 | 130 | 114 | 96 | 71 | 61 | 65 | 103 | 146 | 156 | 203 | 209 | 160 | 131 | 117 | 85 | 45 | 44 | 67 | 96 |
| pm10 | 73 | 81 | 77 | 87 | 143 | 101 | 109 | 95 | 60 | 47 | 57 | 63 | 91 | 103 | 104 | 125 | 165 | 139 | 143 | 106 |
| so2 | 15 | 16 | 22 | 29 | 47 | 45 | 28 | 14 | 13 | 10 | 9.2 | 12 | 16 | 21 | 29 | 50 | 73 | 60 | 44 | 24 |