Air Pollution in Yudong: Real-time Air Quality Index and smog alert.
Pollution and air quality forecast for Yudong. Today is Tuesday, June 16, 2026. The following air pollution values have been recorded for Yudong:- particulate matter (PM2.5) dust - 61 (Unhealthy)
- nitrogen dioxide (NO2) - 22 (Good)
- particulate matter (PM10) suspended dust - 69 (Unhealthy for Sensitive Groups)
- carbon monoxide (CO) - 219 (Good)
- ozone (O3) - 0 (Good)
- sulfur dioxide (SO2) - 8 (Good)

What is the air quality in Yudong today? Is the air polluted in Yudong?. Is there smog?
What is the current level of PM2.5 in Yudong? (particulate matter (PM2.5) dust)
Today's PM2.5 level is:
61 (Unhealthy)
For comparison, the highest level of PM2.5 in Yudong in the last 7 days was: 28 (Friday, May 27, 2022) and the lowest: 28 (Friday, May 27, 2022).
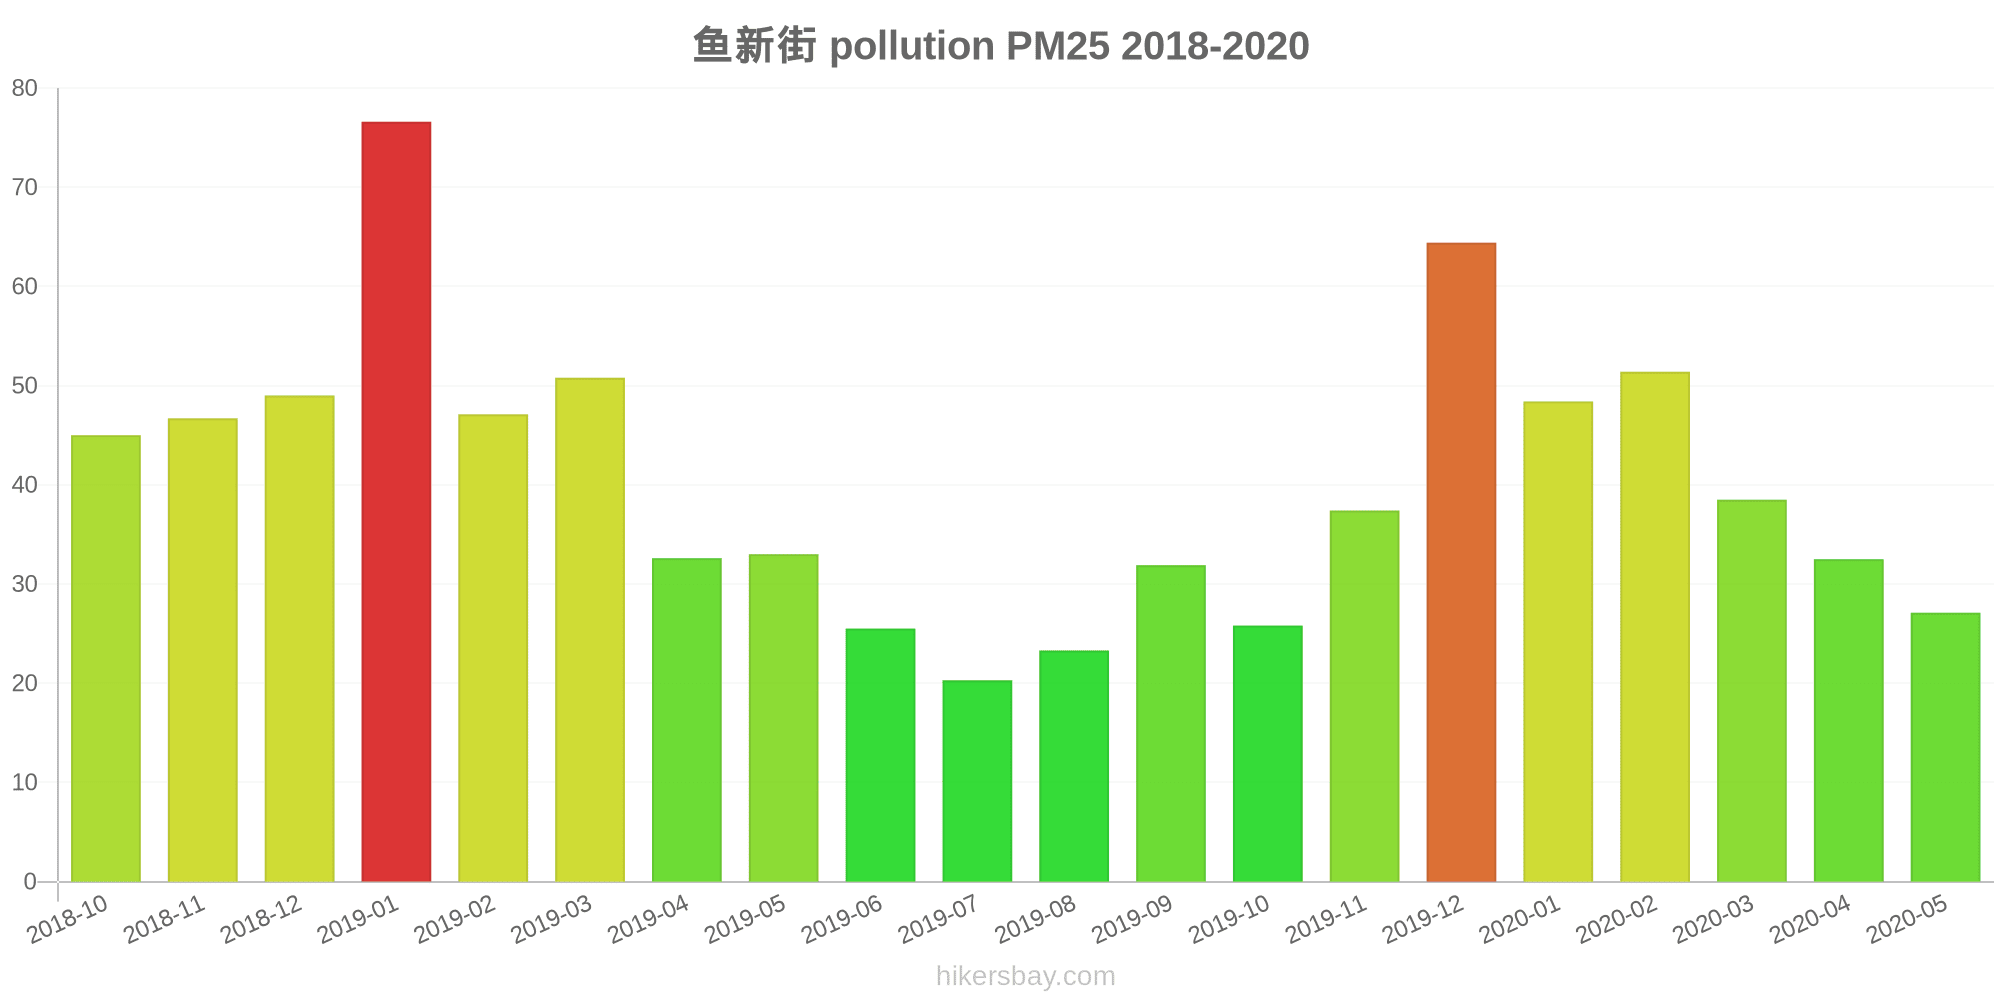
The highest PM2.5 values were recorded: 77 (January 2019).
The lowest level of particulate matter PM2.5 pollution occurs in month: July (20).
How high is the level of NO2? (nitrogen dioxide (NO2))
22 (Good)
What is the level of PM10 today in Yudong? (particulate matter (PM10) suspended dust)
The current level of particulate matter PM10 in Yudong is:
69 (Unhealthy for Sensitive Groups)
The highest PM10 values usually occur in month: 102 (January 2019).
The lowest value of particulate matter PM10 pollution in Yudong is usually recorded in: July (37).
How high is the CO level? (carbon monoxide (CO))
219 (Good)
How is the O3 level today in Yudong? (ozone (O3))
0 (Good)
What is the level of SO2 pollution? (sulfur dioxide (SO2))
8 (Good)
Current data Friday, May 27, 2022, 3:00 PM
PM2,5 61 (Unhealthy)
NO2 22 (Good)
PM10 69 (Unhealthy for Sensitive Groups)
CO 219 (Good)
O3 0 (Good)
SO2 8 (Good)
Data on air pollution from recent days in Yudong
index
2022-05-27
pm25
28
Moderate
no2
22
Good
pm10
35
Moderate
co
579
Good
o3
22
Good
so2
5
Good
data source »
Air pollution in Yudong from October 2018 to May 2020

index
2020-05
2020-04
2020-03
2020-02
2020-01
2019-12
2019-11
2019-10
2019-09
2019-08
2019-07
2019-06
2019-05
2019-04
2019-03
2019-02
2019-01
2018-12
2018-11
2018-10
pm25
27 (Moderate)
33 (Moderate)
39 (Unhealthy for Sensitive Groups)
51 (Unhealthy for Sensitive Groups)
48 (Unhealthy for Sensitive Groups)
64 (Unhealthy)
37 (Unhealthy for Sensitive Groups)
26 (Moderate)
32 (Moderate)
23 (Moderate)
20 (Moderate)
26 (Moderate)
33 (Moderate)
33 (Moderate)
51 (Unhealthy for Sensitive Groups)
47 (Unhealthy for Sensitive Groups)
77 (Very Unhealthy)
49 (Unhealthy for Sensitive Groups)
47 (Unhealthy for Sensitive Groups)
45 (Unhealthy for Sensitive Groups)
co
596 (Good)
625 (Good)
647 (Good)
927 (Good)
1 (Good)
1 (Good)
749 (Good)
754 (Good)
865 (Good)
808 (Good)
931 (Good)
944 (Good)
859 (Good)
924 (Good)
991 (Good)
1 (Good)
1 (Good)
1 (Good)
945 (Good)
1 (Good)
no2
36 (Good)
46 (Moderate)
37 (Good)
23 (Good)
36 (Good)
44 (Moderate)
41 (Moderate)
40 (Moderate)
42 (Moderate)
31 (Good)
28 (Good)
34 (Good)
35 (Good)
40 (Moderate)
46 (Moderate)
31 (Good)
44 (Moderate)
44 (Moderate)
45 (Moderate)
46 (Moderate)
o3
178 (Unhealthy)
98 (Moderate)
97 (Moderate)
56 (Good)
42 (Good)
30 (Good)
37 (Good)
60 (Good)
136 (Unhealthy for Sensitive Groups)
183 (Very Unhealthy)
150 (Unhealthy)
131 (Unhealthy for Sensitive Groups)
115 (Moderate)
148 (Unhealthy for Sensitive Groups)
88 (Moderate)
65 (Good)
38 (Good)
24 (Good)
41 (Good)
31 (Good)
pm10
53 (Unhealthy for Sensitive Groups)
56 (Unhealthy for Sensitive Groups)
61 (Unhealthy for Sensitive Groups)
66 (Unhealthy for Sensitive Groups)
69 (Unhealthy for Sensitive Groups)
95 (Unhealthy)
61 (Unhealthy for Sensitive Groups)
44 (Moderate)
51 (Unhealthy for Sensitive Groups)
41 (Moderate)
37 (Moderate)
50 (Unhealthy for Sensitive Groups)
65 (Unhealthy for Sensitive Groups)
64 (Unhealthy for Sensitive Groups)
79 (Unhealthy for Sensitive Groups)
71 (Unhealthy for Sensitive Groups)
102 (Unhealthy)
74 (Unhealthy for Sensitive Groups)
80 (Unhealthy)
83 (Unhealthy)
so2
10 (Good)
9.4 (Good)
9 (Good)
7.3 (Good)
9 (Good)
11 (Good)
9.3 (Good)
7.4 (Good)
7.8 (Good)
8.4 (Good)
6.2 (Good)
7.7 (Good)
8.5 (Good)
10 (Good)
11 (Good)
11 (Good)
11 (Good)
11 (Good)
11 (Good)
9.3 (Good)
data source »
鱼新街
Friday, May 27, 2022, 3:00 PM
PM2,5 61 (Unhealthy)
particulate matter (PM2.5) dust
NO2 22 (Good)
nitrogen dioxide (NO2)
PM10 69 (Unhealthy for Sensitive Groups)
particulate matter (PM10) suspended dust
CO 219 (Good)
carbon monoxide (CO)
O3 0.05 (Good)
ozone (O3)
SO2 7.7 (Good)
sulfur dioxide (SO2)
鱼新街
index
2022-05-27
pm25
28
no2
22
pm10
35
co
579
o3
22
so2
4.6
鱼新街
2018-10 2020-05

index
2020-05
2020-04
2020-03
2020-02
2020-01
2019-12
2019-11
2019-10
2019-09
2019-08
2019-07
2019-06
2019-05
2019-04
2019-03
2019-02
2019-01
2018-12
2018-11
2018-10
pm25
27
33
39
51
48
64
37
26
32
23
20
26
33
33
51
47
77
49
47
45
co
596
625
647
927
1
1
749
754
865
808
931
944
859
924
991
1
1
1
945
1
no2
36
46
37
23
36
44
41
40
42
31
28
34
35
40
46
31
44
44
45
46
o3
178
98
97
56
42
30
37
60
136
183
150
131
115
148
88
65
38
24
41
31
pm10
53
56
61
66
69
95
61
44
51
41
37
50
65
64
79
71
102
74
80
83
so2
10
9.4
9
7.3
9
11
9.3
7.4
7.8
8.4
6.2
7.7
8.5
10
11
11
11
11
11
9.3
* Pollution data source:
https://openaq.org
(ChinaAQIData)
The data is licensed under CC-By 4.0
PM2,5 61 (Unhealthy)
NO2 22 (Good)
PM10 69 (Unhealthy for Sensitive Groups)
CO 219 (Good)
O3 0 (Good)
SO2 8 (Good)
Data on air pollution from recent days in Yudong
| index | 2022-05-27 |
|---|---|
| pm25 | 28 Moderate |
| no2 | 22 Good |
| pm10 | 35 Moderate |
| co | 579 Good |
| o3 | 22 Good |
| so2 | 5 Good |

| index | 2020-05 | 2020-04 | 2020-03 | 2020-02 | 2020-01 | 2019-12 | 2019-11 | 2019-10 | 2019-09 | 2019-08 | 2019-07 | 2019-06 | 2019-05 | 2019-04 | 2019-03 | 2019-02 | 2019-01 | 2018-12 | 2018-11 | 2018-10 |
|---|---|---|---|---|---|---|---|---|---|---|---|---|---|---|---|---|---|---|---|---|
| pm25 | 27 (Moderate) | 33 (Moderate) | 39 (Unhealthy for Sensitive Groups) | 51 (Unhealthy for Sensitive Groups) | 48 (Unhealthy for Sensitive Groups) | 64 (Unhealthy) | 37 (Unhealthy for Sensitive Groups) | 26 (Moderate) | 32 (Moderate) | 23 (Moderate) | 20 (Moderate) | 26 (Moderate) | 33 (Moderate) | 33 (Moderate) | 51 (Unhealthy for Sensitive Groups) | 47 (Unhealthy for Sensitive Groups) | 77 (Very Unhealthy) | 49 (Unhealthy for Sensitive Groups) | 47 (Unhealthy for Sensitive Groups) | 45 (Unhealthy for Sensitive Groups) |
| co | 596 (Good) | 625 (Good) | 647 (Good) | 927 (Good) | 1 (Good) | 1 (Good) | 749 (Good) | 754 (Good) | 865 (Good) | 808 (Good) | 931 (Good) | 944 (Good) | 859 (Good) | 924 (Good) | 991 (Good) | 1 (Good) | 1 (Good) | 1 (Good) | 945 (Good) | 1 (Good) |
| no2 | 36 (Good) | 46 (Moderate) | 37 (Good) | 23 (Good) | 36 (Good) | 44 (Moderate) | 41 (Moderate) | 40 (Moderate) | 42 (Moderate) | 31 (Good) | 28 (Good) | 34 (Good) | 35 (Good) | 40 (Moderate) | 46 (Moderate) | 31 (Good) | 44 (Moderate) | 44 (Moderate) | 45 (Moderate) | 46 (Moderate) |
| o3 | 178 (Unhealthy) | 98 (Moderate) | 97 (Moderate) | 56 (Good) | 42 (Good) | 30 (Good) | 37 (Good) | 60 (Good) | 136 (Unhealthy for Sensitive Groups) | 183 (Very Unhealthy) | 150 (Unhealthy) | 131 (Unhealthy for Sensitive Groups) | 115 (Moderate) | 148 (Unhealthy for Sensitive Groups) | 88 (Moderate) | 65 (Good) | 38 (Good) | 24 (Good) | 41 (Good) | 31 (Good) |
| pm10 | 53 (Unhealthy for Sensitive Groups) | 56 (Unhealthy for Sensitive Groups) | 61 (Unhealthy for Sensitive Groups) | 66 (Unhealthy for Sensitive Groups) | 69 (Unhealthy for Sensitive Groups) | 95 (Unhealthy) | 61 (Unhealthy for Sensitive Groups) | 44 (Moderate) | 51 (Unhealthy for Sensitive Groups) | 41 (Moderate) | 37 (Moderate) | 50 (Unhealthy for Sensitive Groups) | 65 (Unhealthy for Sensitive Groups) | 64 (Unhealthy for Sensitive Groups) | 79 (Unhealthy for Sensitive Groups) | 71 (Unhealthy for Sensitive Groups) | 102 (Unhealthy) | 74 (Unhealthy for Sensitive Groups) | 80 (Unhealthy) | 83 (Unhealthy) |
| so2 | 10 (Good) | 9.4 (Good) | 9 (Good) | 7.3 (Good) | 9 (Good) | 11 (Good) | 9.3 (Good) | 7.4 (Good) | 7.8 (Good) | 8.4 (Good) | 6.2 (Good) | 7.7 (Good) | 8.5 (Good) | 10 (Good) | 11 (Good) | 11 (Good) | 11 (Good) | 11 (Good) | 11 (Good) | 9.3 (Good) |
PM2,5 61 (Unhealthy)
particulate matter (PM2.5) dustNO2 22 (Good)
nitrogen dioxide (NO2)PM10 69 (Unhealthy for Sensitive Groups)
particulate matter (PM10) suspended dustCO 219 (Good)
carbon monoxide (CO)O3 0.05 (Good)
ozone (O3)SO2 7.7 (Good)
sulfur dioxide (SO2)鱼新街
| index | 2022-05-27 |
|---|---|
| pm25 | 28 |
| no2 | 22 |
| pm10 | 35 |
| co | 579 |
| o3 | 22 |
| so2 | 4.6 |
鱼新街
| index | 2020-05 | 2020-04 | 2020-03 | 2020-02 | 2020-01 | 2019-12 | 2019-11 | 2019-10 | 2019-09 | 2019-08 | 2019-07 | 2019-06 | 2019-05 | 2019-04 | 2019-03 | 2019-02 | 2019-01 | 2018-12 | 2018-11 | 2018-10 |
|---|---|---|---|---|---|---|---|---|---|---|---|---|---|---|---|---|---|---|---|---|
| pm25 | 27 | 33 | 39 | 51 | 48 | 64 | 37 | 26 | 32 | 23 | 20 | 26 | 33 | 33 | 51 | 47 | 77 | 49 | 47 | 45 |
| co | 596 | 625 | 647 | 927 | 1 | 1 | 749 | 754 | 865 | 808 | 931 | 944 | 859 | 924 | 991 | 1 | 1 | 1 | 945 | 1 |
| no2 | 36 | 46 | 37 | 23 | 36 | 44 | 41 | 40 | 42 | 31 | 28 | 34 | 35 | 40 | 46 | 31 | 44 | 44 | 45 | 46 |
| o3 | 178 | 98 | 97 | 56 | 42 | 30 | 37 | 60 | 136 | 183 | 150 | 131 | 115 | 148 | 88 | 65 | 38 | 24 | 41 | 31 |
| pm10 | 53 | 56 | 61 | 66 | 69 | 95 | 61 | 44 | 51 | 41 | 37 | 50 | 65 | 64 | 79 | 71 | 102 | 74 | 80 | 83 |
| so2 | 10 | 9.4 | 9 | 7.3 | 9 | 11 | 9.3 | 7.4 | 7.8 | 8.4 | 6.2 | 7.7 | 8.5 | 10 | 11 | 11 | 11 | 11 | 11 | 9.3 |