Air Pollution in Yulinshi: Real-time Air Quality Index and smog alert.
Pollution and air quality forecast for Yulinshi. Today is Tuesday, June 2, 2026. The following air pollution values have been recorded for Yulinshi:- particulate matter (PM2.5) dust - 61 (Unhealthy)
- nitrogen dioxide (NO2) - 22 (Good)
- particulate matter (PM10) suspended dust - 69 (Unhealthy for Sensitive Groups)
- carbon monoxide (CO) - 219 (Good)
- ozone (O3) - 0 (Good)
- sulfur dioxide (SO2) - 8 (Good)

What is the air quality in Yulinshi today? Is the air polluted in Yulinshi?. Is there smog?
What is the current level of PM2.5 in Yulinshi? (particulate matter (PM2.5) dust)
Today's PM2.5 level is:
61 (Unhealthy)
For comparison, the highest level of PM2.5 in Yulinshi in the last 7 days was: 28 (Friday, May 27, 2022) and the lowest: 28 (Friday, May 27, 2022).
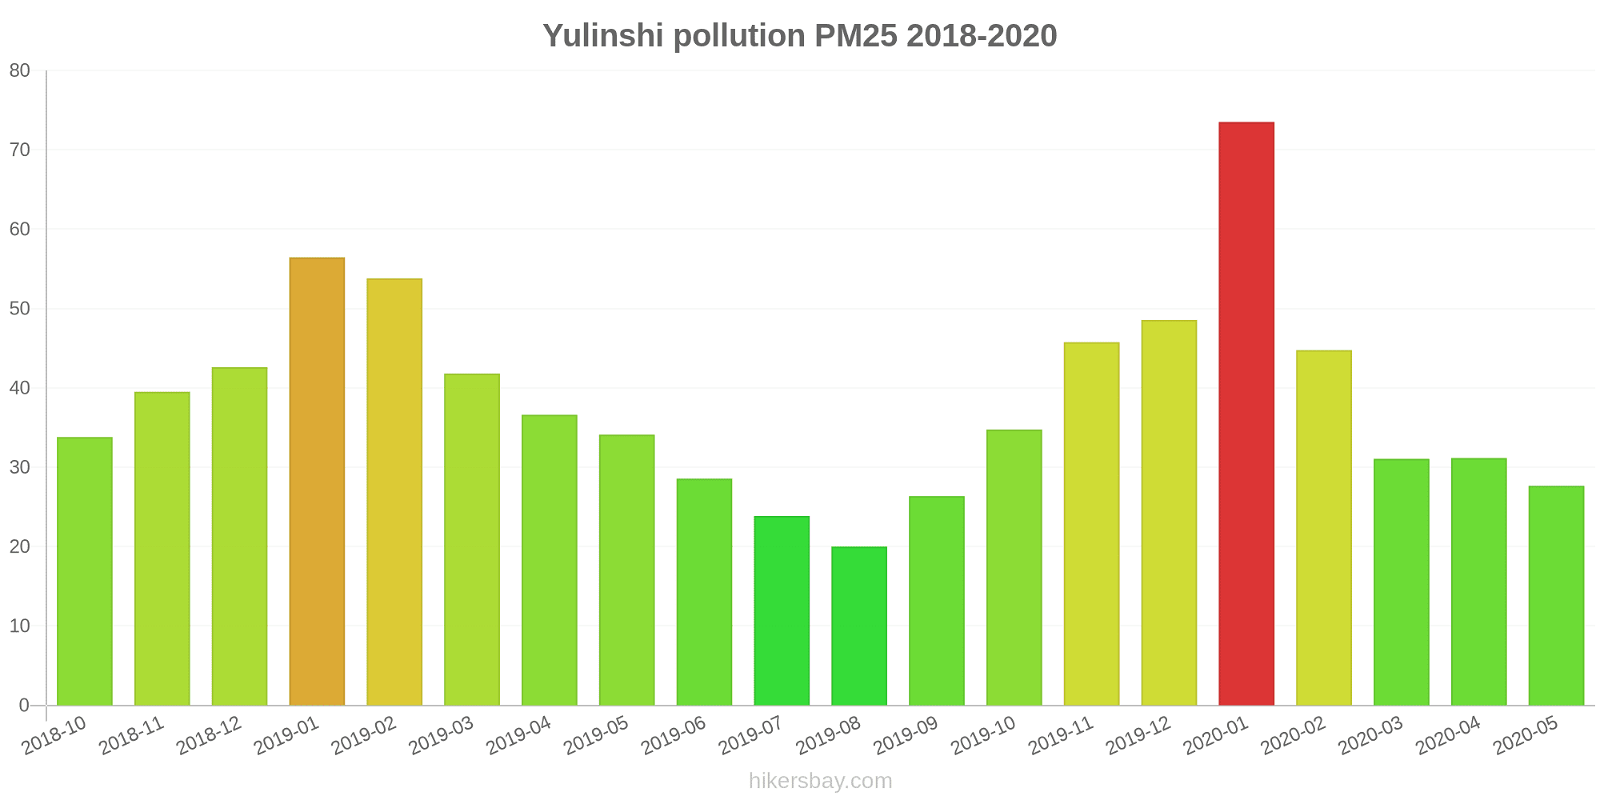
The highest PM2.5 values were recorded: 74 (January 2020).
The lowest level of particulate matter PM2.5 pollution occurs in month: August (20).
How high is the level of NO2? (nitrogen dioxide (NO2))
22 (Good)
What is the level of PM10 today in Yulinshi? (particulate matter (PM10) suspended dust)
The current level of particulate matter PM10 in Yulinshi is:
69 (Unhealthy for Sensitive Groups)
The highest PM10 values usually occur in month: 95 (May 2019).
The lowest value of particulate matter PM10 pollution in Yulinshi is usually recorded in: August (41).
How high is the CO level? (carbon monoxide (CO))
219 (Good)
How is the O3 level today in Yulinshi? (ozone (O3))
0 (Good)
What is the level of SO2 pollution? (sulfur dioxide (SO2))
8 (Good)
Current data Friday, May 27, 2022, 3:00 PM
PM2,5 61 (Unhealthy)
NO2 22 (Good)
PM10 69 (Unhealthy for Sensitive Groups)
CO 219 (Good)
O3 0 (Good)
SO2 8 (Good)
Data on air pollution from recent days in Yulinshi
index
2022-05-27
pm25
28
Moderate
no2
22
Good
pm10
35
Moderate
co
579
Good
o3
22
Good
so2
5
Good
data source »
Air pollution in Yulinshi from October 2018 to May 2020
index
2020-05
2020-04
2020-03
2020-02
2020-01
2019-12
2019-11
2019-10
2019-09
2019-08
2019-07
2019-06
2019-05
2019-04
2019-03
2019-02
2019-01
2018-12
2018-11
2018-10
pm25
28 (Moderate)
31 (Moderate)
31 (Moderate)
45 (Unhealthy for Sensitive Groups)
74 (Unhealthy)
49 (Unhealthy for Sensitive Groups)
46 (Unhealthy for Sensitive Groups)
35 (Moderate)
26 (Moderate)
20 (Moderate)
24 (Moderate)
29 (Moderate)
34 (Moderate)
37 (Unhealthy for Sensitive Groups)
42 (Unhealthy for Sensitive Groups)
54 (Unhealthy for Sensitive Groups)
56 (Unhealthy)
43 (Unhealthy for Sensitive Groups)
40 (Unhealthy for Sensitive Groups)
34 (Moderate)
co
545 (Good)
612 (Good)
727 (Good)
482 (Good)
1 (Good)
1 (Good)
1 (Good)
861 (Good)
764 (Good)
701 (Good)
652 (Good)
651 (Good)
599 (Good)
673 (Good)
1 (Good)
1 (Good)
1 (Good)
1 (Good)
1 (Good)
1 (Good)
no2
32 (Good)
49 (Moderate)
39 (Good)
39 (Good)
54 (Moderate)
55 (Moderate)
47 (Moderate)
41 (Moderate)
39 (Good)
32 (Good)
31 (Good)
30 (Good)
35 (Good)
42 (Moderate)
54 (Moderate)
52 (Moderate)
64 (Moderate)
61 (Moderate)
55 (Moderate)
40 (Moderate)
o3
135 (Unhealthy for Sensitive Groups)
131 (Unhealthy for Sensitive Groups)
111 (Moderate)
94 (Moderate)
84 (Moderate)
70 (Good)
76 (Moderate)
99 (Moderate)
141 (Unhealthy for Sensitive Groups)
143 (Unhealthy for Sensitive Groups)
168 (Unhealthy)
161 (Unhealthy)
136 (Unhealthy for Sensitive Groups)
126 (Unhealthy for Sensitive Groups)
102 (Moderate)
85 (Moderate)
60 (Good)
56 (Good)
77 (Moderate)
95 (Moderate)
pm10
86 (Unhealthy)
86 (Unhealthy)
84 (Unhealthy)
82 (Unhealthy)
86 (Unhealthy)
75 (Unhealthy for Sensitive Groups)
90 (Unhealthy)
75 (Unhealthy for Sensitive Groups)
54 (Unhealthy for Sensitive Groups)
41 (Moderate)
44 (Moderate)
50 (Unhealthy for Sensitive Groups)
95 (Unhealthy)
84 (Unhealthy)
86 (Unhealthy)
91 (Unhealthy)
94 (Unhealthy)
88 (Unhealthy)
89 (Unhealthy)
68 (Unhealthy for Sensitive Groups)
so2
9.4 (Good)
11 (Good)
14 (Good)
15 (Good)
25 (Good)
23 (Good)
16 (Good)
12 (Good)
9.1 (Good)
9 (Good)
8.6 (Good)
9.5 (Good)
9.1 (Good)
11 (Good)
20 (Good)
26 (Good)
41 (Good)
35 (Good)
26 (Good)
15 (Good)
data source »
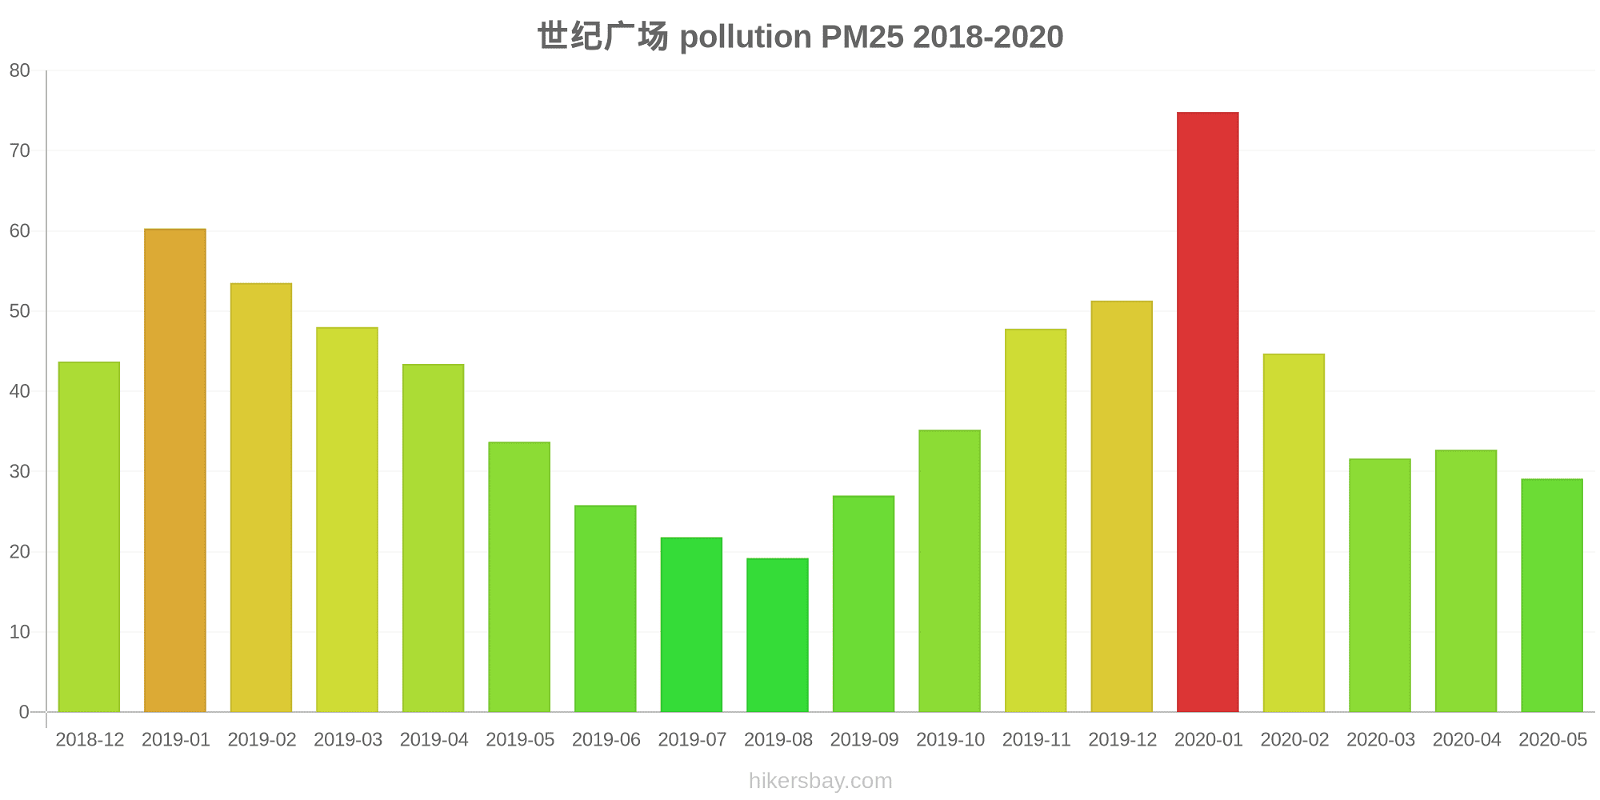
世纪广场
Friday, May 27, 2022, 3:00 PM
PM2,5 61 (Unhealthy)
particulate matter (PM2.5) dust
NO2 22 (Good)
nitrogen dioxide (NO2)
PM10 69 (Unhealthy for Sensitive Groups)
particulate matter (PM10) suspended dust
CO 219 (Good)
carbon monoxide (CO)
O3 0.05 (Good)
ozone (O3)
SO2 7.7 (Good)
sulfur dioxide (SO2)
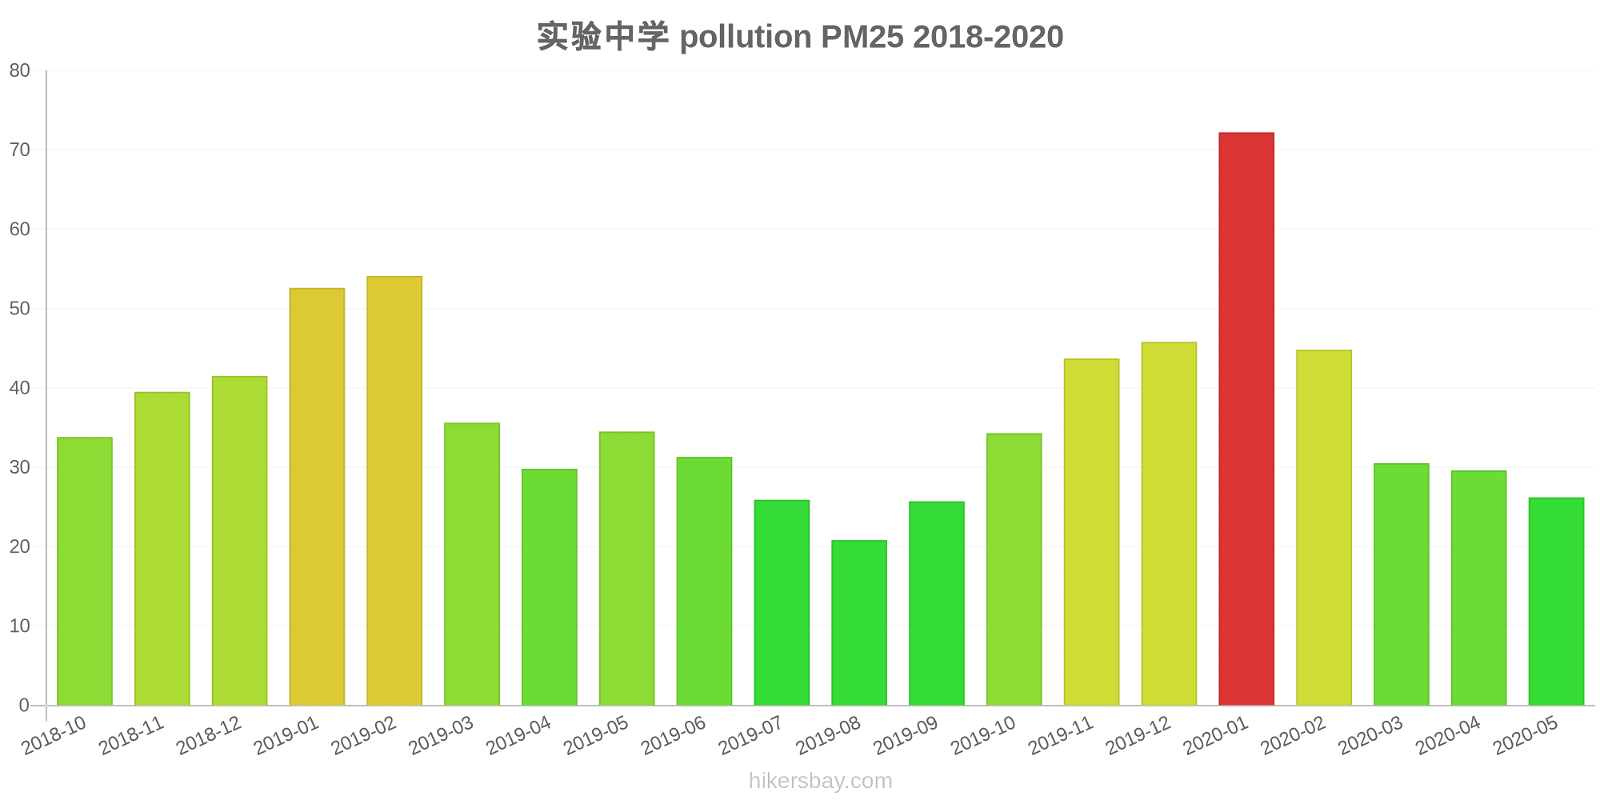
实验中学
Friday, May 27, 2022, 3:00 PM
PM2,5 61 (Unhealthy)
particulate matter (PM2.5) dust
NO2 22 (Good)
nitrogen dioxide (NO2)
PM10 69 (Unhealthy for Sensitive Groups)
particulate matter (PM10) suspended dust
CO 219 (Good)
carbon monoxide (CO)
O3 0.05 (Good)
ozone (O3)
SO2 7.7 (Good)
sulfur dioxide (SO2)
世纪广场
index
2022-05-27
pm25
28
no2
22
pm10
35
co
579
o3
22
so2
4.6
实验中学
index
2022-05-27
pm25
28
no2
22
pm10
35
co
579
o3
22
so2
4.6
世纪广场
2018-12 2020-05
index
2020-05
2020-04
2020-03
2020-02
2020-01
2019-12
2019-11
2019-10
2019-09
2019-08
2019-07
2019-06
2019-05
2019-04
2019-03
2019-02
2019-01
2018-12
pm25
29
33
32
45
75
51
48
35
27
19
22
26
34
43
48
54
60
44
co
583
677
831
1
1
1
1
905
773
718
684
649
651
682
1
1
1
1
no2
32
49
39
40
57
56
49
42
39
34
32
31
37
42
58
55
65
64
o3
132
127
110
89
81
68
74
99
140
141
168
162
137
122
98
86
62
55
pm10
92
85
80
79
87
77
92
78
56
41
45
52
97
88
90
91
99
83
so2
9.7
11
16
17
27
25
16
14
11
10
9.9
11
9.4
12
20
25
42
38
实验中学
2018-10 2020-05
index
2020-05
2020-04
2020-03
2020-02
2020-01
2019-12
2019-11
2019-10
2019-09
2019-08
2019-07
2019-06
2019-05
2019-04
2019-03
2019-02
2019-01
2018-12
2018-11
2018-10
pm25
26
30
31
45
72
46
44
34
26
21
26
31
35
30
36
54
53
42
40
34
co
507
546
622
963
1
1
1
817
754
684
619
653
547
663
1
1
1
1
1
1
no2
32
48
38
39
51
54
45
40
39
30
29
28
33
42
51
48
63
58
55
40
o3
138
134
111
99
87
71
79
99
141
144
167
160
135
130
105
84
57
56
77
95
pm10
80
86
88
85
85
74
89
72
51
40
44
48
92
79
82
92
89
93
89
68
so2
9.1
12
11
13
23
21
16
10
7.6
7.8
7.3
8.4
8.7
11
20
27
40
33
26
15
* Pollution data source:
https://openaq.org
(ChinaAQIData)
The data is licensed under CC-By 4.0
PM2,5 61 (Unhealthy)
NO2 22 (Good)
PM10 69 (Unhealthy for Sensitive Groups)
CO 219 (Good)
O3 0 (Good)
SO2 8 (Good)
Data on air pollution from recent days in Yulinshi
| index | 2022-05-27 |
|---|---|
| pm25 | 28 Moderate |
| no2 | 22 Good |
| pm10 | 35 Moderate |
| co | 579 Good |
| o3 | 22 Good |
| so2 | 5 Good |

| index | 2020-05 | 2020-04 | 2020-03 | 2020-02 | 2020-01 | 2019-12 | 2019-11 | 2019-10 | 2019-09 | 2019-08 | 2019-07 | 2019-06 | 2019-05 | 2019-04 | 2019-03 | 2019-02 | 2019-01 | 2018-12 | 2018-11 | 2018-10 |
|---|---|---|---|---|---|---|---|---|---|---|---|---|---|---|---|---|---|---|---|---|
| pm25 | 28 (Moderate) | 31 (Moderate) | 31 (Moderate) | 45 (Unhealthy for Sensitive Groups) | 74 (Unhealthy) | 49 (Unhealthy for Sensitive Groups) | 46 (Unhealthy for Sensitive Groups) | 35 (Moderate) | 26 (Moderate) | 20 (Moderate) | 24 (Moderate) | 29 (Moderate) | 34 (Moderate) | 37 (Unhealthy for Sensitive Groups) | 42 (Unhealthy for Sensitive Groups) | 54 (Unhealthy for Sensitive Groups) | 56 (Unhealthy) | 43 (Unhealthy for Sensitive Groups) | 40 (Unhealthy for Sensitive Groups) | 34 (Moderate) |
| co | 545 (Good) | 612 (Good) | 727 (Good) | 482 (Good) | 1 (Good) | 1 (Good) | 1 (Good) | 861 (Good) | 764 (Good) | 701 (Good) | 652 (Good) | 651 (Good) | 599 (Good) | 673 (Good) | 1 (Good) | 1 (Good) | 1 (Good) | 1 (Good) | 1 (Good) | 1 (Good) |
| no2 | 32 (Good) | 49 (Moderate) | 39 (Good) | 39 (Good) | 54 (Moderate) | 55 (Moderate) | 47 (Moderate) | 41 (Moderate) | 39 (Good) | 32 (Good) | 31 (Good) | 30 (Good) | 35 (Good) | 42 (Moderate) | 54 (Moderate) | 52 (Moderate) | 64 (Moderate) | 61 (Moderate) | 55 (Moderate) | 40 (Moderate) |
| o3 | 135 (Unhealthy for Sensitive Groups) | 131 (Unhealthy for Sensitive Groups) | 111 (Moderate) | 94 (Moderate) | 84 (Moderate) | 70 (Good) | 76 (Moderate) | 99 (Moderate) | 141 (Unhealthy for Sensitive Groups) | 143 (Unhealthy for Sensitive Groups) | 168 (Unhealthy) | 161 (Unhealthy) | 136 (Unhealthy for Sensitive Groups) | 126 (Unhealthy for Sensitive Groups) | 102 (Moderate) | 85 (Moderate) | 60 (Good) | 56 (Good) | 77 (Moderate) | 95 (Moderate) |
| pm10 | 86 (Unhealthy) | 86 (Unhealthy) | 84 (Unhealthy) | 82 (Unhealthy) | 86 (Unhealthy) | 75 (Unhealthy for Sensitive Groups) | 90 (Unhealthy) | 75 (Unhealthy for Sensitive Groups) | 54 (Unhealthy for Sensitive Groups) | 41 (Moderate) | 44 (Moderate) | 50 (Unhealthy for Sensitive Groups) | 95 (Unhealthy) | 84 (Unhealthy) | 86 (Unhealthy) | 91 (Unhealthy) | 94 (Unhealthy) | 88 (Unhealthy) | 89 (Unhealthy) | 68 (Unhealthy for Sensitive Groups) |
| so2 | 9.4 (Good) | 11 (Good) | 14 (Good) | 15 (Good) | 25 (Good) | 23 (Good) | 16 (Good) | 12 (Good) | 9.1 (Good) | 9 (Good) | 8.6 (Good) | 9.5 (Good) | 9.1 (Good) | 11 (Good) | 20 (Good) | 26 (Good) | 41 (Good) | 35 (Good) | 26 (Good) | 15 (Good) |
PM2,5 61 (Unhealthy)
particulate matter (PM2.5) dustNO2 22 (Good)
nitrogen dioxide (NO2)PM10 69 (Unhealthy for Sensitive Groups)
particulate matter (PM10) suspended dustCO 219 (Good)
carbon monoxide (CO)O3 0.05 (Good)
ozone (O3)SO2 7.7 (Good)
sulfur dioxide (SO2)PM2,5 61 (Unhealthy)
particulate matter (PM2.5) dustNO2 22 (Good)
nitrogen dioxide (NO2)PM10 69 (Unhealthy for Sensitive Groups)
particulate matter (PM10) suspended dustCO 219 (Good)
carbon monoxide (CO)O3 0.05 (Good)
ozone (O3)SO2 7.7 (Good)
sulfur dioxide (SO2)世纪广场
| index | 2022-05-27 |
|---|---|
| pm25 | 28 |
| no2 | 22 |
| pm10 | 35 |
| co | 579 |
| o3 | 22 |
| so2 | 4.6 |
实验中学
| index | 2022-05-27 |
|---|---|
| pm25 | 28 |
| no2 | 22 |
| pm10 | 35 |
| co | 579 |
| o3 | 22 |
| so2 | 4.6 |
世纪广场

| index | 2020-05 | 2020-04 | 2020-03 | 2020-02 | 2020-01 | 2019-12 | 2019-11 | 2019-10 | 2019-09 | 2019-08 | 2019-07 | 2019-06 | 2019-05 | 2019-04 | 2019-03 | 2019-02 | 2019-01 | 2018-12 |
|---|---|---|---|---|---|---|---|---|---|---|---|---|---|---|---|---|---|---|
| pm25 | 29 | 33 | 32 | 45 | 75 | 51 | 48 | 35 | 27 | 19 | 22 | 26 | 34 | 43 | 48 | 54 | 60 | 44 |
| co | 583 | 677 | 831 | 1 | 1 | 1 | 1 | 905 | 773 | 718 | 684 | 649 | 651 | 682 | 1 | 1 | 1 | 1 |
| no2 | 32 | 49 | 39 | 40 | 57 | 56 | 49 | 42 | 39 | 34 | 32 | 31 | 37 | 42 | 58 | 55 | 65 | 64 |
| o3 | 132 | 127 | 110 | 89 | 81 | 68 | 74 | 99 | 140 | 141 | 168 | 162 | 137 | 122 | 98 | 86 | 62 | 55 |
| pm10 | 92 | 85 | 80 | 79 | 87 | 77 | 92 | 78 | 56 | 41 | 45 | 52 | 97 | 88 | 90 | 91 | 99 | 83 |
| so2 | 9.7 | 11 | 16 | 17 | 27 | 25 | 16 | 14 | 11 | 10 | 9.9 | 11 | 9.4 | 12 | 20 | 25 | 42 | 38 |
实验中学

| index | 2020-05 | 2020-04 | 2020-03 | 2020-02 | 2020-01 | 2019-12 | 2019-11 | 2019-10 | 2019-09 | 2019-08 | 2019-07 | 2019-06 | 2019-05 | 2019-04 | 2019-03 | 2019-02 | 2019-01 | 2018-12 | 2018-11 | 2018-10 |
|---|---|---|---|---|---|---|---|---|---|---|---|---|---|---|---|---|---|---|---|---|
| pm25 | 26 | 30 | 31 | 45 | 72 | 46 | 44 | 34 | 26 | 21 | 26 | 31 | 35 | 30 | 36 | 54 | 53 | 42 | 40 | 34 |
| co | 507 | 546 | 622 | 963 | 1 | 1 | 1 | 817 | 754 | 684 | 619 | 653 | 547 | 663 | 1 | 1 | 1 | 1 | 1 | 1 |
| no2 | 32 | 48 | 38 | 39 | 51 | 54 | 45 | 40 | 39 | 30 | 29 | 28 | 33 | 42 | 51 | 48 | 63 | 58 | 55 | 40 |
| o3 | 138 | 134 | 111 | 99 | 87 | 71 | 79 | 99 | 141 | 144 | 167 | 160 | 135 | 130 | 105 | 84 | 57 | 56 | 77 | 95 |
| pm10 | 80 | 86 | 88 | 85 | 85 | 74 | 89 | 72 | 51 | 40 | 44 | 48 | 92 | 79 | 82 | 92 | 89 | 93 | 89 | 68 |
| so2 | 9.1 | 12 | 11 | 13 | 23 | 21 | 16 | 10 | 7.6 | 7.8 | 7.3 | 8.4 | 8.7 | 11 | 20 | 27 | 40 | 33 | 26 | 15 |