Air Pollution in Yuncheng: Real-time Air Quality Index and smog alert.
Pollution and air quality forecast for Yuncheng. Today is Tuesday, June 16, 2026. The following air pollution values have been recorded for Yuncheng:- particulate matter (PM2.5) dust - 61 (Unhealthy)
- nitrogen dioxide (NO2) - 22 (Good)
- particulate matter (PM10) suspended dust - 69 (Unhealthy for Sensitive Groups)
- carbon monoxide (CO) - 219 (Good)
- ozone (O3) - 0 (Good)
- sulfur dioxide (SO2) - 8 (Good)

What is the air quality in Yuncheng today? Is the air polluted in Yuncheng?. Is there smog?
What is the current level of PM2.5 in Yuncheng? (particulate matter (PM2.5) dust)
Today's PM2.5 level is:
61 (Unhealthy)
For comparison, the highest level of PM2.5 in Yuncheng in the last 7 days was: 28 (Friday, May 27, 2022) and the lowest: 28 (Friday, May 27, 2022).
The highest PM2.5 values were recorded: 143 (January 2019).
The lowest level of particulate matter PM2.5 pollution occurs in month: July (29).
How high is the level of NO2? (nitrogen dioxide (NO2))
22 (Good)
What is the level of PM10 today in Yuncheng? (particulate matter (PM10) suspended dust)
The current level of particulate matter PM10 in Yuncheng is:
69 (Unhealthy for Sensitive Groups)
The highest PM10 values usually occur in month: 199 (January 2019).
The lowest value of particulate matter PM10 pollution in Yuncheng is usually recorded in: August (54).
How high is the CO level? (carbon monoxide (CO))
219 (Good)
How is the O3 level today in Yuncheng? (ozone (O3))
0 (Good)
What is the level of SO2 pollution? (sulfur dioxide (SO2))
8 (Good)
Current data Friday, May 27, 2022, 3:00 PM
PM2,5 61 (Unhealthy)
NO2 22 (Good)
PM10 69 (Unhealthy for Sensitive Groups)
CO 219 (Good)
O3 0 (Good)
SO2 8 (Good)
Data on air pollution from recent days in Yuncheng
index
2022-05-27
pm25
28
Moderate
no2
22
Good
pm10
35
Moderate
co
579
Good
o3
22
Good
so2
5
Good
data source »
Air pollution in Yuncheng from October 2018 to May 2020
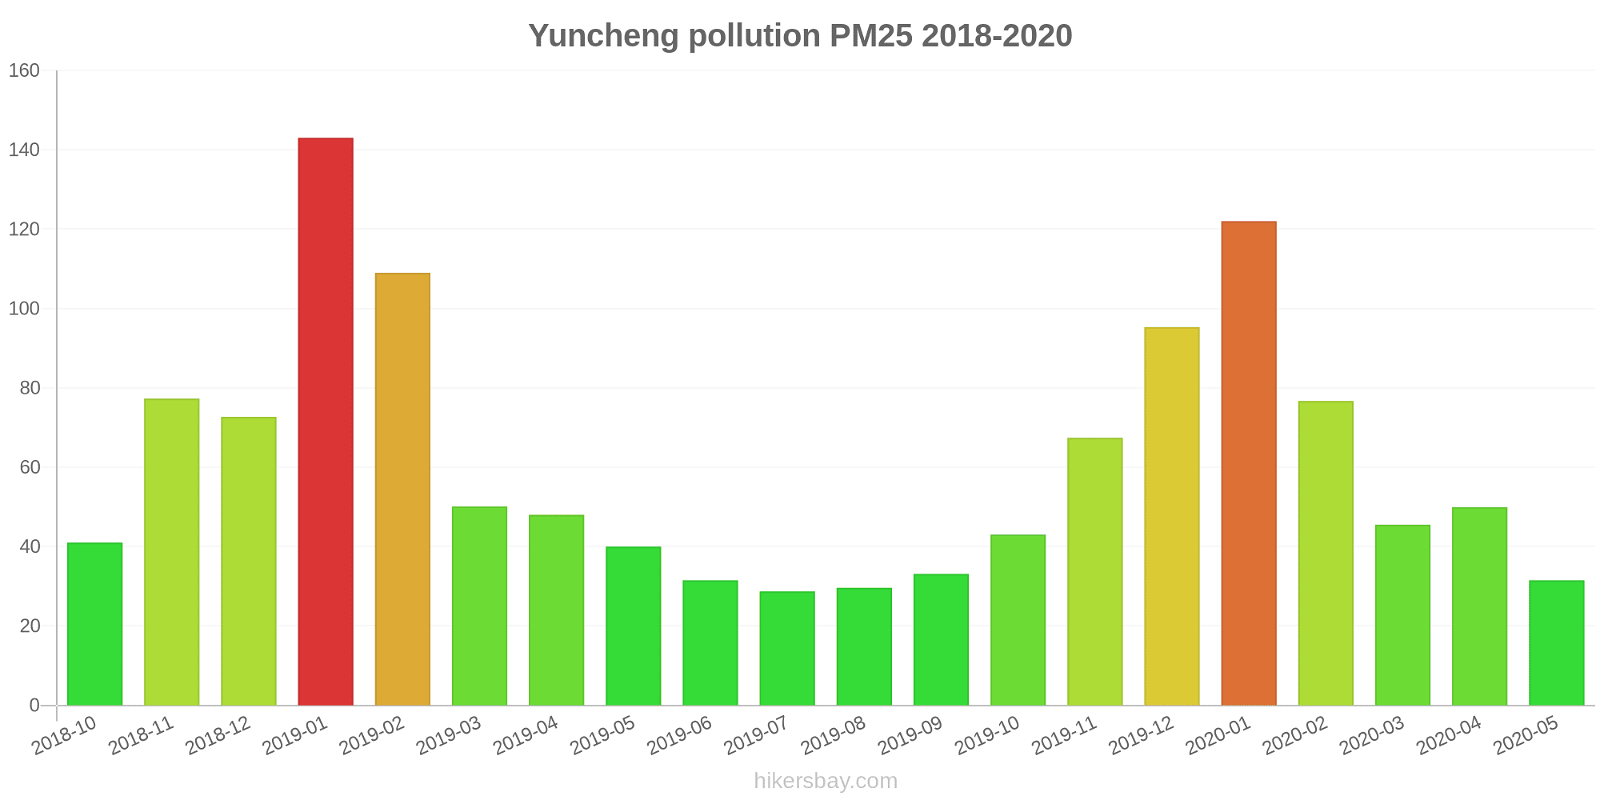
index
2020-05
2020-04
2020-03
2020-02
2020-01
2019-12
2019-11
2019-10
2019-09
2019-08
2019-07
2019-06
2019-05
2019-04
2019-03
2019-02
2019-01
2018-12
2018-11
2018-10
pm25
32 (Moderate)
50 (Unhealthy for Sensitive Groups)
46 (Unhealthy for Sensitive Groups)
77 (Very Unhealthy)
122 (Very bad Hazardous)
95 (Very Unhealthy)
67 (Unhealthy)
43 (Unhealthy for Sensitive Groups)
33 (Moderate)
30 (Moderate)
29 (Moderate)
32 (Moderate)
40 (Unhealthy for Sensitive Groups)
48 (Unhealthy for Sensitive Groups)
50 (Unhealthy for Sensitive Groups)
109 (Very Unhealthy)
143 (Very bad Hazardous)
73 (Unhealthy)
77 (Very Unhealthy)
41 (Unhealthy for Sensitive Groups)
co
653 (Good)
782 (Good)
725 (Good)
1 (Good)
1 (Good)
1 (Good)
1 (Good)
1 (Good)
910 (Good)
974 (Good)
664 (Good)
827 (Good)
629 (Good)
961 (Good)
1 (Good)
1 (Good)
2 (Good)
1 (Good)
1 (Good)
1 (Good)
no2
20 (Good)
28 (Good)
24 (Good)
20 (Good)
32 (Good)
39 (Good)
30 (Good)
24 (Good)
18 (Good)
13 (Good)
11 (Good)
14 (Good)
14 (Good)
17 (Good)
29 (Good)
26 (Good)
46 (Moderate)
42 (Moderate)
41 (Moderate)
32 (Good)
o3
162 (Unhealthy)
146 (Unhealthy for Sensitive Groups)
122 (Unhealthy for Sensitive Groups)
119 (Moderate)
87 (Moderate)
72 (Moderate)
83 (Moderate)
102 (Moderate)
160 (Unhealthy)
169 (Unhealthy)
177 (Unhealthy)
196 (Very Unhealthy)
166 (Unhealthy)
144 (Unhealthy for Sensitive Groups)
129 (Unhealthy for Sensitive Groups)
106 (Moderate)
70 (Moderate)
55 (Good)
80 (Moderate)
91 (Moderate)
pm10
64 (Unhealthy for Sensitive Groups)
84 (Unhealthy)
90 (Unhealthy)
107 (Unhealthy)
155 (Very bad Hazardous)
139 (Very Unhealthy)
110 (Very Unhealthy)
79 (Unhealthy for Sensitive Groups)
57 (Unhealthy for Sensitive Groups)
54 (Unhealthy for Sensitive Groups)
54 (Unhealthy for Sensitive Groups)
60 (Unhealthy for Sensitive Groups)
99 (Unhealthy)
103 (Unhealthy)
105 (Unhealthy)
155 (Very bad Hazardous)
199 (Very bad Hazardous)
126 (Very Unhealthy)
123 (Very Unhealthy)
80 (Unhealthy)
so2
12 (Good)
12 (Good)
12 (Good)
18 (Good)
18 (Good)
26 (Good)
16 (Good)
10 (Good)
9.2 (Good)
13 (Good)
10 (Good)
11 (Good)
7.5 (Good)
10 (Good)
17 (Good)
20 (Good)
44 (Good)
34 (Good)
25 (Good)
17 (Good)
data source »
运城中学
Friday, May 27, 2022, 3:00 PM
PM2,5 61 (Unhealthy)
particulate matter (PM2.5) dust
NO2 22 (Good)
nitrogen dioxide (NO2)
PM10 69 (Unhealthy for Sensitive Groups)
particulate matter (PM10) suspended dust
CO 219 (Good)
carbon monoxide (CO)
O3 0.05 (Good)
ozone (O3)
SO2 7.7 (Good)
sulfur dioxide (SO2)
运城中学
index
2022-05-27
pm25
28
no2
22
pm10
35
co
579
o3
22
so2
4.6
运城中学
2018-10 2020-05
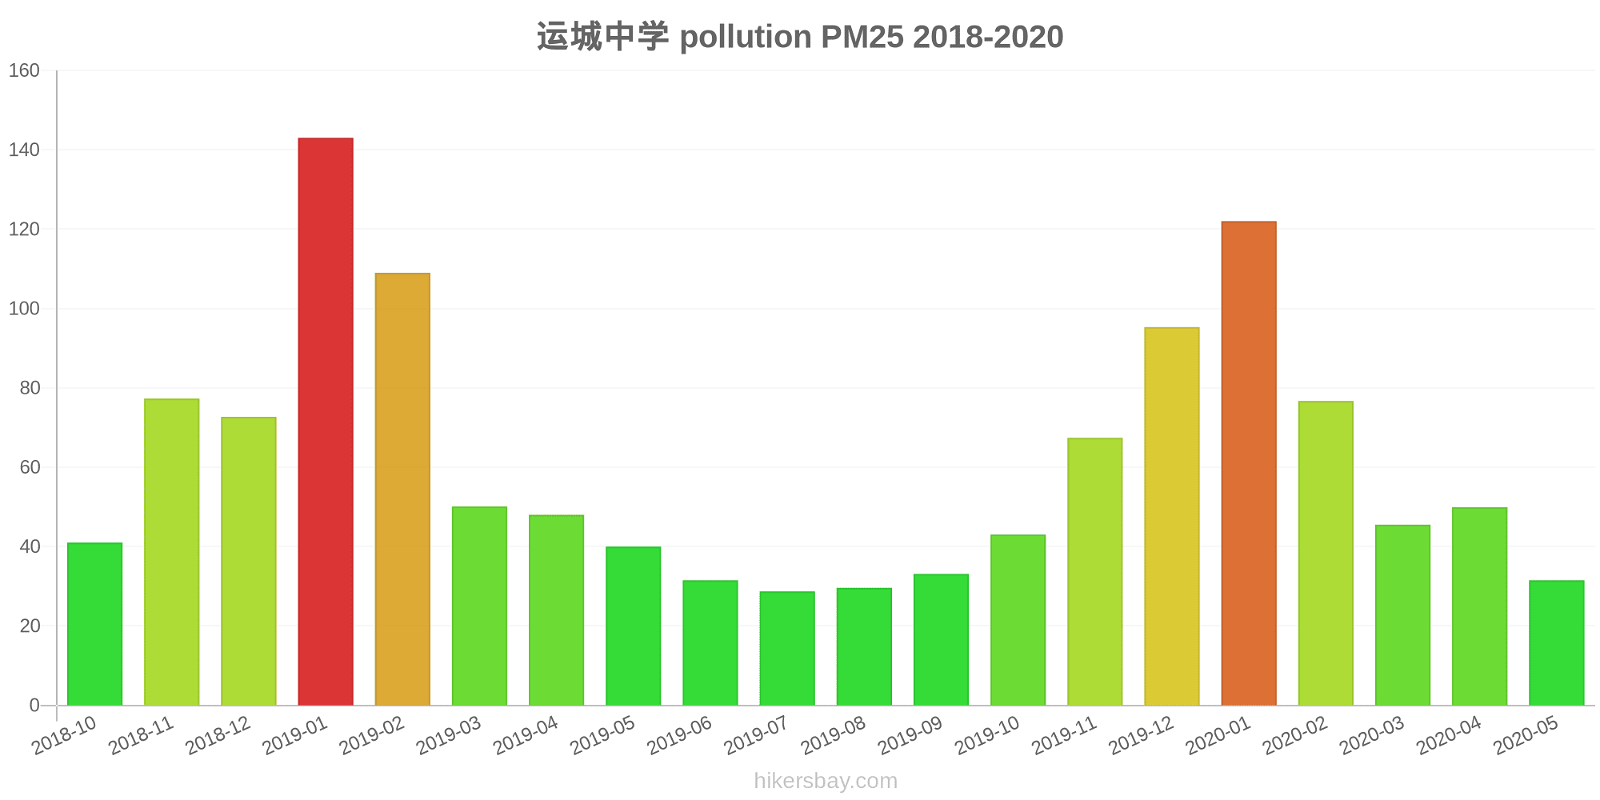
index
2020-05
2020-04
2020-03
2020-02
2020-01
2019-12
2019-11
2019-10
2019-09
2019-08
2019-07
2019-06
2019-05
2019-04
2019-03
2019-02
2019-01
2018-12
2018-11
2018-10
pm25
32
50
46
77
122
95
67
43
33
30
29
32
40
48
50
109
143
73
77
41
co
653
782
725
1
1
1
1
1
910
974
664
827
629
961
1
1
2
1
1
1
no2
20
28
24
20
32
39
30
24
18
13
11
14
14
17
29
26
46
42
41
32
o3
162
146
122
119
87
72
83
102
160
169
177
196
166
144
129
106
70
55
80
91
pm10
64
84
90
107
155
139
110
79
57
54
54
60
99
103
105
155
199
126
123
80
so2
12
12
12
18
18
26
16
10
9.2
13
10
11
7.5
10
17
20
44
34
25
17
* Pollution data source:
https://openaq.org
(ChinaAQIData)
The data is licensed under CC-By 4.0
PM2,5 61 (Unhealthy)
NO2 22 (Good)
PM10 69 (Unhealthy for Sensitive Groups)
CO 219 (Good)
O3 0 (Good)
SO2 8 (Good)
Data on air pollution from recent days in Yuncheng
| index | 2022-05-27 |
|---|---|
| pm25 | 28 Moderate |
| no2 | 22 Good |
| pm10 | 35 Moderate |
| co | 579 Good |
| o3 | 22 Good |
| so2 | 5 Good |

| index | 2020-05 | 2020-04 | 2020-03 | 2020-02 | 2020-01 | 2019-12 | 2019-11 | 2019-10 | 2019-09 | 2019-08 | 2019-07 | 2019-06 | 2019-05 | 2019-04 | 2019-03 | 2019-02 | 2019-01 | 2018-12 | 2018-11 | 2018-10 |
|---|---|---|---|---|---|---|---|---|---|---|---|---|---|---|---|---|---|---|---|---|
| pm25 | 32 (Moderate) | 50 (Unhealthy for Sensitive Groups) | 46 (Unhealthy for Sensitive Groups) | 77 (Very Unhealthy) | 122 (Very bad Hazardous) | 95 (Very Unhealthy) | 67 (Unhealthy) | 43 (Unhealthy for Sensitive Groups) | 33 (Moderate) | 30 (Moderate) | 29 (Moderate) | 32 (Moderate) | 40 (Unhealthy for Sensitive Groups) | 48 (Unhealthy for Sensitive Groups) | 50 (Unhealthy for Sensitive Groups) | 109 (Very Unhealthy) | 143 (Very bad Hazardous) | 73 (Unhealthy) | 77 (Very Unhealthy) | 41 (Unhealthy for Sensitive Groups) |
| co | 653 (Good) | 782 (Good) | 725 (Good) | 1 (Good) | 1 (Good) | 1 (Good) | 1 (Good) | 1 (Good) | 910 (Good) | 974 (Good) | 664 (Good) | 827 (Good) | 629 (Good) | 961 (Good) | 1 (Good) | 1 (Good) | 2 (Good) | 1 (Good) | 1 (Good) | 1 (Good) |
| no2 | 20 (Good) | 28 (Good) | 24 (Good) | 20 (Good) | 32 (Good) | 39 (Good) | 30 (Good) | 24 (Good) | 18 (Good) | 13 (Good) | 11 (Good) | 14 (Good) | 14 (Good) | 17 (Good) | 29 (Good) | 26 (Good) | 46 (Moderate) | 42 (Moderate) | 41 (Moderate) | 32 (Good) |
| o3 | 162 (Unhealthy) | 146 (Unhealthy for Sensitive Groups) | 122 (Unhealthy for Sensitive Groups) | 119 (Moderate) | 87 (Moderate) | 72 (Moderate) | 83 (Moderate) | 102 (Moderate) | 160 (Unhealthy) | 169 (Unhealthy) | 177 (Unhealthy) | 196 (Very Unhealthy) | 166 (Unhealthy) | 144 (Unhealthy for Sensitive Groups) | 129 (Unhealthy for Sensitive Groups) | 106 (Moderate) | 70 (Moderate) | 55 (Good) | 80 (Moderate) | 91 (Moderate) |
| pm10 | 64 (Unhealthy for Sensitive Groups) | 84 (Unhealthy) | 90 (Unhealthy) | 107 (Unhealthy) | 155 (Very bad Hazardous) | 139 (Very Unhealthy) | 110 (Very Unhealthy) | 79 (Unhealthy for Sensitive Groups) | 57 (Unhealthy for Sensitive Groups) | 54 (Unhealthy for Sensitive Groups) | 54 (Unhealthy for Sensitive Groups) | 60 (Unhealthy for Sensitive Groups) | 99 (Unhealthy) | 103 (Unhealthy) | 105 (Unhealthy) | 155 (Very bad Hazardous) | 199 (Very bad Hazardous) | 126 (Very Unhealthy) | 123 (Very Unhealthy) | 80 (Unhealthy) |
| so2 | 12 (Good) | 12 (Good) | 12 (Good) | 18 (Good) | 18 (Good) | 26 (Good) | 16 (Good) | 10 (Good) | 9.2 (Good) | 13 (Good) | 10 (Good) | 11 (Good) | 7.5 (Good) | 10 (Good) | 17 (Good) | 20 (Good) | 44 (Good) | 34 (Good) | 25 (Good) | 17 (Good) |
PM2,5 61 (Unhealthy)
particulate matter (PM2.5) dustNO2 22 (Good)
nitrogen dioxide (NO2)PM10 69 (Unhealthy for Sensitive Groups)
particulate matter (PM10) suspended dustCO 219 (Good)
carbon monoxide (CO)O3 0.05 (Good)
ozone (O3)SO2 7.7 (Good)
sulfur dioxide (SO2)运城中学
| index | 2022-05-27 |
|---|---|
| pm25 | 28 |
| no2 | 22 |
| pm10 | 35 |
| co | 579 |
| o3 | 22 |
| so2 | 4.6 |
运城中学

| index | 2020-05 | 2020-04 | 2020-03 | 2020-02 | 2020-01 | 2019-12 | 2019-11 | 2019-10 | 2019-09 | 2019-08 | 2019-07 | 2019-06 | 2019-05 | 2019-04 | 2019-03 | 2019-02 | 2019-01 | 2018-12 | 2018-11 | 2018-10 |
|---|---|---|---|---|---|---|---|---|---|---|---|---|---|---|---|---|---|---|---|---|
| pm25 | 32 | 50 | 46 | 77 | 122 | 95 | 67 | 43 | 33 | 30 | 29 | 32 | 40 | 48 | 50 | 109 | 143 | 73 | 77 | 41 |
| co | 653 | 782 | 725 | 1 | 1 | 1 | 1 | 1 | 910 | 974 | 664 | 827 | 629 | 961 | 1 | 1 | 2 | 1 | 1 | 1 |
| no2 | 20 | 28 | 24 | 20 | 32 | 39 | 30 | 24 | 18 | 13 | 11 | 14 | 14 | 17 | 29 | 26 | 46 | 42 | 41 | 32 |
| o3 | 162 | 146 | 122 | 119 | 87 | 72 | 83 | 102 | 160 | 169 | 177 | 196 | 166 | 144 | 129 | 106 | 70 | 55 | 80 | 91 |
| pm10 | 64 | 84 | 90 | 107 | 155 | 139 | 110 | 79 | 57 | 54 | 54 | 60 | 99 | 103 | 105 | 155 | 199 | 126 | 123 | 80 |
| so2 | 12 | 12 | 12 | 18 | 18 | 26 | 16 | 10 | 9.2 | 13 | 10 | 11 | 7.5 | 10 | 17 | 20 | 44 | 34 | 25 | 17 |