Air Pollution in Zhangye Shi: Real-time Air Quality Index and smog alert.
Pollution and air quality forecast for Zhangye Shi. Today is Tuesday, June 2, 2026. The following air pollution values have been recorded for Zhangye Shi:- particulate matter (PM2.5) dust - 61 (Unhealthy)
- nitrogen dioxide (NO2) - 22 (Good)
- particulate matter (PM10) suspended dust - 69 (Unhealthy for Sensitive Groups)
- carbon monoxide (CO) - 219 (Good)
- ozone (O3) - 0 (Good)
- sulfur dioxide (SO2) - 8 (Good)

What is the air quality in Zhangye Shi today? Is the air polluted in Zhangye Shi?. Is there smog?
What is the current level of PM2.5 in Zhangye Shi? (particulate matter (PM2.5) dust)
Today's PM2.5 level is:
61 (Unhealthy)
For comparison, the highest level of PM2.5 in Zhangye Shi in the last 7 days was: 28 (Friday, May 27, 2022) and the lowest: 28 (Friday, May 27, 2022).
The highest PM2.5 values were recorded: 91 (May 2020).
The lowest level of particulate matter PM2.5 pollution occurs in month: July (16).
How high is the level of NO2? (nitrogen dioxide (NO2))
22 (Good)
What is the level of PM10 today in Zhangye Shi? (particulate matter (PM10) suspended dust)
The current level of particulate matter PM10 in Zhangye Shi is:
69 (Unhealthy for Sensitive Groups)
The highest PM10 values usually occur in month: 203 (May 2020).
The lowest value of particulate matter PM10 pollution in Zhangye Shi is usually recorded in: July (36).
How high is the CO level? (carbon monoxide (CO))
219 (Good)
How is the O3 level today in Zhangye Shi? (ozone (O3))
0 (Good)
What is the level of SO2 pollution? (sulfur dioxide (SO2))
8 (Good)
Current data Friday, May 27, 2022, 3:00 PM
PM2,5 61 (Unhealthy)
NO2 22 (Good)
PM10 69 (Unhealthy for Sensitive Groups)
CO 219 (Good)
O3 0 (Good)
SO2 8 (Good)
Data on air pollution from recent days in Zhangye Shi
index
2022-05-27
pm25
28
Moderate
no2
22
Good
pm10
35
Moderate
co
579
Good
o3
22
Good
so2
5
Good
data source »
Air pollution in Zhangye Shi from October 2018 to May 2020
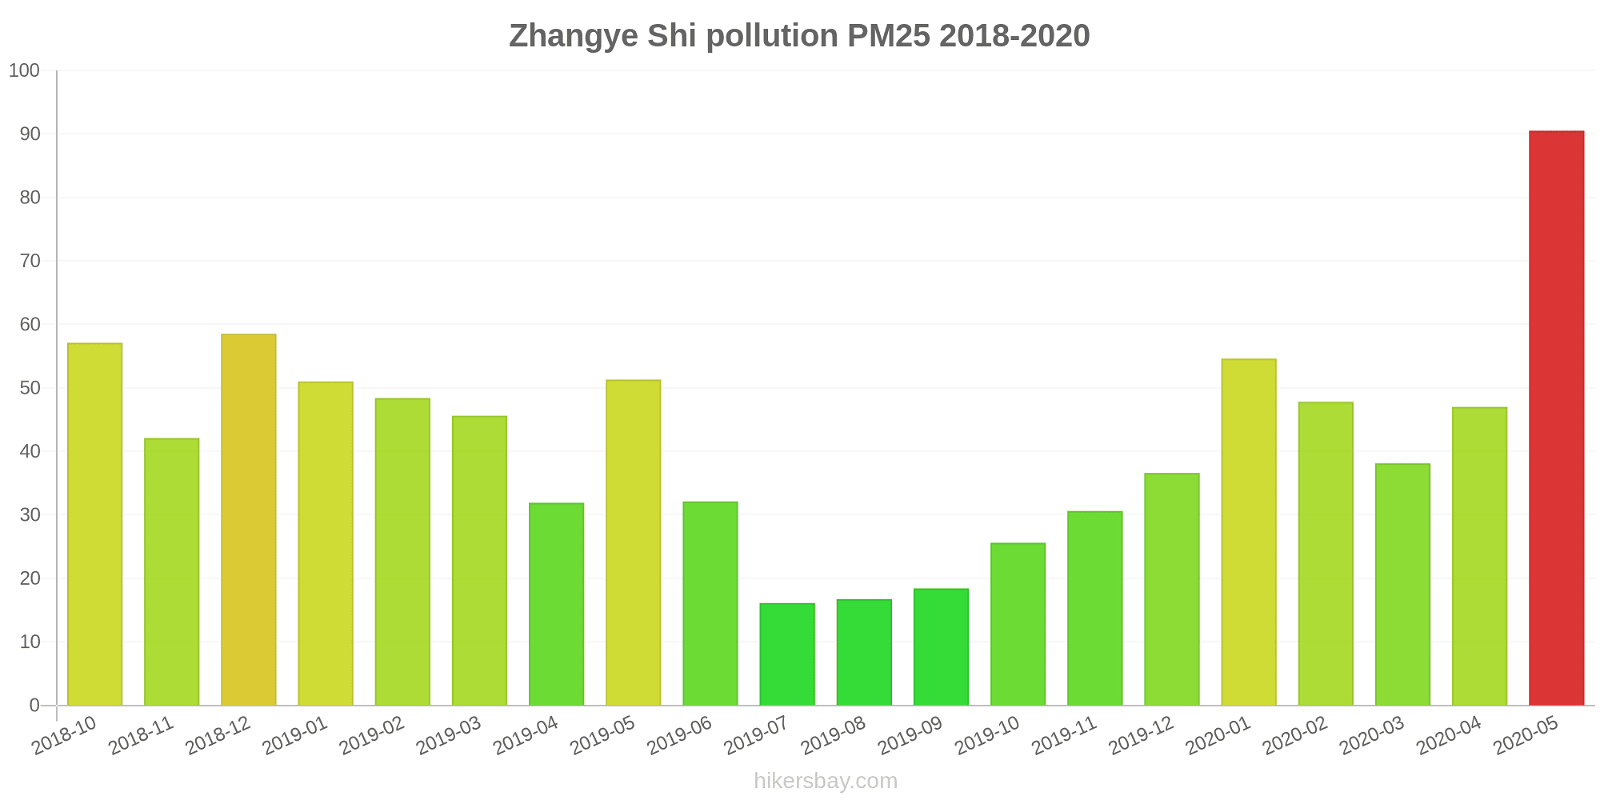
index
2020-05
2020-04
2020-03
2020-02
2020-01
2019-12
2019-11
2019-10
2019-09
2019-08
2019-07
2019-06
2019-05
2019-04
2019-03
2019-02
2019-01
2018-12
2018-11
2018-10
pm25
91 (Very Unhealthy)
47 (Unhealthy for Sensitive Groups)
38 (Unhealthy for Sensitive Groups)
48 (Unhealthy for Sensitive Groups)
55 (Unhealthy for Sensitive Groups)
37 (Unhealthy for Sensitive Groups)
31 (Moderate)
26 (Moderate)
18 (Moderate)
17 (Moderate)
16 (Moderate)
32 (Moderate)
51 (Unhealthy for Sensitive Groups)
32 (Moderate)
46 (Unhealthy for Sensitive Groups)
48 (Unhealthy for Sensitive Groups)
51 (Unhealthy for Sensitive Groups)
59 (Unhealthy)
42 (Unhealthy for Sensitive Groups)
57 (Unhealthy)
co
424 (Good)
436 (Good)
424 (Good)
496 (Good)
761 (Good)
595 (Good)
497 (Good)
299 (Good)
334 (Good)
249 (Good)
318 (Good)
219 (Good)
253 (Good)
315 (Good)
453 (Good)
518 (Good)
621 (Good)
661 (Good)
628 (Good)
627 (Good)
no2
19 (Good)
23 (Good)
25 (Good)
17 (Good)
28 (Good)
36 (Good)
35 (Good)
24 (Good)
17 (Good)
13 (Good)
12 (Good)
12 (Good)
11 (Good)
18 (Good)
22 (Good)
15 (Good)
26 (Good)
29 (Good)
27 (Good)
30 (Good)
o3
123 (Unhealthy for Sensitive Groups)
121 (Unhealthy for Sensitive Groups)
117 (Moderate)
102 (Moderate)
88 (Moderate)
76 (Moderate)
91 (Moderate)
98 (Moderate)
128 (Unhealthy for Sensitive Groups)
145 (Unhealthy for Sensitive Groups)
142 (Unhealthy for Sensitive Groups)
142 (Unhealthy for Sensitive Groups)
135 (Unhealthy for Sensitive Groups)
125 (Unhealthy for Sensitive Groups)
119 (Moderate)
102 (Moderate)
88 (Moderate)
71 (Moderate)
85 (Moderate)
103 (Moderate)
pm10
203 (Very bad Hazardous)
120 (Very Unhealthy)
87 (Unhealthy)
95 (Unhealthy)
65 (Unhealthy for Sensitive Groups)
53 (Unhealthy for Sensitive Groups)
63 (Unhealthy for Sensitive Groups)
65 (Unhealthy for Sensitive Groups)
54 (Unhealthy for Sensitive Groups)
39 (Moderate)
36 (Moderate)
66 (Unhealthy for Sensitive Groups)
132 (Very Unhealthy)
80 (Unhealthy)
103 (Unhealthy)
106 (Unhealthy)
77 (Unhealthy for Sensitive Groups)
136 (Very Unhealthy)
110 (Very Unhealthy)
143 (Very Unhealthy)
so2
8.9 (Good)
11 (Good)
8.9 (Good)
11 (Good)
12 (Good)
14 (Good)
14 (Good)
8.4 (Good)
6.9 (Good)
7.3 (Good)
7.8 (Good)
13 (Good)
11 (Good)
11 (Good)
12 (Good)
12 (Good)
16 (Good)
13 (Good)
15 (Good)
18 (Good)
data source »
科委
Friday, May 27, 2022, 3:00 PM
PM2,5 61 (Unhealthy)
particulate matter (PM2.5) dust
NO2 22 (Good)
nitrogen dioxide (NO2)
PM10 69 (Unhealthy for Sensitive Groups)
particulate matter (PM10) suspended dust
CO 219 (Good)
carbon monoxide (CO)
O3 0.05 (Good)
ozone (O3)
SO2 7.7 (Good)
sulfur dioxide (SO2)
科委
index
2022-05-27
pm25
28
no2
22
pm10
35
co
579
o3
22
so2
4.6
科委
2018-10 2020-05
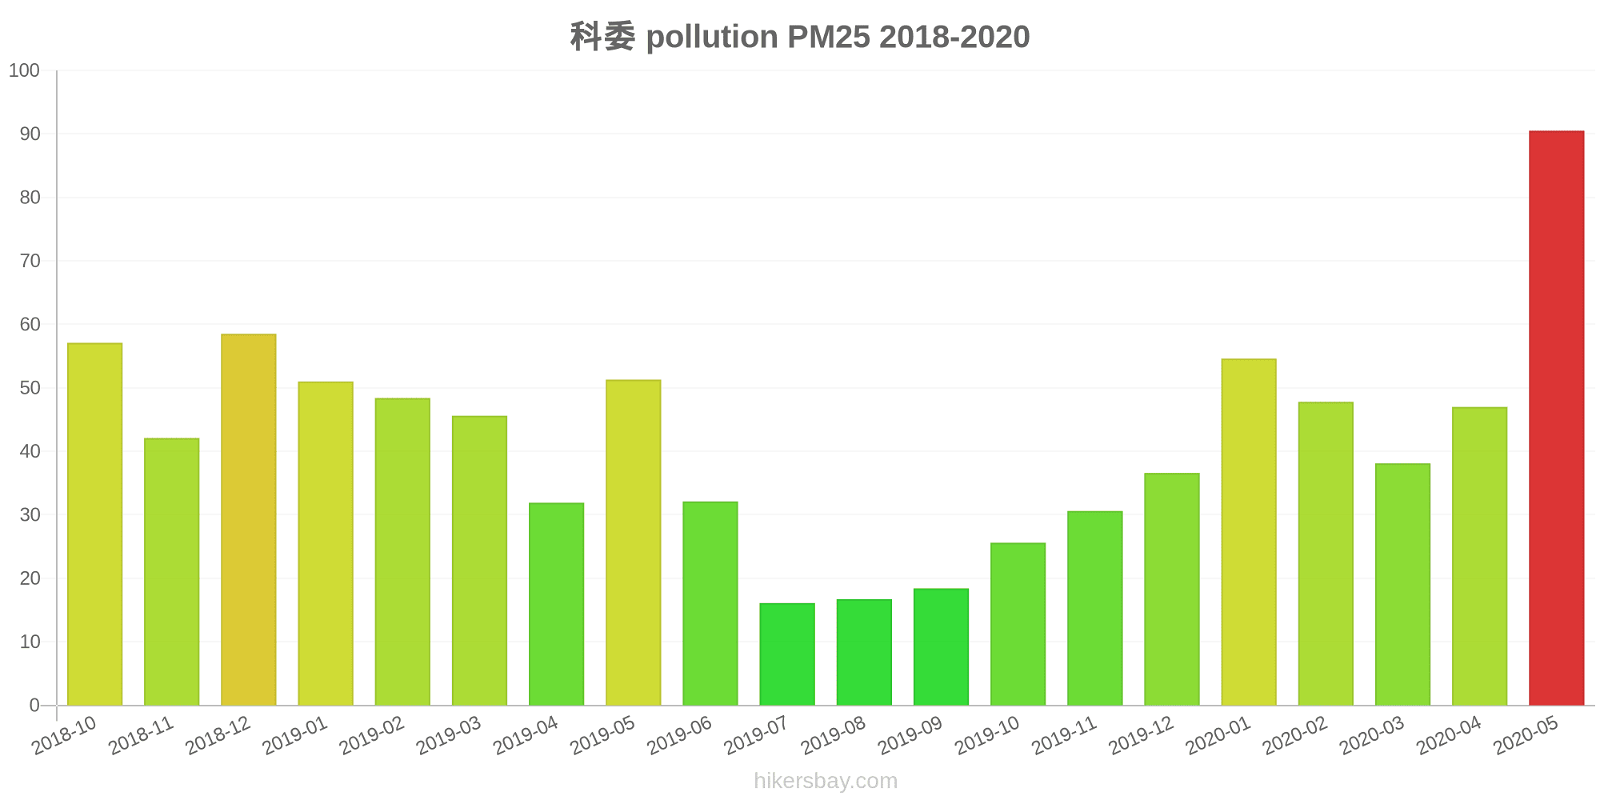
index
2020-05
2020-04
2020-03
2020-02
2020-01
2019-12
2019-11
2019-10
2019-09
2019-08
2019-07
2019-06
2019-05
2019-04
2019-03
2019-02
2019-01
2018-12
2018-11
2018-10
pm25
91
47
38
48
55
37
31
26
18
17
16
32
51
32
46
48
51
59
42
57
co
424
436
424
496
761
595
497
299
334
249
318
219
253
315
453
518
621
661
628
627
no2
19
23
25
17
28
36
35
24
17
13
12
12
11
18
22
15
26
29
27
30
o3
123
121
117
102
88
76
91
98
128
145
142
142
135
125
119
102
88
71
85
103
pm10
203
120
87
95
65
53
63
65
54
39
36
66
132
80
103
106
77
136
110
143
so2
8.9
11
8.9
11
12
14
14
8.4
6.9
7.3
7.8
13
11
11
12
12
16
13
15
18
* Pollution data source:
https://openaq.org
(ChinaAQIData)
The data is licensed under CC-By 4.0
PM2,5 61 (Unhealthy)
NO2 22 (Good)
PM10 69 (Unhealthy for Sensitive Groups)
CO 219 (Good)
O3 0 (Good)
SO2 8 (Good)
Data on air pollution from recent days in Zhangye Shi
| index | 2022-05-27 |
|---|---|
| pm25 | 28 Moderate |
| no2 | 22 Good |
| pm10 | 35 Moderate |
| co | 579 Good |
| o3 | 22 Good |
| so2 | 5 Good |

| index | 2020-05 | 2020-04 | 2020-03 | 2020-02 | 2020-01 | 2019-12 | 2019-11 | 2019-10 | 2019-09 | 2019-08 | 2019-07 | 2019-06 | 2019-05 | 2019-04 | 2019-03 | 2019-02 | 2019-01 | 2018-12 | 2018-11 | 2018-10 |
|---|---|---|---|---|---|---|---|---|---|---|---|---|---|---|---|---|---|---|---|---|
| pm25 | 91 (Very Unhealthy) | 47 (Unhealthy for Sensitive Groups) | 38 (Unhealthy for Sensitive Groups) | 48 (Unhealthy for Sensitive Groups) | 55 (Unhealthy for Sensitive Groups) | 37 (Unhealthy for Sensitive Groups) | 31 (Moderate) | 26 (Moderate) | 18 (Moderate) | 17 (Moderate) | 16 (Moderate) | 32 (Moderate) | 51 (Unhealthy for Sensitive Groups) | 32 (Moderate) | 46 (Unhealthy for Sensitive Groups) | 48 (Unhealthy for Sensitive Groups) | 51 (Unhealthy for Sensitive Groups) | 59 (Unhealthy) | 42 (Unhealthy for Sensitive Groups) | 57 (Unhealthy) |
| co | 424 (Good) | 436 (Good) | 424 (Good) | 496 (Good) | 761 (Good) | 595 (Good) | 497 (Good) | 299 (Good) | 334 (Good) | 249 (Good) | 318 (Good) | 219 (Good) | 253 (Good) | 315 (Good) | 453 (Good) | 518 (Good) | 621 (Good) | 661 (Good) | 628 (Good) | 627 (Good) |
| no2 | 19 (Good) | 23 (Good) | 25 (Good) | 17 (Good) | 28 (Good) | 36 (Good) | 35 (Good) | 24 (Good) | 17 (Good) | 13 (Good) | 12 (Good) | 12 (Good) | 11 (Good) | 18 (Good) | 22 (Good) | 15 (Good) | 26 (Good) | 29 (Good) | 27 (Good) | 30 (Good) |
| o3 | 123 (Unhealthy for Sensitive Groups) | 121 (Unhealthy for Sensitive Groups) | 117 (Moderate) | 102 (Moderate) | 88 (Moderate) | 76 (Moderate) | 91 (Moderate) | 98 (Moderate) | 128 (Unhealthy for Sensitive Groups) | 145 (Unhealthy for Sensitive Groups) | 142 (Unhealthy for Sensitive Groups) | 142 (Unhealthy for Sensitive Groups) | 135 (Unhealthy for Sensitive Groups) | 125 (Unhealthy for Sensitive Groups) | 119 (Moderate) | 102 (Moderate) | 88 (Moderate) | 71 (Moderate) | 85 (Moderate) | 103 (Moderate) |
| pm10 | 203 (Very bad Hazardous) | 120 (Very Unhealthy) | 87 (Unhealthy) | 95 (Unhealthy) | 65 (Unhealthy for Sensitive Groups) | 53 (Unhealthy for Sensitive Groups) | 63 (Unhealthy for Sensitive Groups) | 65 (Unhealthy for Sensitive Groups) | 54 (Unhealthy for Sensitive Groups) | 39 (Moderate) | 36 (Moderate) | 66 (Unhealthy for Sensitive Groups) | 132 (Very Unhealthy) | 80 (Unhealthy) | 103 (Unhealthy) | 106 (Unhealthy) | 77 (Unhealthy for Sensitive Groups) | 136 (Very Unhealthy) | 110 (Very Unhealthy) | 143 (Very Unhealthy) |
| so2 | 8.9 (Good) | 11 (Good) | 8.9 (Good) | 11 (Good) | 12 (Good) | 14 (Good) | 14 (Good) | 8.4 (Good) | 6.9 (Good) | 7.3 (Good) | 7.8 (Good) | 13 (Good) | 11 (Good) | 11 (Good) | 12 (Good) | 12 (Good) | 16 (Good) | 13 (Good) | 15 (Good) | 18 (Good) |
PM2,5 61 (Unhealthy)
particulate matter (PM2.5) dustNO2 22 (Good)
nitrogen dioxide (NO2)PM10 69 (Unhealthy for Sensitive Groups)
particulate matter (PM10) suspended dustCO 219 (Good)
carbon monoxide (CO)O3 0.05 (Good)
ozone (O3)SO2 7.7 (Good)
sulfur dioxide (SO2)科委
| index | 2022-05-27 |
|---|---|
| pm25 | 28 |
| no2 | 22 |
| pm10 | 35 |
| co | 579 |
| o3 | 22 |
| so2 | 4.6 |
科委

| index | 2020-05 | 2020-04 | 2020-03 | 2020-02 | 2020-01 | 2019-12 | 2019-11 | 2019-10 | 2019-09 | 2019-08 | 2019-07 | 2019-06 | 2019-05 | 2019-04 | 2019-03 | 2019-02 | 2019-01 | 2018-12 | 2018-11 | 2018-10 |
|---|---|---|---|---|---|---|---|---|---|---|---|---|---|---|---|---|---|---|---|---|
| pm25 | 91 | 47 | 38 | 48 | 55 | 37 | 31 | 26 | 18 | 17 | 16 | 32 | 51 | 32 | 46 | 48 | 51 | 59 | 42 | 57 |
| co | 424 | 436 | 424 | 496 | 761 | 595 | 497 | 299 | 334 | 249 | 318 | 219 | 253 | 315 | 453 | 518 | 621 | 661 | 628 | 627 |
| no2 | 19 | 23 | 25 | 17 | 28 | 36 | 35 | 24 | 17 | 13 | 12 | 12 | 11 | 18 | 22 | 15 | 26 | 29 | 27 | 30 |
| o3 | 123 | 121 | 117 | 102 | 88 | 76 | 91 | 98 | 128 | 145 | 142 | 142 | 135 | 125 | 119 | 102 | 88 | 71 | 85 | 103 |
| pm10 | 203 | 120 | 87 | 95 | 65 | 53 | 63 | 65 | 54 | 39 | 36 | 66 | 132 | 80 | 103 | 106 | 77 | 136 | 110 | 143 |
| so2 | 8.9 | 11 | 8.9 | 11 | 12 | 14 | 14 | 8.4 | 6.9 | 7.3 | 7.8 | 13 | 11 | 11 | 12 | 12 | 16 | 13 | 15 | 18 |