Air Pollution in Zhenru: Real-time Air Quality Index and smog alert.
Pollution and air quality forecast for Zhenru. Today is Wednesday, June 10, 2026. The following air pollution values have been recorded for Zhenru:- particulate matter (PM2.5) dust - 22 (Moderate)
- carbon monoxide (CO) - 219 (Good)
- ozone (O3) - 0 (Good)
- nitrogen dioxide (NO2) - 7 (Good)
- particulate matter (PM10) suspended dust - 36 (Moderate)
- sulfur dioxide (SO2) - 8 (Good)

What is the air quality in Zhenru today? Is the air polluted in Zhenru?. Is there smog?
What is the current level of PM2.5 in Zhenru? (particulate matter (PM2.5) dust)
Today's PM2.5 level is:
22 (Moderate)
For comparison, the highest level of PM2.5 in Zhenru in the last 7 days was: 23 (Friday, May 27, 2022) and the lowest: 23 (Friday, May 27, 2022).
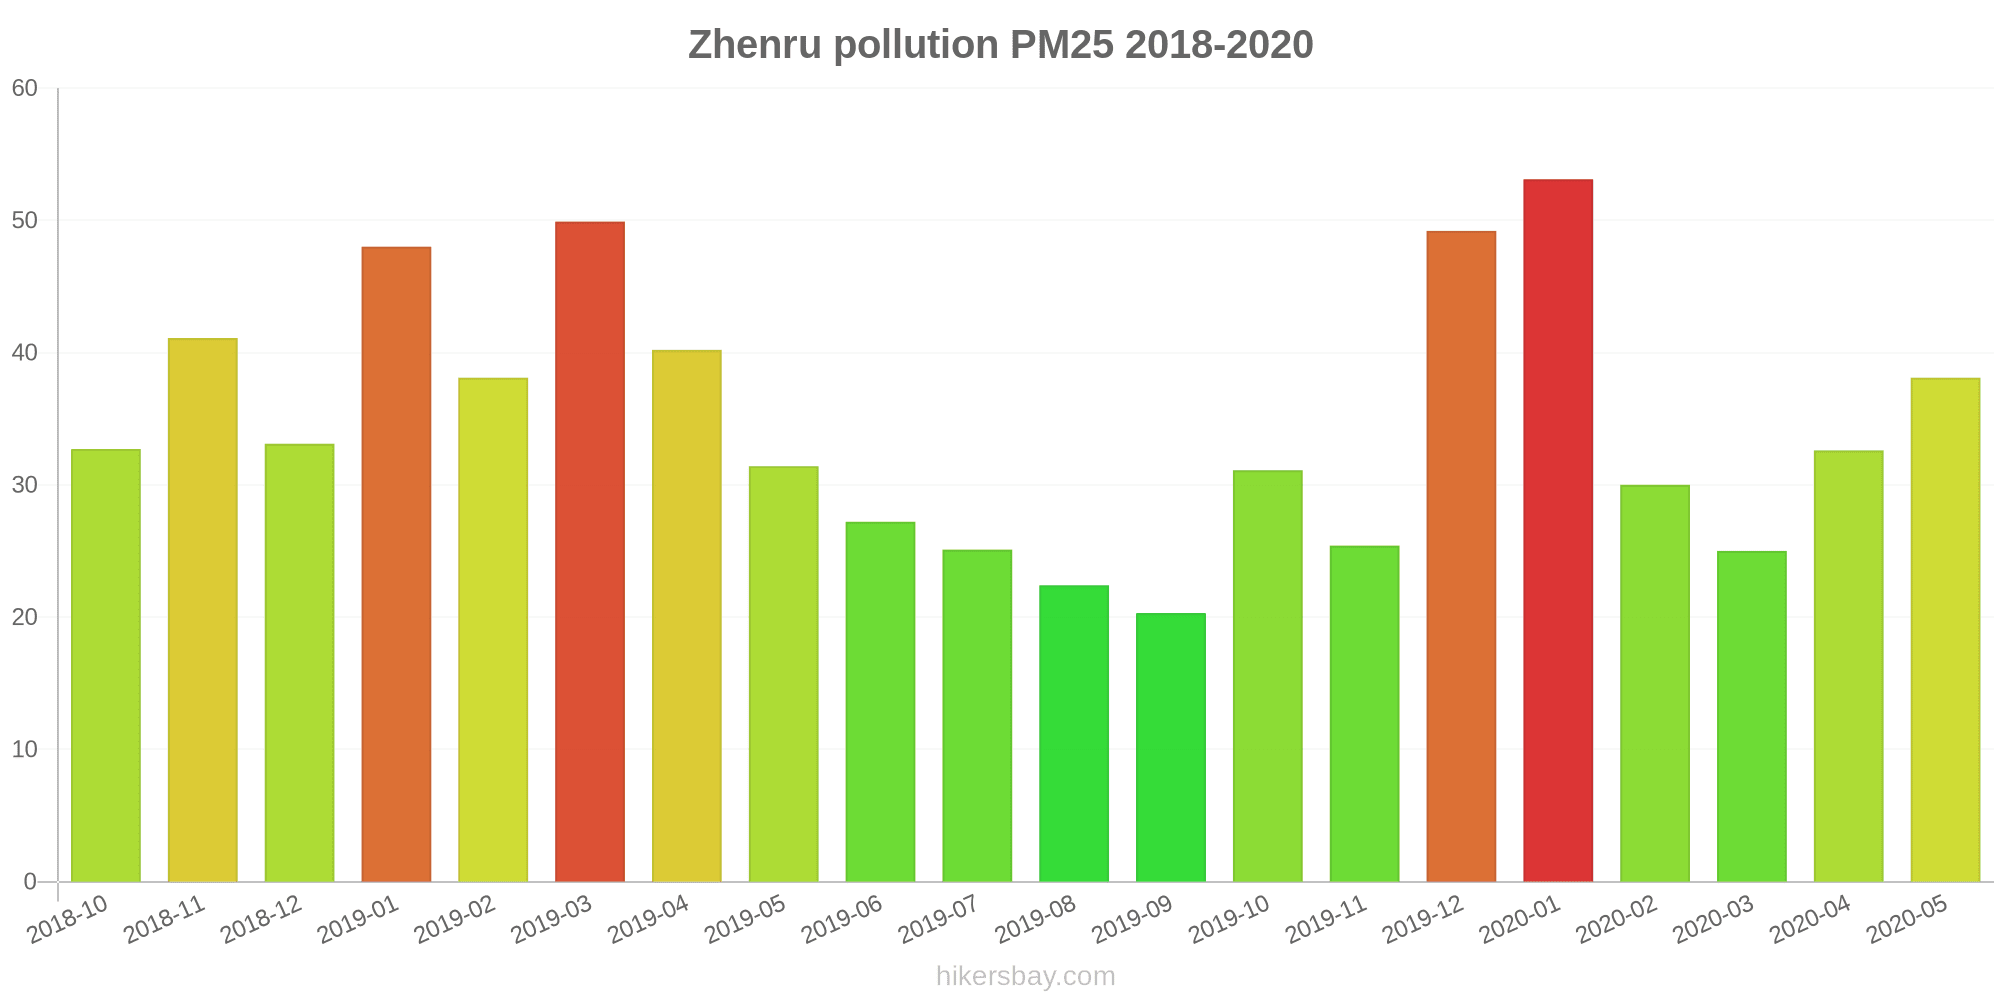
The highest PM2.5 values were recorded: 53 (January 2020).
The lowest level of particulate matter PM2.5 pollution occurs in month: September (20).
How high is the CO level? (carbon monoxide (CO))
219 (Good)
How is the O3 level today in Zhenru? (ozone (O3))
0 (Good)
How high is the level of NO2? (nitrogen dioxide (NO2))
7 (Good)
What is the level of PM10 today in Zhenru? (particulate matter (PM10) suspended dust)
The current level of particulate matter PM10 in Zhenru is:
36 (Moderate)
The highest PM10 values usually occur in month: 70 (March 2019).
The lowest value of particulate matter PM10 pollution in Zhenru is usually recorded in: September (35).
What is the level of SO2 pollution? (sulfur dioxide (SO2))
8 (Good)
Current data Friday, May 27, 2022, 3:00 PM
PM2,5 22 (Moderate)
CO 219 (Good)
O3 0 (Good)
NO2 7 (Good)
PM10 36 (Moderate)
SO2 8 (Good)
Data on air pollution from recent days in Zhenru
index
2022-05-27
pm25
23
Moderate
co
475
Good
o3
25
Good
no2
21
Good
pm10
32
Moderate
so2
4
Good
data source »
Air pollution in Zhenru from October 2018 to May 2020

index
2020-05
2020-04
2020-03
2020-02
2020-01
2019-12
2019-11
2019-10
2019-09
2019-08
2019-07
2019-06
2019-05
2019-04
2019-03
2019-02
2019-01
2018-12
2018-11
2018-10
pm25
38 (Unhealthy for Sensitive Groups)
33 (Moderate)
25 (Moderate)
30 (Moderate)
53 (Unhealthy for Sensitive Groups)
49 (Unhealthy for Sensitive Groups)
25 (Moderate)
31 (Moderate)
20 (Moderate)
22 (Moderate)
25 (Moderate)
27 (Moderate)
31 (Moderate)
40 (Unhealthy for Sensitive Groups)
50 (Unhealthy for Sensitive Groups)
38 (Unhealthy for Sensitive Groups)
48 (Unhealthy for Sensitive Groups)
33 (Moderate)
41 (Unhealthy for Sensitive Groups)
33 (Moderate)
co
817 (Good)
595 (Good)
531 (Good)
651 (Good)
882 (Good)
785 (Good)
661 (Good)
701 (Good)
578 (Good)
583 (Good)
570 (Good)
623 (Good)
672 (Good)
806 (Good)
874 (Good)
743 (Good)
647 (Good)
654 (Good)
689 (Good)
535 (Good)
no2
37 (Good)
43 (Moderate)
36 (Good)
32 (Good)
47 (Moderate)
65 (Moderate)
47 (Moderate)
46 (Moderate)
37 (Good)
28 (Good)
32 (Good)
24 (Good)
34 (Good)
42 (Moderate)
53 (Moderate)
41 (Moderate)
57 (Moderate)
53 (Moderate)
52 (Moderate)
45 (Moderate)
o3
151 (Unhealthy)
143 (Unhealthy for Sensitive Groups)
112 (Moderate)
100 (Moderate)
77 (Moderate)
75 (Moderate)
101 (Moderate)
114 (Moderate)
129 (Unhealthy for Sensitive Groups)
131 (Unhealthy for Sensitive Groups)
136 (Unhealthy for Sensitive Groups)
147 (Unhealthy for Sensitive Groups)
155 (Unhealthy)
122 (Unhealthy for Sensitive Groups)
114 (Moderate)
81 (Moderate)
70 (Good)
66 (Good)
99 (Moderate)
125 (Unhealthy for Sensitive Groups)
pm10
50 (Moderate)
60 (Unhealthy for Sensitive Groups)
43 (Moderate)
38 (Moderate)
51 (Unhealthy for Sensitive Groups)
56 (Unhealthy for Sensitive Groups)
59 (Unhealthy for Sensitive Groups)
59 (Unhealthy for Sensitive Groups)
35 (Moderate)
36 (Moderate)
36 (Moderate)
36 (Moderate)
59 (Unhealthy for Sensitive Groups)
57 (Unhealthy for Sensitive Groups)
70 (Unhealthy for Sensitive Groups)
54 (Unhealthy for Sensitive Groups)
67 (Unhealthy for Sensitive Groups)
58 (Unhealthy for Sensitive Groups)
56 (Unhealthy for Sensitive Groups)
59 (Unhealthy for Sensitive Groups)
so2
4.5 (Good)
6.1 (Good)
5.1 (Good)
5.8 (Good)
7.8 (Good)
11 (Good)
9.1 (Good)
8 (Good)
9.3 (Good)
7.4 (Good)
5.8 (Good)
5.2 (Good)
5.3 (Good)
4.8 (Good)
7.2 (Good)
5.8 (Good)
8.3 (Good)
8.4 (Good)
6.3 (Good)
6.8 (Good)
data source »
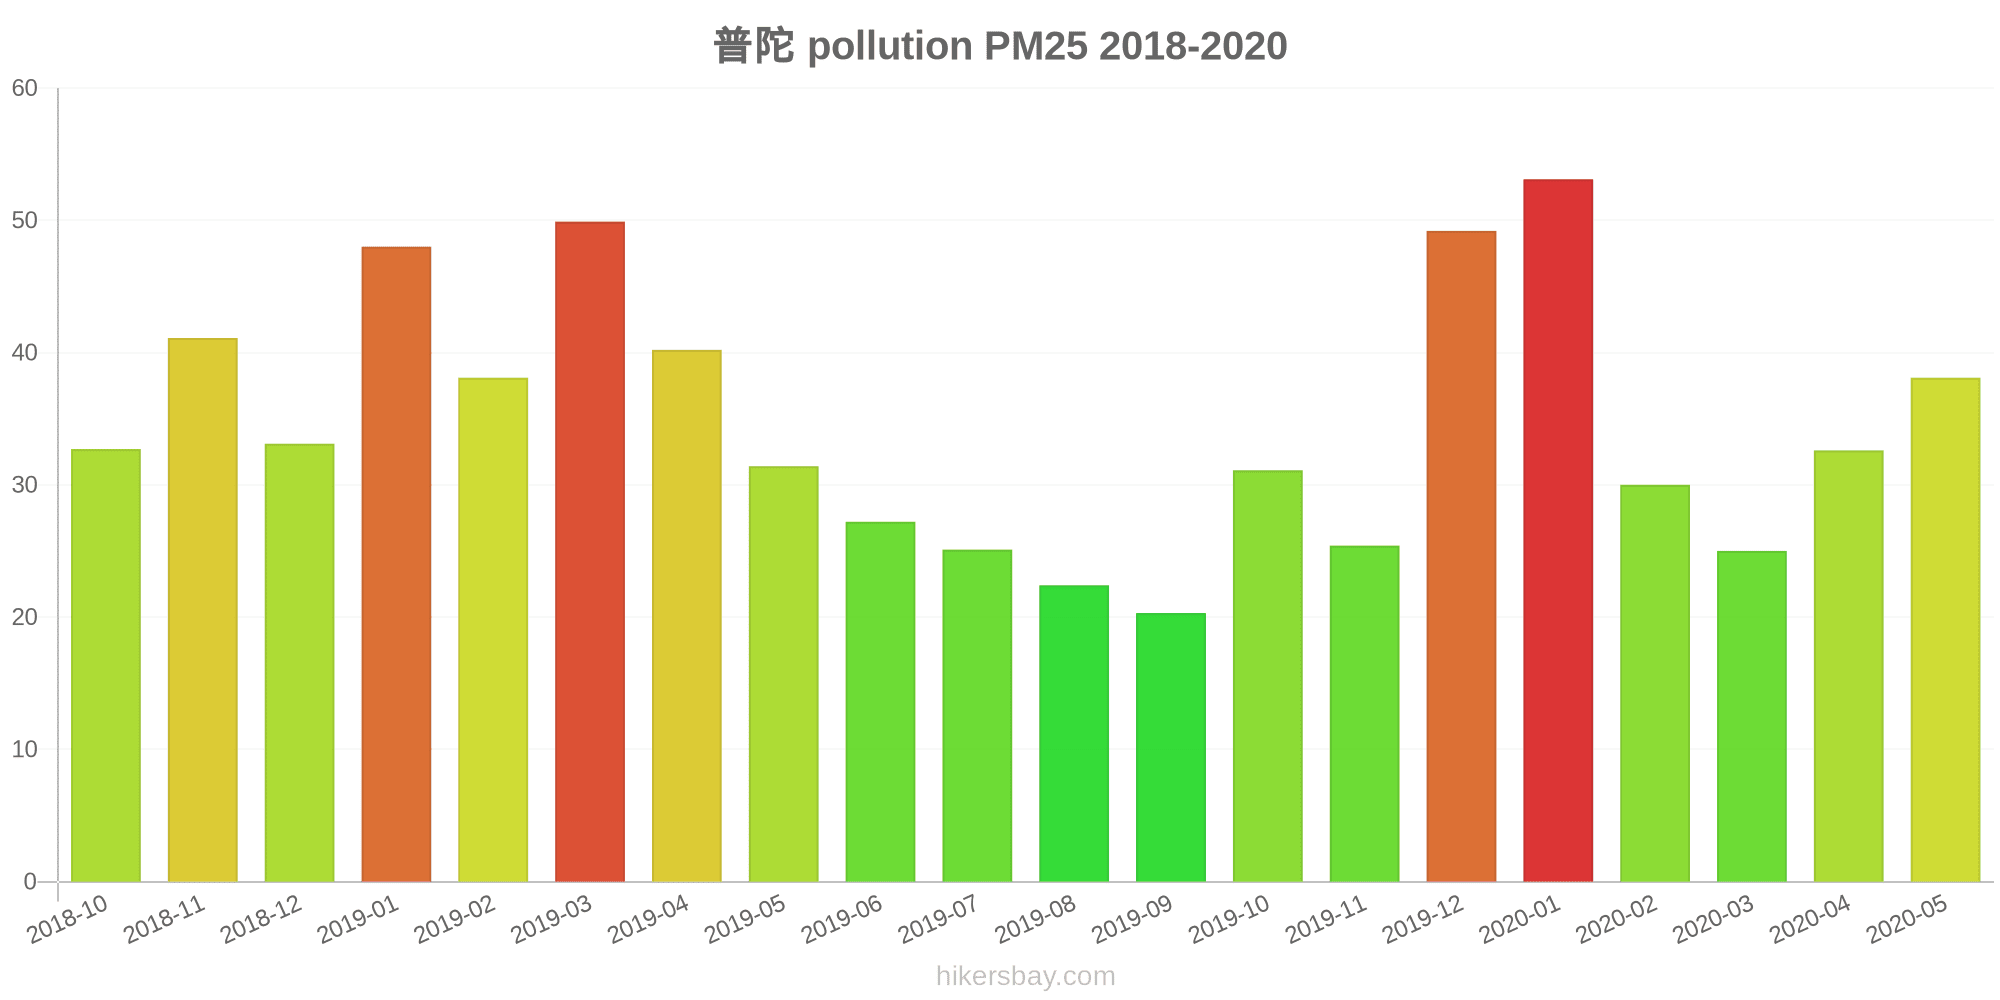
普陀
Friday, May 27, 2022, 3:00 PM
PM2,5 22 (Moderate)
particulate matter (PM2.5) dust
CO 219 (Good)
carbon monoxide (CO)
O3 0.05 (Good)
ozone (O3)
NO2 7 (Good)
nitrogen dioxide (NO2)
PM10 36 (Moderate)
particulate matter (PM10) suspended dust
SO2 7.7 (Good)
sulfur dioxide (SO2)
普陀
index
2022-05-27
pm25
23
co
475
o3
25
no2
21
pm10
32
so2
4.4
普陀
2018-10 2020-05

index
2020-05
2020-04
2020-03
2020-02
2020-01
2019-12
2019-11
2019-10
2019-09
2019-08
2019-07
2019-06
2019-05
2019-04
2019-03
2019-02
2019-01
2018-12
2018-11
2018-10
pm25
38
33
25
30
53
49
25
31
20
22
25
27
31
40
50
38
48
33
41
33
co
817
595
531
651
882
785
661
701
578
583
570
623
672
806
874
743
647
654
689
535
no2
37
43
36
32
47
65
47
46
37
28
32
24
34
42
53
41
57
53
52
45
o3
151
143
112
100
77
75
101
114
129
131
136
147
155
122
114
81
70
66
99
125
pm10
50
60
43
38
51
56
59
59
35
36
36
36
59
57
70
54
67
58
56
59
so2
4.5
6.1
5.1
5.8
7.8
11
9.1
8
9.3
7.4
5.8
5.2
5.3
4.8
7.2
5.8
8.3
8.4
6.3
6.8
* Pollution data source:
https://openaq.org
(ChinaAQIData)
The data is licensed under CC-By 4.0
PM2,5 22 (Moderate)
CO 219 (Good)
O3 0 (Good)
NO2 7 (Good)
PM10 36 (Moderate)
SO2 8 (Good)
Data on air pollution from recent days in Zhenru
| index | 2022-05-27 |
|---|---|
| pm25 | 23 Moderate |
| co | 475 Good |
| o3 | 25 Good |
| no2 | 21 Good |
| pm10 | 32 Moderate |
| so2 | 4 Good |
| index | 2020-05 | 2020-04 | 2020-03 | 2020-02 | 2020-01 | 2019-12 | 2019-11 | 2019-10 | 2019-09 | 2019-08 | 2019-07 | 2019-06 | 2019-05 | 2019-04 | 2019-03 | 2019-02 | 2019-01 | 2018-12 | 2018-11 | 2018-10 |
|---|---|---|---|---|---|---|---|---|---|---|---|---|---|---|---|---|---|---|---|---|
| pm25 | 38 (Unhealthy for Sensitive Groups) | 33 (Moderate) | 25 (Moderate) | 30 (Moderate) | 53 (Unhealthy for Sensitive Groups) | 49 (Unhealthy for Sensitive Groups) | 25 (Moderate) | 31 (Moderate) | 20 (Moderate) | 22 (Moderate) | 25 (Moderate) | 27 (Moderate) | 31 (Moderate) | 40 (Unhealthy for Sensitive Groups) | 50 (Unhealthy for Sensitive Groups) | 38 (Unhealthy for Sensitive Groups) | 48 (Unhealthy for Sensitive Groups) | 33 (Moderate) | 41 (Unhealthy for Sensitive Groups) | 33 (Moderate) |
| co | 817 (Good) | 595 (Good) | 531 (Good) | 651 (Good) | 882 (Good) | 785 (Good) | 661 (Good) | 701 (Good) | 578 (Good) | 583 (Good) | 570 (Good) | 623 (Good) | 672 (Good) | 806 (Good) | 874 (Good) | 743 (Good) | 647 (Good) | 654 (Good) | 689 (Good) | 535 (Good) |
| no2 | 37 (Good) | 43 (Moderate) | 36 (Good) | 32 (Good) | 47 (Moderate) | 65 (Moderate) | 47 (Moderate) | 46 (Moderate) | 37 (Good) | 28 (Good) | 32 (Good) | 24 (Good) | 34 (Good) | 42 (Moderate) | 53 (Moderate) | 41 (Moderate) | 57 (Moderate) | 53 (Moderate) | 52 (Moderate) | 45 (Moderate) |
| o3 | 151 (Unhealthy) | 143 (Unhealthy for Sensitive Groups) | 112 (Moderate) | 100 (Moderate) | 77 (Moderate) | 75 (Moderate) | 101 (Moderate) | 114 (Moderate) | 129 (Unhealthy for Sensitive Groups) | 131 (Unhealthy for Sensitive Groups) | 136 (Unhealthy for Sensitive Groups) | 147 (Unhealthy for Sensitive Groups) | 155 (Unhealthy) | 122 (Unhealthy for Sensitive Groups) | 114 (Moderate) | 81 (Moderate) | 70 (Good) | 66 (Good) | 99 (Moderate) | 125 (Unhealthy for Sensitive Groups) |
| pm10 | 50 (Moderate) | 60 (Unhealthy for Sensitive Groups) | 43 (Moderate) | 38 (Moderate) | 51 (Unhealthy for Sensitive Groups) | 56 (Unhealthy for Sensitive Groups) | 59 (Unhealthy for Sensitive Groups) | 59 (Unhealthy for Sensitive Groups) | 35 (Moderate) | 36 (Moderate) | 36 (Moderate) | 36 (Moderate) | 59 (Unhealthy for Sensitive Groups) | 57 (Unhealthy for Sensitive Groups) | 70 (Unhealthy for Sensitive Groups) | 54 (Unhealthy for Sensitive Groups) | 67 (Unhealthy for Sensitive Groups) | 58 (Unhealthy for Sensitive Groups) | 56 (Unhealthy for Sensitive Groups) | 59 (Unhealthy for Sensitive Groups) |
| so2 | 4.5 (Good) | 6.1 (Good) | 5.1 (Good) | 5.8 (Good) | 7.8 (Good) | 11 (Good) | 9.1 (Good) | 8 (Good) | 9.3 (Good) | 7.4 (Good) | 5.8 (Good) | 5.2 (Good) | 5.3 (Good) | 4.8 (Good) | 7.2 (Good) | 5.8 (Good) | 8.3 (Good) | 8.4 (Good) | 6.3 (Good) | 6.8 (Good) |
PM2,5 22 (Moderate)
particulate matter (PM2.5) dustCO 219 (Good)
carbon monoxide (CO)O3 0.05 (Good)
ozone (O3)NO2 7 (Good)
nitrogen dioxide (NO2)PM10 36 (Moderate)
particulate matter (PM10) suspended dustSO2 7.7 (Good)
sulfur dioxide (SO2)普陀
| index | 2022-05-27 |
|---|---|
| pm25 | 23 |
| co | 475 |
| o3 | 25 |
| no2 | 21 |
| pm10 | 32 |
| so2 | 4.4 |
普陀
| index | 2020-05 | 2020-04 | 2020-03 | 2020-02 | 2020-01 | 2019-12 | 2019-11 | 2019-10 | 2019-09 | 2019-08 | 2019-07 | 2019-06 | 2019-05 | 2019-04 | 2019-03 | 2019-02 | 2019-01 | 2018-12 | 2018-11 | 2018-10 |
|---|---|---|---|---|---|---|---|---|---|---|---|---|---|---|---|---|---|---|---|---|
| pm25 | 38 | 33 | 25 | 30 | 53 | 49 | 25 | 31 | 20 | 22 | 25 | 27 | 31 | 40 | 50 | 38 | 48 | 33 | 41 | 33 |
| co | 817 | 595 | 531 | 651 | 882 | 785 | 661 | 701 | 578 | 583 | 570 | 623 | 672 | 806 | 874 | 743 | 647 | 654 | 689 | 535 |
| no2 | 37 | 43 | 36 | 32 | 47 | 65 | 47 | 46 | 37 | 28 | 32 | 24 | 34 | 42 | 53 | 41 | 57 | 53 | 52 | 45 |
| o3 | 151 | 143 | 112 | 100 | 77 | 75 | 101 | 114 | 129 | 131 | 136 | 147 | 155 | 122 | 114 | 81 | 70 | 66 | 99 | 125 |
| pm10 | 50 | 60 | 43 | 38 | 51 | 56 | 59 | 59 | 35 | 36 | 36 | 36 | 59 | 57 | 70 | 54 | 67 | 58 | 56 | 59 |
| so2 | 4.5 | 6.1 | 5.1 | 5.8 | 7.8 | 11 | 9.1 | 8 | 9.3 | 7.4 | 5.8 | 5.2 | 5.3 | 4.8 | 7.2 | 5.8 | 8.3 | 8.4 | 6.3 | 6.8 |