Air Pollution in Zhoukou: Real-time Air Quality Index and smog alert.
Pollution and air quality forecast for Zhoukou. Today is Tuesday, June 2, 2026. The following air pollution values have been recorded for Zhoukou:- particulate matter (PM2.5) dust - 22 (Moderate)
- carbon monoxide (CO) - 219 (Good)
- ozone (O3) - 0 (Good)
- nitrogen dioxide (NO2) - 7 (Good)
- particulate matter (PM10) suspended dust - 36 (Moderate)
- sulfur dioxide (SO2) - 8 (Good)

What is the air quality in Zhoukou today? Is the air polluted in Zhoukou?. Is there smog?
What is the current level of PM2.5 in Zhoukou? (particulate matter (PM2.5) dust)
Today's PM2.5 level is:
22 (Moderate)
For comparison, the highest level of PM2.5 in Zhoukou in the last 7 days was: 23 (Friday, May 27, 2022) and the lowest: 23 (Friday, May 27, 2022).
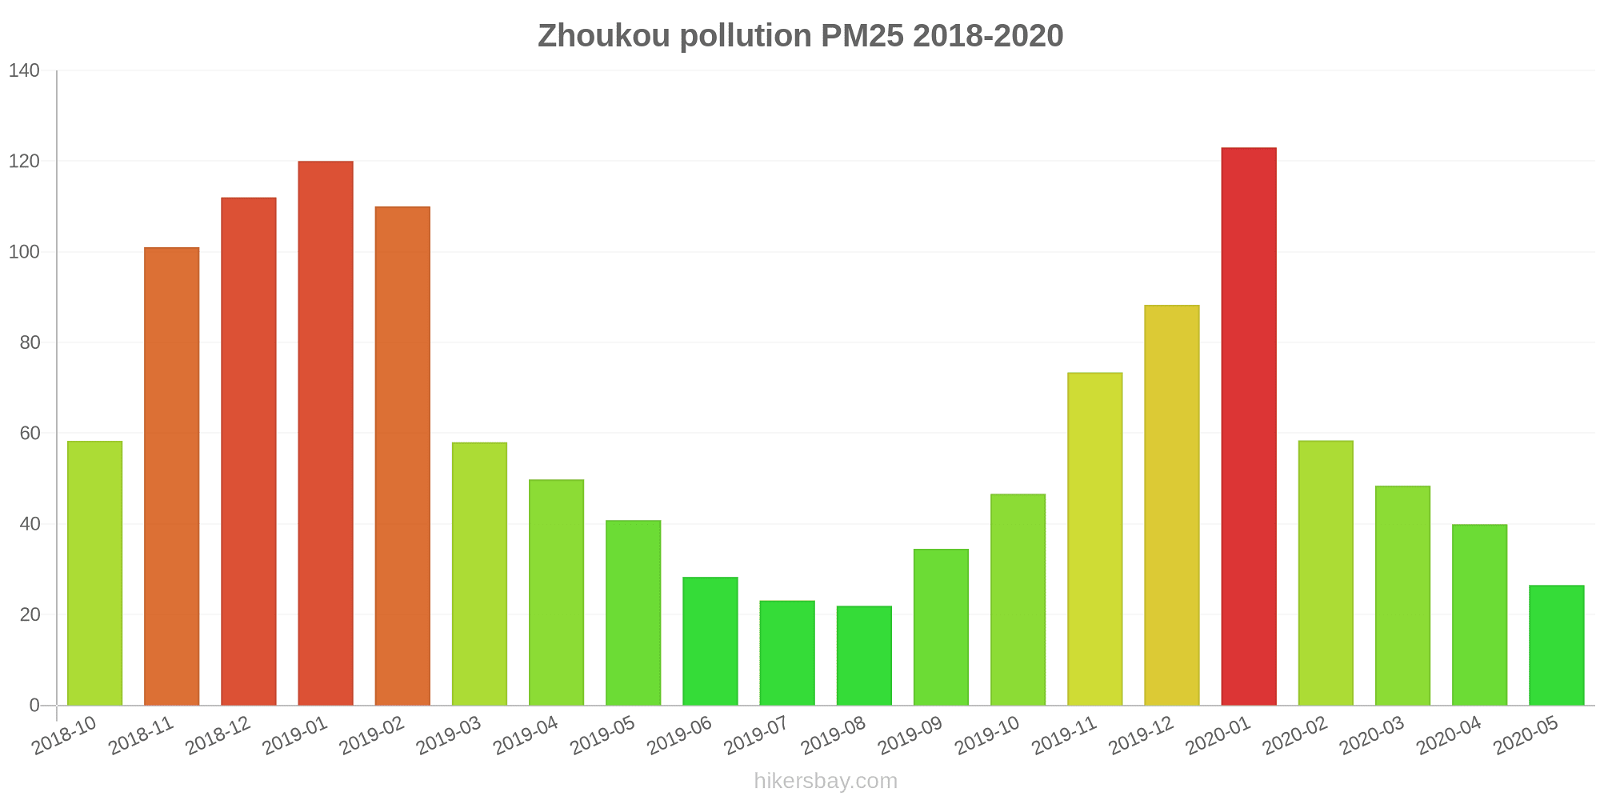
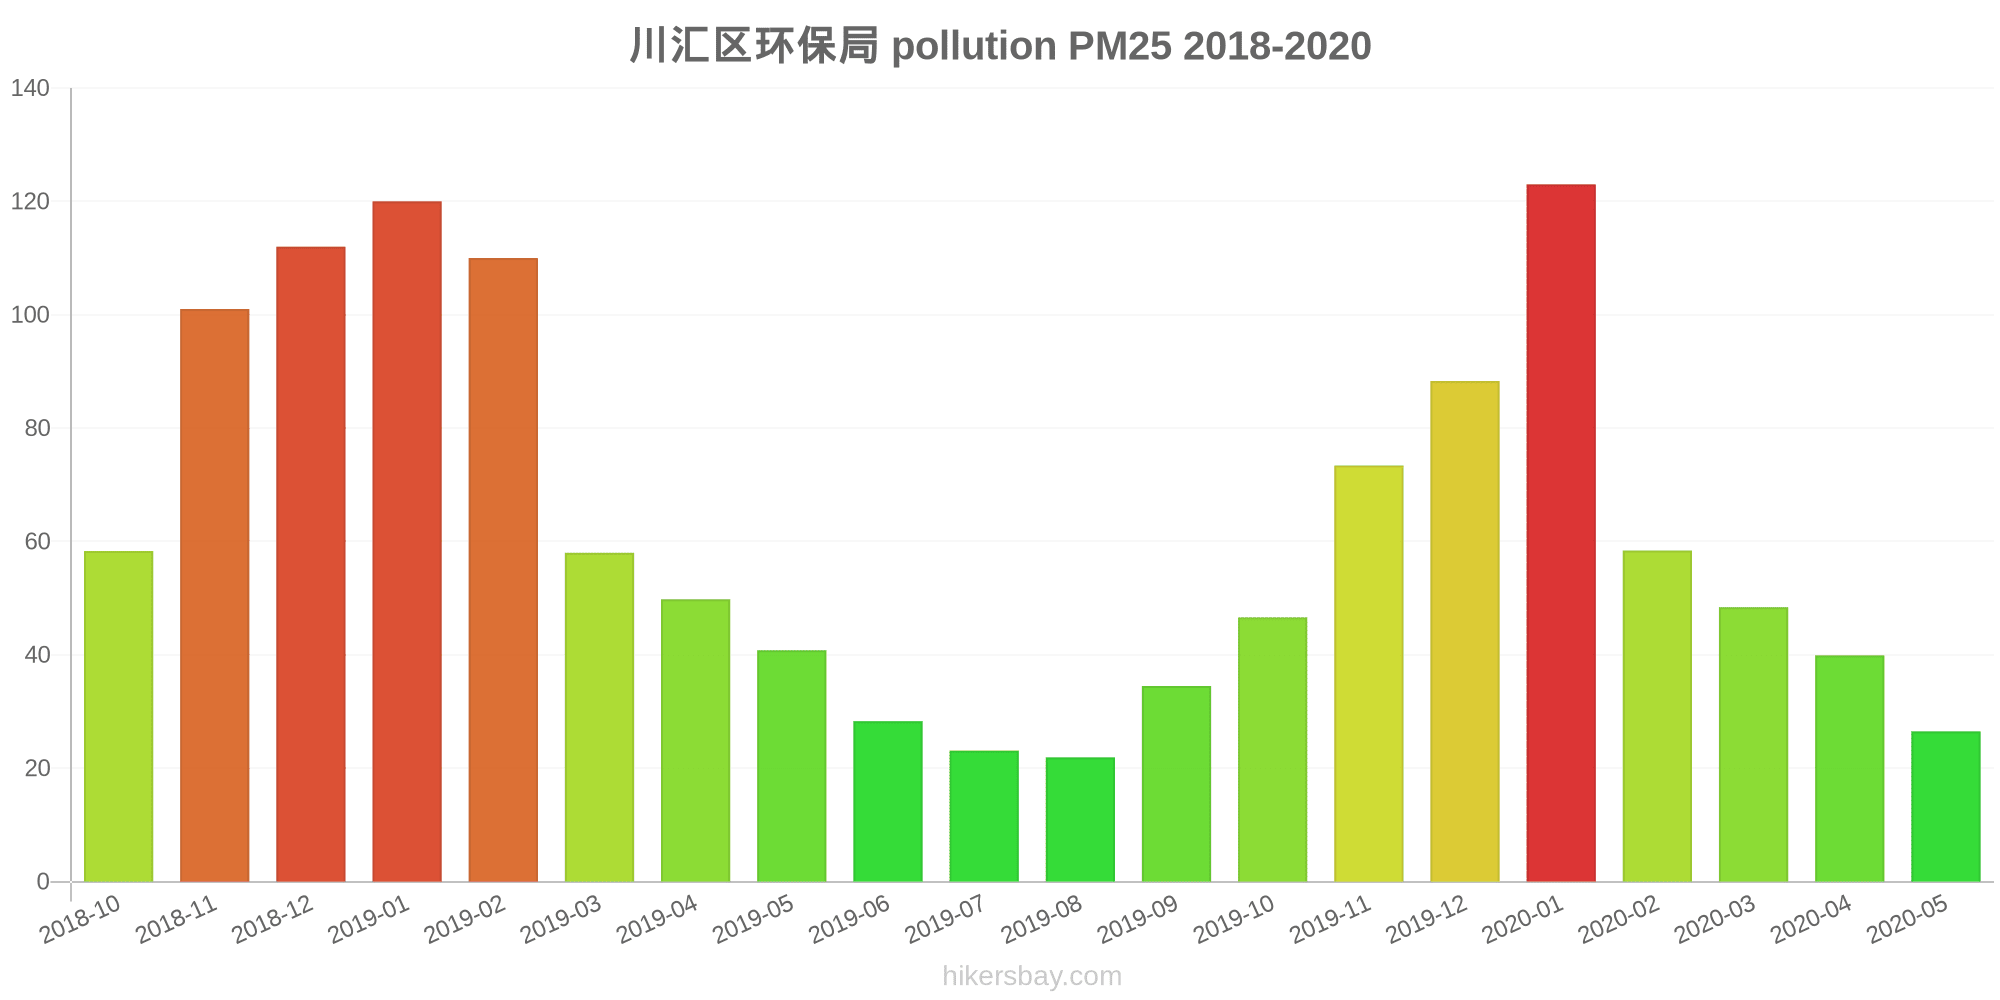
The highest PM2.5 values were recorded: 123 (January 2020).
The lowest level of particulate matter PM2.5 pollution occurs in month: August (22).
How high is the CO level? (carbon monoxide (CO))
219 (Good)
How is the O3 level today in Zhoukou? (ozone (O3))
0 (Good)
How high is the level of NO2? (nitrogen dioxide (NO2))
7 (Good)
What is the level of PM10 today in Zhoukou? (particulate matter (PM10) suspended dust)
The current level of particulate matter PM10 in Zhoukou is:
36 (Moderate)
The highest PM10 values usually occur in month: 173 (December 2018).
The lowest value of particulate matter PM10 pollution in Zhoukou is usually recorded in: August (46).
What is the level of SO2 pollution? (sulfur dioxide (SO2))
8 (Good)
Current data Friday, May 27, 2022, 3:00 PM
PM2,5 22 (Moderate)
CO 219 (Good)
O3 0 (Good)
NO2 7 (Good)
PM10 36 (Moderate)
SO2 8 (Good)
Data on air pollution from recent days in Zhoukou
index
2022-05-27
pm25
23
Moderate
co
475
Good
o3
25
Good
no2
21
Good
pm10
32
Moderate
so2
4
Good
data source »
Air pollution in Zhoukou from October 2018 to May 2020
index
2020-05
2020-04
2020-03
2020-02
2020-01
2019-12
2019-11
2019-10
2019-09
2019-08
2019-07
2019-06
2019-05
2019-04
2019-03
2019-02
2019-01
2018-12
2018-11
2018-10
pm25
27 (Moderate)
40 (Unhealthy for Sensitive Groups)
48 (Unhealthy for Sensitive Groups)
58 (Unhealthy)
123 (Very bad Hazardous)
88 (Very Unhealthy)
73 (Unhealthy)
47 (Unhealthy for Sensitive Groups)
35 (Moderate)
22 (Moderate)
23 (Moderate)
28 (Moderate)
41 (Unhealthy for Sensitive Groups)
50 (Unhealthy for Sensitive Groups)
58 (Unhealthy)
110 (Very bad Hazardous)
120 (Very bad Hazardous)
112 (Very bad Hazardous)
101 (Very Unhealthy)
58 (Unhealthy)
co
622 (Good)
693 (Good)
678 (Good)
769 (Good)
1 (Good)
884 (Good)
834 (Good)
747 (Good)
747 (Good)
659 (Good)
689 (Good)
734 (Good)
663 (Good)
821 (Good)
816 (Good)
1 (Good)
1 (Good)
1 (Good)
1 (Good)
912 (Good)
no2
17 (Good)
24 (Good)
25 (Good)
15 (Good)
30 (Good)
38 (Good)
36 (Good)
29 (Good)
22 (Good)
15 (Good)
13 (Good)
14 (Good)
21 (Good)
19 (Good)
30 (Good)
26 (Good)
44 (Moderate)
43 (Moderate)
36 (Good)
42 (Moderate)
o3
145 (Unhealthy for Sensitive Groups)
141 (Unhealthy for Sensitive Groups)
110 (Moderate)
93 (Moderate)
78 (Moderate)
66 (Good)
109 (Moderate)
133 (Unhealthy for Sensitive Groups)
171 (Unhealthy)
150 (Unhealthy)
168 (Unhealthy)
190 (Very Unhealthy)
156 (Unhealthy)
141 (Unhealthy for Sensitive Groups)
125 (Unhealthy for Sensitive Groups)
94 (Moderate)
71 (Moderate)
50 (Good)
96 (Moderate)
123 (Unhealthy for Sensitive Groups)
pm10
67 (Unhealthy for Sensitive Groups)
77 (Unhealthy for Sensitive Groups)
85 (Unhealthy)
73 (Unhealthy for Sensitive Groups)
136 (Very Unhealthy)
115 (Very Unhealthy)
123 (Very Unhealthy)
91 (Unhealthy)
72 (Unhealthy for Sensitive Groups)
46 (Moderate)
46 (Moderate)
59 (Unhealthy for Sensitive Groups)
96 (Unhealthy)
89 (Unhealthy)
104 (Unhealthy)
148 (Very Unhealthy)
165 (Very bad Hazardous)
173 (Very bad Hazardous)
149 (Very Unhealthy)
105 (Unhealthy)
so2
8.6 (Good)
8.9 (Good)
8.1 (Good)
6.3 (Good)
9.3 (Good)
8.5 (Good)
11 (Good)
8 (Good)
8.7 (Good)
5.8 (Good)
5.8 (Good)
7.5 (Good)
9.4 (Good)
9.3 (Good)
11 (Good)
9.4 (Good)
12 (Good)
13 (Good)
13 (Good)
17 (Good)
data source »
川汇区环保局
Friday, May 27, 2022, 3:00 PM
PM2,5 22 (Moderate)
particulate matter (PM2.5) dust
CO 219 (Good)
carbon monoxide (CO)
O3 0.05 (Good)
ozone (O3)
NO2 7 (Good)
nitrogen dioxide (NO2)
PM10 36 (Moderate)
particulate matter (PM10) suspended dust
SO2 7.7 (Good)
sulfur dioxide (SO2)
川汇区环保局
index
2022-05-27
pm25
23
co
475
o3
25
no2
21
pm10
32
so2
4.4
川汇区环保局
2018-10 2020-05

index
2020-05
2020-04
2020-03
2020-02
2020-01
2019-12
2019-11
2019-10
2019-09
2019-08
2019-07
2019-06
2019-05
2019-04
2019-03
2019-02
2019-01
2018-12
2018-11
2018-10
pm25
27
40
48
58
123
88
73
47
35
22
23
28
41
50
58
110
120
112
101
58
co
622
693
678
769
1
884
834
747
747
659
689
734
663
821
816
1
1
1
1
912
no2
17
24
25
15
30
38
36
29
22
15
13
14
21
19
30
26
44
43
36
42
o3
145
141
110
93
78
66
109
133
171
150
168
190
156
141
125
94
71
50
96
123
pm10
67
77
85
73
136
115
123
91
72
46
46
59
96
89
104
148
165
173
149
105
so2
8.6
8.9
8.1
6.3
9.3
8.5
11
8
8.7
5.8
5.8
7.5
9.4
9.3
11
9.4
12
13
13
17
* Pollution data source:
https://openaq.org
(ChinaAQIData)
The data is licensed under CC-By 4.0
PM2,5 22 (Moderate)
CO 219 (Good)
O3 0 (Good)
NO2 7 (Good)
PM10 36 (Moderate)
SO2 8 (Good)
Data on air pollution from recent days in Zhoukou
| index | 2022-05-27 |
|---|---|
| pm25 | 23 Moderate |
| co | 475 Good |
| o3 | 25 Good |
| no2 | 21 Good |
| pm10 | 32 Moderate |
| so2 | 4 Good |

| index | 2020-05 | 2020-04 | 2020-03 | 2020-02 | 2020-01 | 2019-12 | 2019-11 | 2019-10 | 2019-09 | 2019-08 | 2019-07 | 2019-06 | 2019-05 | 2019-04 | 2019-03 | 2019-02 | 2019-01 | 2018-12 | 2018-11 | 2018-10 |
|---|---|---|---|---|---|---|---|---|---|---|---|---|---|---|---|---|---|---|---|---|
| pm25 | 27 (Moderate) | 40 (Unhealthy for Sensitive Groups) | 48 (Unhealthy for Sensitive Groups) | 58 (Unhealthy) | 123 (Very bad Hazardous) | 88 (Very Unhealthy) | 73 (Unhealthy) | 47 (Unhealthy for Sensitive Groups) | 35 (Moderate) | 22 (Moderate) | 23 (Moderate) | 28 (Moderate) | 41 (Unhealthy for Sensitive Groups) | 50 (Unhealthy for Sensitive Groups) | 58 (Unhealthy) | 110 (Very bad Hazardous) | 120 (Very bad Hazardous) | 112 (Very bad Hazardous) | 101 (Very Unhealthy) | 58 (Unhealthy) |
| co | 622 (Good) | 693 (Good) | 678 (Good) | 769 (Good) | 1 (Good) | 884 (Good) | 834 (Good) | 747 (Good) | 747 (Good) | 659 (Good) | 689 (Good) | 734 (Good) | 663 (Good) | 821 (Good) | 816 (Good) | 1 (Good) | 1 (Good) | 1 (Good) | 1 (Good) | 912 (Good) |
| no2 | 17 (Good) | 24 (Good) | 25 (Good) | 15 (Good) | 30 (Good) | 38 (Good) | 36 (Good) | 29 (Good) | 22 (Good) | 15 (Good) | 13 (Good) | 14 (Good) | 21 (Good) | 19 (Good) | 30 (Good) | 26 (Good) | 44 (Moderate) | 43 (Moderate) | 36 (Good) | 42 (Moderate) |
| o3 | 145 (Unhealthy for Sensitive Groups) | 141 (Unhealthy for Sensitive Groups) | 110 (Moderate) | 93 (Moderate) | 78 (Moderate) | 66 (Good) | 109 (Moderate) | 133 (Unhealthy for Sensitive Groups) | 171 (Unhealthy) | 150 (Unhealthy) | 168 (Unhealthy) | 190 (Very Unhealthy) | 156 (Unhealthy) | 141 (Unhealthy for Sensitive Groups) | 125 (Unhealthy for Sensitive Groups) | 94 (Moderate) | 71 (Moderate) | 50 (Good) | 96 (Moderate) | 123 (Unhealthy for Sensitive Groups) |
| pm10 | 67 (Unhealthy for Sensitive Groups) | 77 (Unhealthy for Sensitive Groups) | 85 (Unhealthy) | 73 (Unhealthy for Sensitive Groups) | 136 (Very Unhealthy) | 115 (Very Unhealthy) | 123 (Very Unhealthy) | 91 (Unhealthy) | 72 (Unhealthy for Sensitive Groups) | 46 (Moderate) | 46 (Moderate) | 59 (Unhealthy for Sensitive Groups) | 96 (Unhealthy) | 89 (Unhealthy) | 104 (Unhealthy) | 148 (Very Unhealthy) | 165 (Very bad Hazardous) | 173 (Very bad Hazardous) | 149 (Very Unhealthy) | 105 (Unhealthy) |
| so2 | 8.6 (Good) | 8.9 (Good) | 8.1 (Good) | 6.3 (Good) | 9.3 (Good) | 8.5 (Good) | 11 (Good) | 8 (Good) | 8.7 (Good) | 5.8 (Good) | 5.8 (Good) | 7.5 (Good) | 9.4 (Good) | 9.3 (Good) | 11 (Good) | 9.4 (Good) | 12 (Good) | 13 (Good) | 13 (Good) | 17 (Good) |
PM2,5 22 (Moderate)
particulate matter (PM2.5) dustCO 219 (Good)
carbon monoxide (CO)O3 0.05 (Good)
ozone (O3)NO2 7 (Good)
nitrogen dioxide (NO2)PM10 36 (Moderate)
particulate matter (PM10) suspended dustSO2 7.7 (Good)
sulfur dioxide (SO2)川汇区环保局
| index | 2022-05-27 |
|---|---|
| pm25 | 23 |
| co | 475 |
| o3 | 25 |
| no2 | 21 |
| pm10 | 32 |
| so2 | 4.4 |
川汇区环保局
| index | 2020-05 | 2020-04 | 2020-03 | 2020-02 | 2020-01 | 2019-12 | 2019-11 | 2019-10 | 2019-09 | 2019-08 | 2019-07 | 2019-06 | 2019-05 | 2019-04 | 2019-03 | 2019-02 | 2019-01 | 2018-12 | 2018-11 | 2018-10 |
|---|---|---|---|---|---|---|---|---|---|---|---|---|---|---|---|---|---|---|---|---|
| pm25 | 27 | 40 | 48 | 58 | 123 | 88 | 73 | 47 | 35 | 22 | 23 | 28 | 41 | 50 | 58 | 110 | 120 | 112 | 101 | 58 |
| co | 622 | 693 | 678 | 769 | 1 | 884 | 834 | 747 | 747 | 659 | 689 | 734 | 663 | 821 | 816 | 1 | 1 | 1 | 1 | 912 |
| no2 | 17 | 24 | 25 | 15 | 30 | 38 | 36 | 29 | 22 | 15 | 13 | 14 | 21 | 19 | 30 | 26 | 44 | 43 | 36 | 42 |
| o3 | 145 | 141 | 110 | 93 | 78 | 66 | 109 | 133 | 171 | 150 | 168 | 190 | 156 | 141 | 125 | 94 | 71 | 50 | 96 | 123 |
| pm10 | 67 | 77 | 85 | 73 | 136 | 115 | 123 | 91 | 72 | 46 | 46 | 59 | 96 | 89 | 104 | 148 | 165 | 173 | 149 | 105 |
| so2 | 8.6 | 8.9 | 8.1 | 6.3 | 9.3 | 8.5 | 11 | 8 | 8.7 | 5.8 | 5.8 | 7.5 | 9.4 | 9.3 | 11 | 9.4 | 12 | 13 | 13 | 17 |