Air Pollution in Zhumadian: Real-time Air Quality Index and smog alert.
Pollution and air quality forecast for Zhumadian. Today is Tuesday, June 2, 2026. The following air pollution values have been recorded for Zhumadian:- particulate matter (PM2.5) dust - 22 (Moderate)
- carbon monoxide (CO) - 219 (Good)
- ozone (O3) - 0 (Good)
- nitrogen dioxide (NO2) - 7 (Good)
- particulate matter (PM10) suspended dust - 36 (Moderate)
- sulfur dioxide (SO2) - 8 (Good)

What is the air quality in Zhumadian today? Is the air polluted in Zhumadian?. Is there smog?
What is the current level of PM2.5 in Zhumadian? (particulate matter (PM2.5) dust)
Today's PM2.5 level is:
22 (Moderate)
For comparison, the highest level of PM2.5 in Zhumadian in the last 7 days was: 23 (Friday, May 27, 2022) and the lowest: 23 (Friday, May 27, 2022).
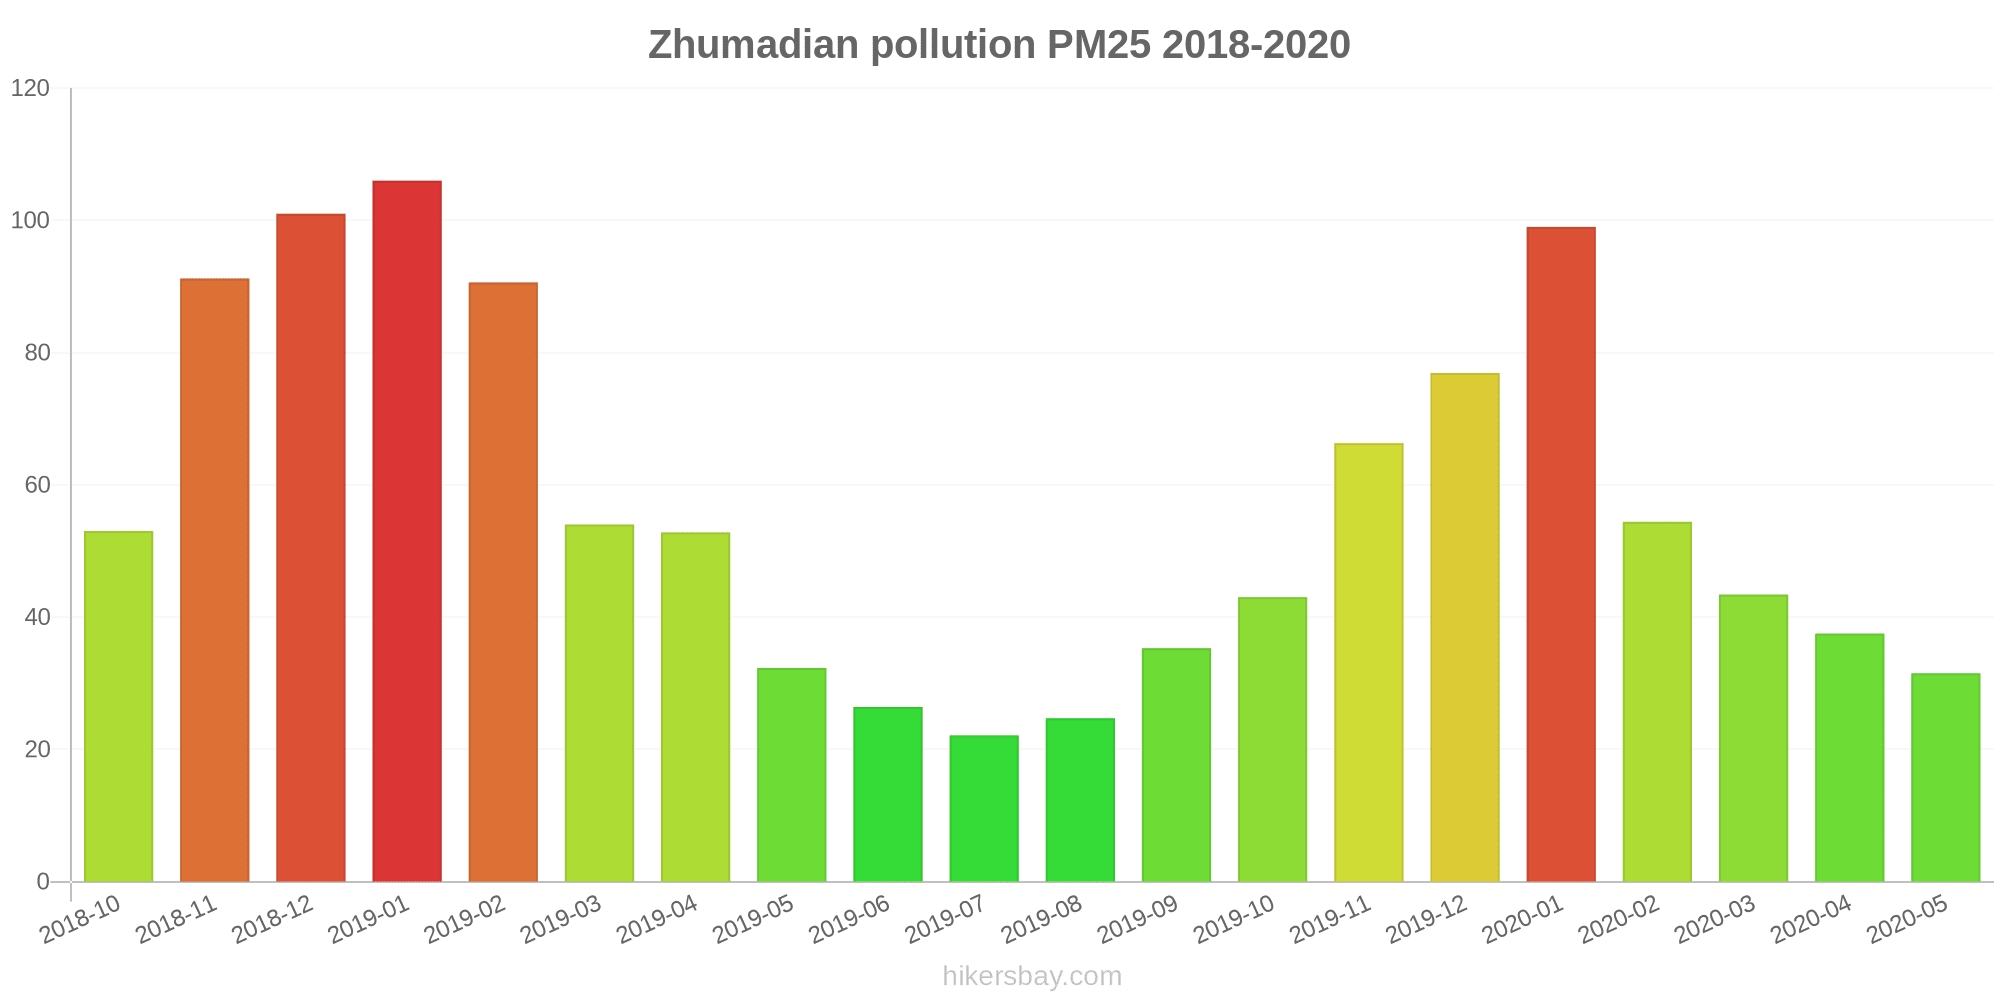
The highest PM2.5 values were recorded: 106 (January 2019).
The lowest level of particulate matter PM2.5 pollution occurs in month: July (22).
How high is the CO level? (carbon monoxide (CO))
219 (Good)
How is the O3 level today in Zhumadian? (ozone (O3))
0 (Good)
How high is the level of NO2? (nitrogen dioxide (NO2))
7 (Good)
What is the level of PM10 today in Zhumadian? (particulate matter (PM10) suspended dust)
The current level of particulate matter PM10 in Zhumadian is:
36 (Moderate)
The highest PM10 values usually occur in month: 161 (December 2018).
The lowest value of particulate matter PM10 pollution in Zhumadian is usually recorded in: August (42).
What is the level of SO2 pollution? (sulfur dioxide (SO2))
8 (Good)
Current data Friday, May 27, 2022, 3:00 PM
PM2,5 22 (Moderate)
CO 219 (Good)
O3 0 (Good)
NO2 7 (Good)
PM10 36 (Moderate)
SO2 8 (Good)
Data on air pollution from recent days in Zhumadian
index
2022-05-27
pm25
23
Moderate
co
475
Good
o3
25
Good
no2
21
Good
pm10
32
Moderate
so2
4
Good
data source »
Air pollution in Zhumadian from October 2018 to May 2020

index
2020-05
2020-04
2020-03
2020-02
2020-01
2019-12
2019-11
2019-10
2019-09
2019-08
2019-07
2019-06
2019-05
2019-04
2019-03
2019-02
2019-01
2018-12
2018-11
2018-10
pm25
32 (Moderate)
38 (Unhealthy for Sensitive Groups)
43 (Unhealthy for Sensitive Groups)
54 (Unhealthy for Sensitive Groups)
99 (Very Unhealthy)
77 (Very Unhealthy)
66 (Unhealthy)
43 (Unhealthy for Sensitive Groups)
35 (Unhealthy for Sensitive Groups)
25 (Moderate)
22 (Moderate)
26 (Moderate)
32 (Moderate)
53 (Unhealthy for Sensitive Groups)
54 (Unhealthy for Sensitive Groups)
91 (Very Unhealthy)
106 (Very Unhealthy)
101 (Very Unhealthy)
91 (Very Unhealthy)
53 (Unhealthy for Sensitive Groups)
co
551 (Good)
666 (Good)
661 (Good)
795 (Good)
1 (Good)
866 (Good)
717 (Good)
631 (Good)
698 (Good)
705 (Good)
568 (Good)
592 (Good)
437 (Good)
675 (Good)
567 (Good)
838 (Good)
1 (Good)
1 (Good)
905 (Good)
559 (Good)
no2
17 (Good)
29 (Good)
22 (Good)
15 (Good)
33 (Good)
44 (Moderate)
41 (Moderate)
33 (Good)
26 (Good)
19 (Good)
27 (Good)
24 (Good)
24 (Good)
23 (Good)
32 (Good)
23 (Good)
41 (Moderate)
42 (Moderate)
46 (Moderate)
41 (Moderate)
o3
137 (Unhealthy for Sensitive Groups)
135 (Unhealthy for Sensitive Groups)
110 (Moderate)
94 (Moderate)
76 (Moderate)
63 (Good)
98 (Moderate)
111 (Moderate)
160 (Unhealthy)
147 (Unhealthy for Sensitive Groups)
158 (Unhealthy)
181 (Very Unhealthy)
152 (Unhealthy)
132 (Unhealthy for Sensitive Groups)
122 (Unhealthy for Sensitive Groups)
90 (Moderate)
70 (Moderate)
49 (Good)
97 (Moderate)
128 (Unhealthy for Sensitive Groups)
pm10
63 (Unhealthy for Sensitive Groups)
76 (Unhealthy for Sensitive Groups)
81 (Unhealthy)
75 (Unhealthy for Sensitive Groups)
129 (Very Unhealthy)
113 (Very Unhealthy)
117 (Very Unhealthy)
82 (Unhealthy)
73 (Unhealthy for Sensitive Groups)
42 (Moderate)
51 (Unhealthy for Sensitive Groups)
64 (Unhealthy for Sensitive Groups)
84 (Unhealthy)
92 (Unhealthy)
105 (Unhealthy)
125 (Very Unhealthy)
159 (Very bad Hazardous)
161 (Very bad Hazardous)
142 (Very Unhealthy)
92 (Unhealthy)
so2
8.5 (Good)
8.3 (Good)
6.4 (Good)
3.8 (Good)
5.4 (Good)
8.5 (Good)
9.7 (Good)
6.7 (Good)
7.9 (Good)
5.9 (Good)
6.4 (Good)
7.9 (Good)
7.8 (Good)
8.1 (Good)
9.6 (Good)
5.8 (Good)
7.9 (Good)
10 (Good)
10 (Good)
17 (Good)
data source »
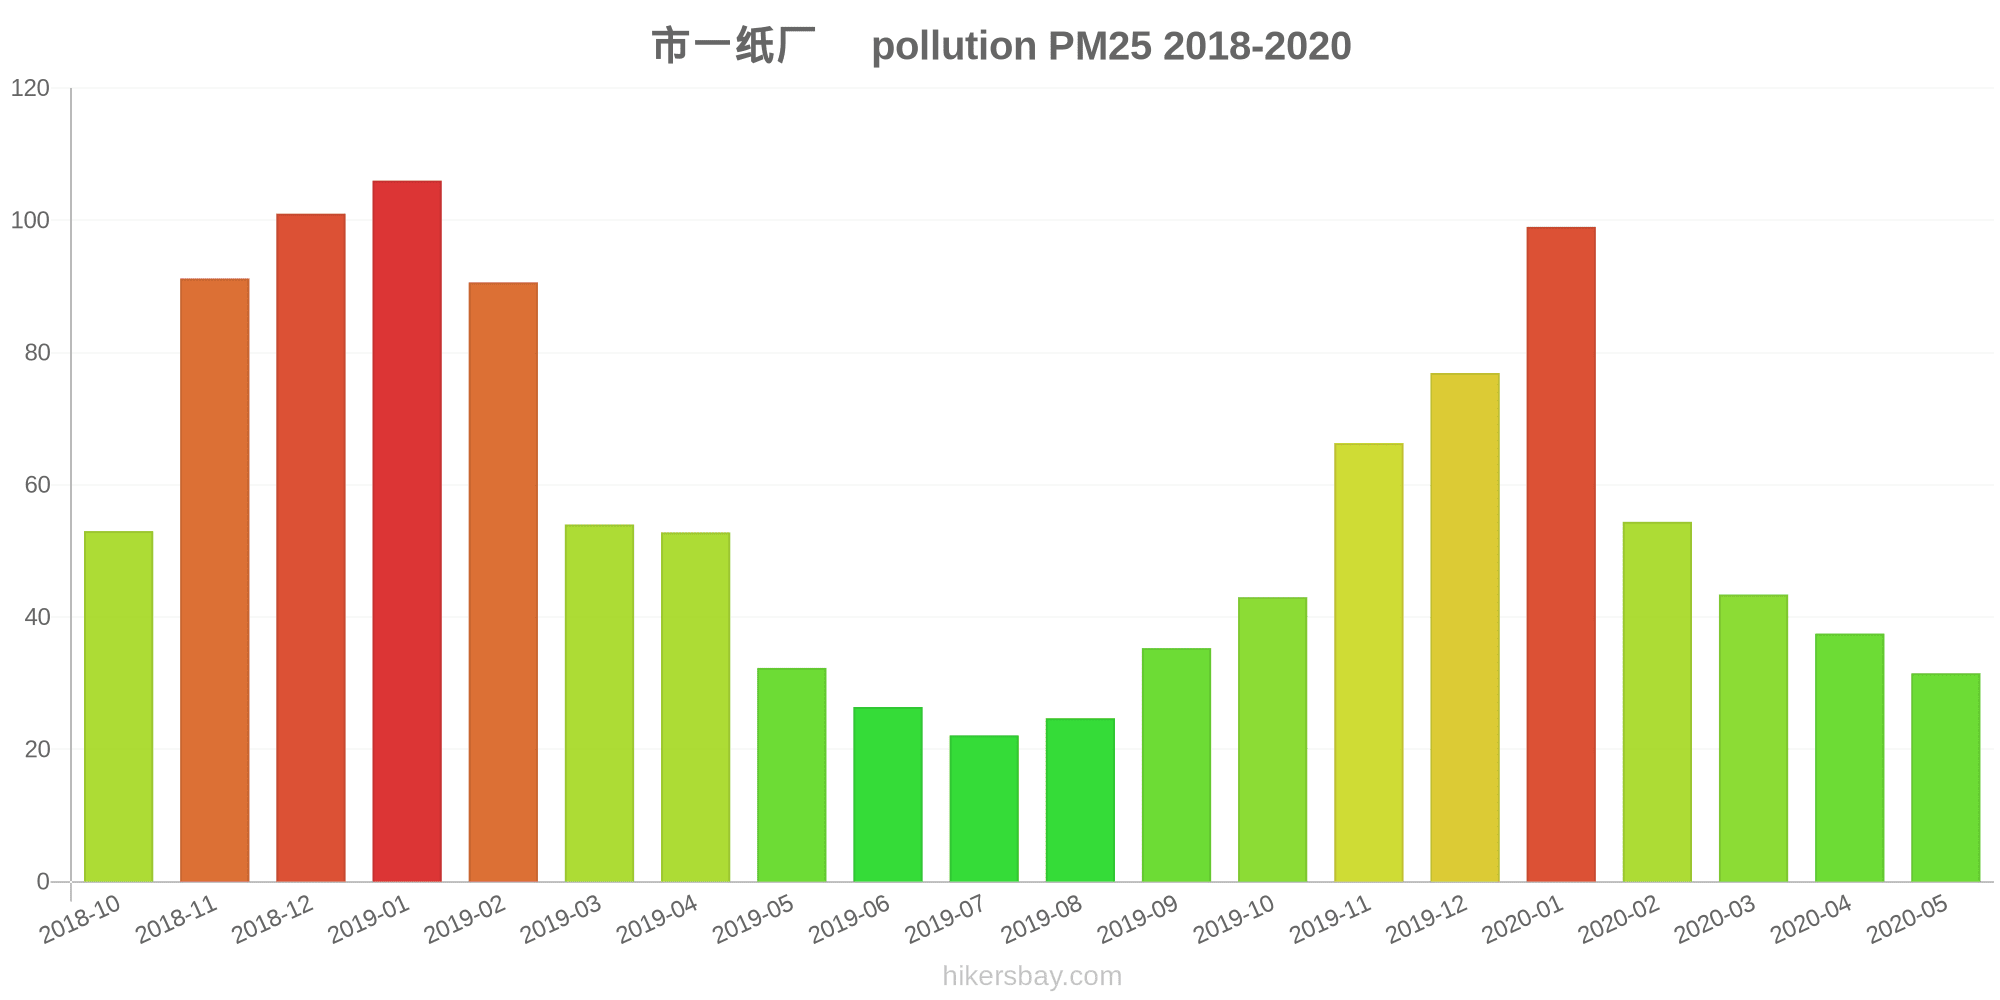
市一纸厂
Friday, May 27, 2022, 3:00 PM
PM2,5 22 (Moderate)
particulate matter (PM2.5) dust
CO 219 (Good)
carbon monoxide (CO)
O3 0.05 (Good)
ozone (O3)
NO2 7 (Good)
nitrogen dioxide (NO2)
PM10 36 (Moderate)
particulate matter (PM10) suspended dust
SO2 7.7 (Good)
sulfur dioxide (SO2)
市一纸厂
index
2022-05-27
pm25
23
co
475
o3
25
no2
21
pm10
32
so2
4.4
市一纸厂
2018-10 2020-05

index
2020-05
2020-04
2020-03
2020-02
2020-01
2019-12
2019-11
2019-10
2019-09
2019-08
2019-07
2019-06
2019-05
2019-04
2019-03
2019-02
2019-01
2018-12
2018-11
2018-10
pm25
32
38
43
54
99
77
66
43
35
25
22
26
32
53
54
91
106
101
91
53
co
551
666
661
795
1
866
717
631
698
705
568
592
437
675
567
838
1
1
905
559
no2
17
29
22
15
33
44
41
33
26
19
27
24
24
23
32
23
41
42
46
41
o3
137
135
110
94
76
63
98
111
160
147
158
181
152
132
122
90
70
49
97
128
pm10
63
76
81
75
129
113
117
82
73
42
51
64
84
92
105
125
159
161
142
92
so2
8.5
8.3
6.4
3.8
5.4
8.5
9.7
6.7
7.9
5.9
6.4
7.9
7.8
8.1
9.6
5.8
7.9
10
10
17
* Pollution data source:
https://openaq.org
(ChinaAQIData)
The data is licensed under CC-By 4.0
PM2,5 22 (Moderate)
CO 219 (Good)
O3 0 (Good)
NO2 7 (Good)
PM10 36 (Moderate)
SO2 8 (Good)
Data on air pollution from recent days in Zhumadian
| index | 2022-05-27 |
|---|---|
| pm25 | 23 Moderate |
| co | 475 Good |
| o3 | 25 Good |
| no2 | 21 Good |
| pm10 | 32 Moderate |
| so2 | 4 Good |
| index | 2020-05 | 2020-04 | 2020-03 | 2020-02 | 2020-01 | 2019-12 | 2019-11 | 2019-10 | 2019-09 | 2019-08 | 2019-07 | 2019-06 | 2019-05 | 2019-04 | 2019-03 | 2019-02 | 2019-01 | 2018-12 | 2018-11 | 2018-10 |
|---|---|---|---|---|---|---|---|---|---|---|---|---|---|---|---|---|---|---|---|---|
| pm25 | 32 (Moderate) | 38 (Unhealthy for Sensitive Groups) | 43 (Unhealthy for Sensitive Groups) | 54 (Unhealthy for Sensitive Groups) | 99 (Very Unhealthy) | 77 (Very Unhealthy) | 66 (Unhealthy) | 43 (Unhealthy for Sensitive Groups) | 35 (Unhealthy for Sensitive Groups) | 25 (Moderate) | 22 (Moderate) | 26 (Moderate) | 32 (Moderate) | 53 (Unhealthy for Sensitive Groups) | 54 (Unhealthy for Sensitive Groups) | 91 (Very Unhealthy) | 106 (Very Unhealthy) | 101 (Very Unhealthy) | 91 (Very Unhealthy) | 53 (Unhealthy for Sensitive Groups) |
| co | 551 (Good) | 666 (Good) | 661 (Good) | 795 (Good) | 1 (Good) | 866 (Good) | 717 (Good) | 631 (Good) | 698 (Good) | 705 (Good) | 568 (Good) | 592 (Good) | 437 (Good) | 675 (Good) | 567 (Good) | 838 (Good) | 1 (Good) | 1 (Good) | 905 (Good) | 559 (Good) |
| no2 | 17 (Good) | 29 (Good) | 22 (Good) | 15 (Good) | 33 (Good) | 44 (Moderate) | 41 (Moderate) | 33 (Good) | 26 (Good) | 19 (Good) | 27 (Good) | 24 (Good) | 24 (Good) | 23 (Good) | 32 (Good) | 23 (Good) | 41 (Moderate) | 42 (Moderate) | 46 (Moderate) | 41 (Moderate) |
| o3 | 137 (Unhealthy for Sensitive Groups) | 135 (Unhealthy for Sensitive Groups) | 110 (Moderate) | 94 (Moderate) | 76 (Moderate) | 63 (Good) | 98 (Moderate) | 111 (Moderate) | 160 (Unhealthy) | 147 (Unhealthy for Sensitive Groups) | 158 (Unhealthy) | 181 (Very Unhealthy) | 152 (Unhealthy) | 132 (Unhealthy for Sensitive Groups) | 122 (Unhealthy for Sensitive Groups) | 90 (Moderate) | 70 (Moderate) | 49 (Good) | 97 (Moderate) | 128 (Unhealthy for Sensitive Groups) |
| pm10 | 63 (Unhealthy for Sensitive Groups) | 76 (Unhealthy for Sensitive Groups) | 81 (Unhealthy) | 75 (Unhealthy for Sensitive Groups) | 129 (Very Unhealthy) | 113 (Very Unhealthy) | 117 (Very Unhealthy) | 82 (Unhealthy) | 73 (Unhealthy for Sensitive Groups) | 42 (Moderate) | 51 (Unhealthy for Sensitive Groups) | 64 (Unhealthy for Sensitive Groups) | 84 (Unhealthy) | 92 (Unhealthy) | 105 (Unhealthy) | 125 (Very Unhealthy) | 159 (Very bad Hazardous) | 161 (Very bad Hazardous) | 142 (Very Unhealthy) | 92 (Unhealthy) |
| so2 | 8.5 (Good) | 8.3 (Good) | 6.4 (Good) | 3.8 (Good) | 5.4 (Good) | 8.5 (Good) | 9.7 (Good) | 6.7 (Good) | 7.9 (Good) | 5.9 (Good) | 6.4 (Good) | 7.9 (Good) | 7.8 (Good) | 8.1 (Good) | 9.6 (Good) | 5.8 (Good) | 7.9 (Good) | 10 (Good) | 10 (Good) | 17 (Good) |
PM2,5 22 (Moderate)
particulate matter (PM2.5) dustCO 219 (Good)
carbon monoxide (CO)O3 0.05 (Good)
ozone (O3)NO2 7 (Good)
nitrogen dioxide (NO2)PM10 36 (Moderate)
particulate matter (PM10) suspended dustSO2 7.7 (Good)
sulfur dioxide (SO2)市一纸厂
| index | 2022-05-27 |
|---|---|
| pm25 | 23 |
| co | 475 |
| o3 | 25 |
| no2 | 21 |
| pm10 | 32 |
| so2 | 4.4 |
市一纸厂
| index | 2020-05 | 2020-04 | 2020-03 | 2020-02 | 2020-01 | 2019-12 | 2019-11 | 2019-10 | 2019-09 | 2019-08 | 2019-07 | 2019-06 | 2019-05 | 2019-04 | 2019-03 | 2019-02 | 2019-01 | 2018-12 | 2018-11 | 2018-10 |
|---|---|---|---|---|---|---|---|---|---|---|---|---|---|---|---|---|---|---|---|---|
| pm25 | 32 | 38 | 43 | 54 | 99 | 77 | 66 | 43 | 35 | 25 | 22 | 26 | 32 | 53 | 54 | 91 | 106 | 101 | 91 | 53 |
| co | 551 | 666 | 661 | 795 | 1 | 866 | 717 | 631 | 698 | 705 | 568 | 592 | 437 | 675 | 567 | 838 | 1 | 1 | 905 | 559 |
| no2 | 17 | 29 | 22 | 15 | 33 | 44 | 41 | 33 | 26 | 19 | 27 | 24 | 24 | 23 | 32 | 23 | 41 | 42 | 46 | 41 |
| o3 | 137 | 135 | 110 | 94 | 76 | 63 | 98 | 111 | 160 | 147 | 158 | 181 | 152 | 132 | 122 | 90 | 70 | 49 | 97 | 128 |
| pm10 | 63 | 76 | 81 | 75 | 129 | 113 | 117 | 82 | 73 | 42 | 51 | 64 | 84 | 92 | 105 | 125 | 159 | 161 | 142 | 92 |
| so2 | 8.5 | 8.3 | 6.4 | 3.8 | 5.4 | 8.5 | 9.7 | 6.7 | 7.9 | 5.9 | 6.4 | 7.9 | 7.8 | 8.1 | 9.6 | 5.8 | 7.9 | 10 | 10 | 17 |