Air Pollution in Zigong: Real-time Air Quality Index and smog alert.
Pollution and air quality forecast for Zigong. Today is Tuesday, June 16, 2026. The following air pollution values have been recorded for Zigong:- particulate matter (PM2.5) dust - 22 (Moderate)
- carbon monoxide (CO) - 219 (Good)
- ozone (O3) - 0 (Good)
- nitrogen dioxide (NO2) - 7 (Good)
- particulate matter (PM10) suspended dust - 36 (Moderate)
- sulfur dioxide (SO2) - 8 (Good)

What is the air quality in Zigong today? Is the air polluted in Zigong?. Is there smog?
What is the current level of PM2.5 in Zigong? (particulate matter (PM2.5) dust)
Today's PM2.5 level is:
22 (Moderate)
For comparison, the highest level of PM2.5 in Zigong in the last 7 days was: 23 (Friday, May 27, 2022) and the lowest: 23 (Friday, May 27, 2022).
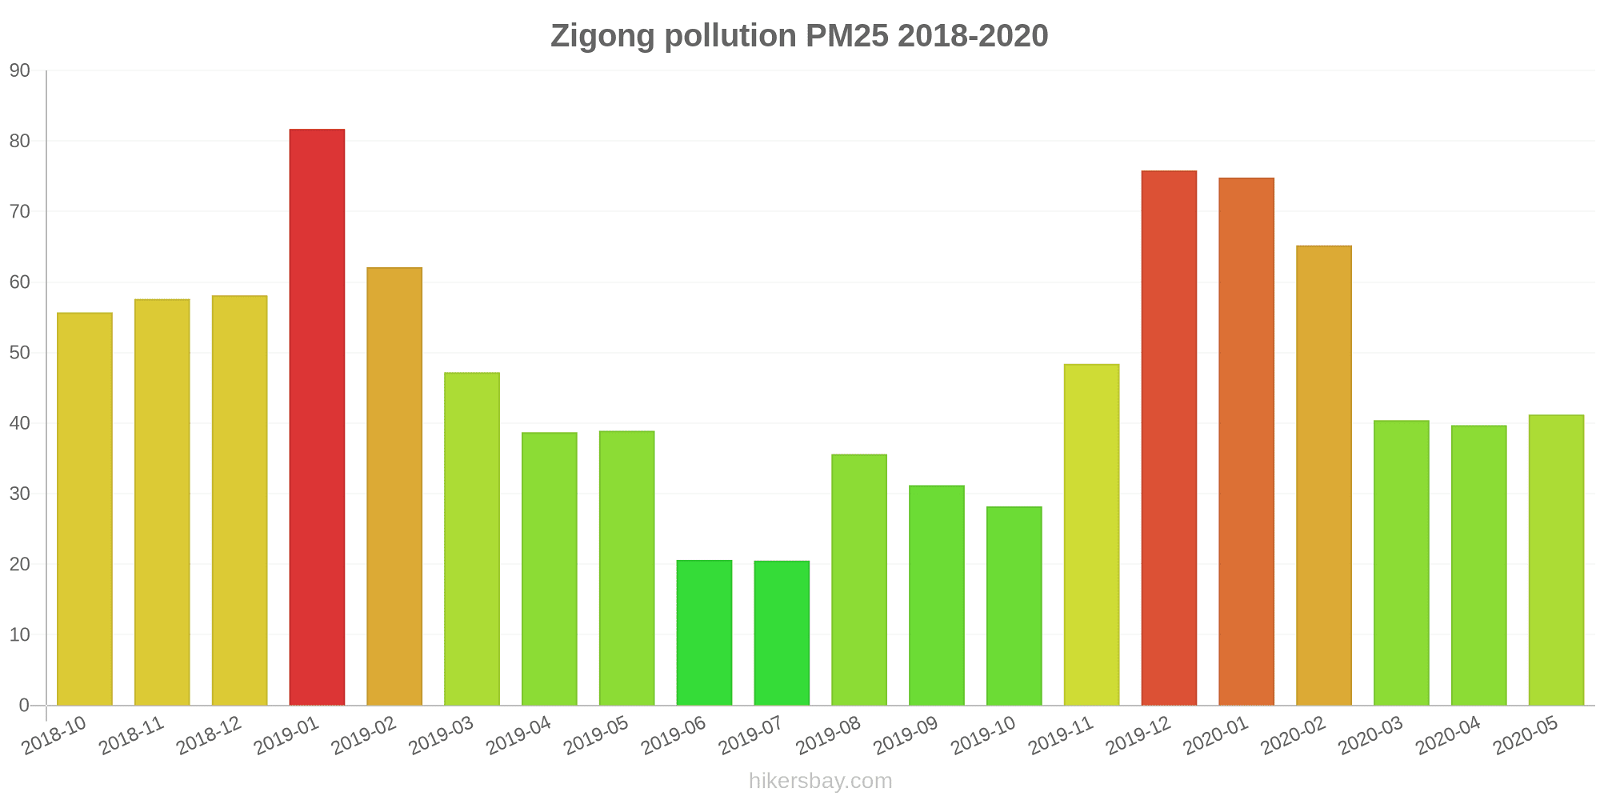
The highest PM2.5 values were recorded: 82 (January 2019).
The lowest level of particulate matter PM2.5 pollution occurs in month: July (21).
How high is the CO level? (carbon monoxide (CO))
219 (Good)
How is the O3 level today in Zigong? (ozone (O3))
0 (Good)
How high is the level of NO2? (nitrogen dioxide (NO2))
7 (Good)
What is the level of PM10 today in Zigong? (particulate matter (PM10) suspended dust)
The current level of particulate matter PM10 in Zigong is:
36 (Moderate)
The highest PM10 values usually occur in month: 106 (January 2019).
The lowest value of particulate matter PM10 pollution in Zigong is usually recorded in: July (36).
What is the level of SO2 pollution? (sulfur dioxide (SO2))
8 (Good)
Current data Friday, May 27, 2022, 3:00 PM
PM2,5 22 (Moderate)
CO 219 (Good)
O3 0 (Good)
NO2 7 (Good)
PM10 36 (Moderate)
SO2 8 (Good)
Data on air pollution from recent days in Zigong
index
2022-05-27
pm25
23
Moderate
co
475
Good
o3
25
Good
no2
21
Good
pm10
32
Moderate
so2
4
Good
data source »
Air pollution in Zigong from October 2018 to May 2020
index
2020-05
2020-04
2020-03
2020-02
2020-01
2019-12
2019-11
2019-10
2019-09
2019-08
2019-07
2019-06
2019-05
2019-04
2019-03
2019-02
2019-01
2018-12
2018-11
2018-10
pm25
41 (Unhealthy for Sensitive Groups)
40 (Unhealthy for Sensitive Groups)
40 (Unhealthy for Sensitive Groups)
65 (Unhealthy)
75 (Unhealthy)
76 (Very Unhealthy)
48 (Unhealthy for Sensitive Groups)
28 (Moderate)
31 (Moderate)
36 (Unhealthy for Sensitive Groups)
21 (Moderate)
21 (Moderate)
39 (Unhealthy for Sensitive Groups)
39 (Unhealthy for Sensitive Groups)
47 (Unhealthy for Sensitive Groups)
62 (Unhealthy)
82 (Very Unhealthy)
58 (Unhealthy)
58 (Unhealthy)
56 (Unhealthy)
co
559 (Good)
531 (Good)
566 (Good)
701 (Good)
1 (Good)
867 (Good)
615 (Good)
620 (Good)
625 (Good)
434 (Good)
488 (Good)
518 (Good)
550 (Good)
667 (Good)
722 (Good)
891 (Good)
1 (Good)
828 (Good)
778 (Good)
789 (Good)
no2
22 (Good)
26 (Good)
25 (Good)
17 (Good)
31 (Good)
39 (Good)
30 (Good)
21 (Good)
20 (Good)
19 (Good)
16 (Good)
18 (Good)
16 (Good)
18 (Good)
29 (Good)
29 (Good)
42 (Moderate)
35 (Good)
36 (Good)
29 (Good)
o3
171 (Unhealthy)
124 (Unhealthy for Sensitive Groups)
117 (Moderate)
81 (Moderate)
65 (Good)
60 (Good)
55 (Good)
86 (Moderate)
115 (Moderate)
171 (Unhealthy)
118 (Moderate)
121 (Unhealthy for Sensitive Groups)
109 (Moderate)
135 (Unhealthy for Sensitive Groups)
93 (Moderate)
64 (Good)
60 (Good)
41 (Good)
72 (Moderate)
71 (Moderate)
pm10
61 (Unhealthy for Sensitive Groups)
53 (Unhealthy for Sensitive Groups)
58 (Unhealthy for Sensitive Groups)
79 (Unhealthy for Sensitive Groups)
90 (Unhealthy)
91 (Unhealthy)
65 (Unhealthy for Sensitive Groups)
39 (Moderate)
49 (Moderate)
49 (Moderate)
36 (Moderate)
42 (Moderate)
57 (Unhealthy for Sensitive Groups)
60 (Unhealthy for Sensitive Groups)
72 (Unhealthy for Sensitive Groups)
84 (Unhealthy)
106 (Unhealthy)
84 (Unhealthy)
79 (Unhealthy for Sensitive Groups)
72 (Unhealthy for Sensitive Groups)
so2
10 (Good)
8.7 (Good)
8.7 (Good)
6.1 (Good)
8.3 (Good)
14 (Good)
9.8 (Good)
8.1 (Good)
9.4 (Good)
9.5 (Good)
6.5 (Good)
7.6 (Good)
6.1 (Good)
10 (Good)
14 (Good)
10 (Good)
13 (Good)
10 (Good)
13 (Good)
11 (Good)
data source »
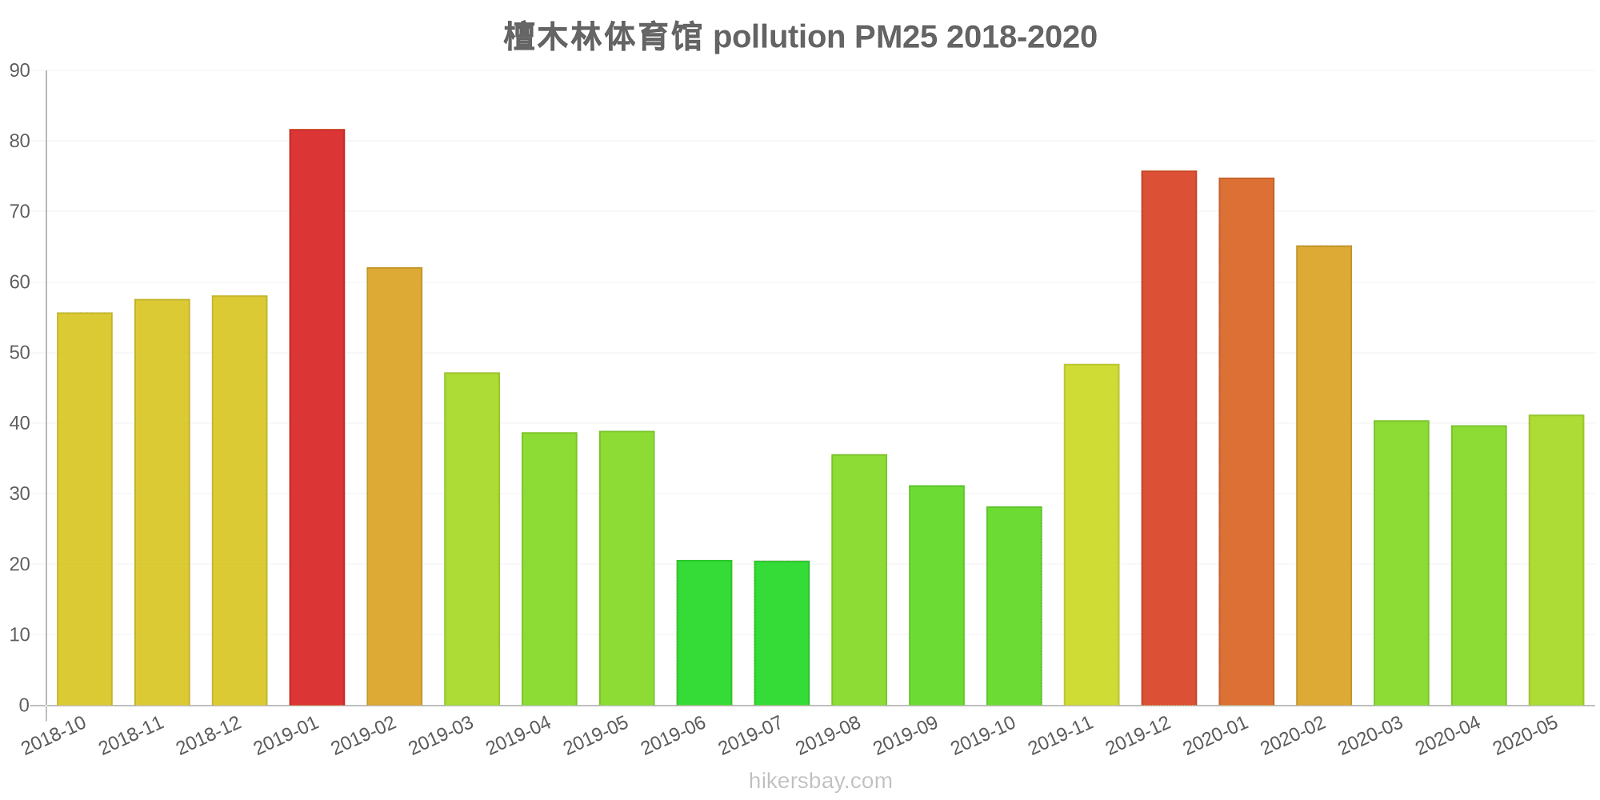
檀木林体育馆
Friday, May 27, 2022, 3:00 PM
PM2,5 22 (Moderate)
particulate matter (PM2.5) dust
CO 219 (Good)
carbon monoxide (CO)
O3 0.05 (Good)
ozone (O3)
NO2 7 (Good)
nitrogen dioxide (NO2)
PM10 36 (Moderate)
particulate matter (PM10) suspended dust
SO2 7.7 (Good)
sulfur dioxide (SO2)
檀木林体育馆
index
2022-05-27
pm25
23
co
475
o3
25
no2
21
pm10
32
so2
4.4
檀木林体育馆
2018-10 2020-05
index
2020-05
2020-04
2020-03
2020-02
2020-01
2019-12
2019-11
2019-10
2019-09
2019-08
2019-07
2019-06
2019-05
2019-04
2019-03
2019-02
2019-01
2018-12
2018-11
2018-10
pm25
41
40
40
65
75
76
48
28
31
36
21
21
39
39
47
62
82
58
58
56
co
559
531
566
701
1
867
615
620
625
434
488
518
550
667
722
891
1
828
778
789
no2
22
26
25
17
31
39
30
21
20
19
16
18
16
18
29
29
42
35
36
29
o3
171
124
117
81
65
60
55
86
115
171
118
121
109
135
93
64
60
41
72
71
pm10
61
53
58
79
90
91
65
39
49
49
36
42
57
60
72
84
106
84
79
72
so2
10
8.7
8.7
6.1
8.3
14
9.8
8.1
9.4
9.5
6.5
7.6
6.1
10
14
10
13
10
13
11
* Pollution data source:
https://openaq.org
(ChinaAQIData)
The data is licensed under CC-By 4.0
PM2,5 22 (Moderate)
CO 219 (Good)
O3 0 (Good)
NO2 7 (Good)
PM10 36 (Moderate)
SO2 8 (Good)
Data on air pollution from recent days in Zigong
| index | 2022-05-27 |
|---|---|
| pm25 | 23 Moderate |
| co | 475 Good |
| o3 | 25 Good |
| no2 | 21 Good |
| pm10 | 32 Moderate |
| so2 | 4 Good |

| index | 2020-05 | 2020-04 | 2020-03 | 2020-02 | 2020-01 | 2019-12 | 2019-11 | 2019-10 | 2019-09 | 2019-08 | 2019-07 | 2019-06 | 2019-05 | 2019-04 | 2019-03 | 2019-02 | 2019-01 | 2018-12 | 2018-11 | 2018-10 |
|---|---|---|---|---|---|---|---|---|---|---|---|---|---|---|---|---|---|---|---|---|
| pm25 | 41 (Unhealthy for Sensitive Groups) | 40 (Unhealthy for Sensitive Groups) | 40 (Unhealthy for Sensitive Groups) | 65 (Unhealthy) | 75 (Unhealthy) | 76 (Very Unhealthy) | 48 (Unhealthy for Sensitive Groups) | 28 (Moderate) | 31 (Moderate) | 36 (Unhealthy for Sensitive Groups) | 21 (Moderate) | 21 (Moderate) | 39 (Unhealthy for Sensitive Groups) | 39 (Unhealthy for Sensitive Groups) | 47 (Unhealthy for Sensitive Groups) | 62 (Unhealthy) | 82 (Very Unhealthy) | 58 (Unhealthy) | 58 (Unhealthy) | 56 (Unhealthy) |
| co | 559 (Good) | 531 (Good) | 566 (Good) | 701 (Good) | 1 (Good) | 867 (Good) | 615 (Good) | 620 (Good) | 625 (Good) | 434 (Good) | 488 (Good) | 518 (Good) | 550 (Good) | 667 (Good) | 722 (Good) | 891 (Good) | 1 (Good) | 828 (Good) | 778 (Good) | 789 (Good) |
| no2 | 22 (Good) | 26 (Good) | 25 (Good) | 17 (Good) | 31 (Good) | 39 (Good) | 30 (Good) | 21 (Good) | 20 (Good) | 19 (Good) | 16 (Good) | 18 (Good) | 16 (Good) | 18 (Good) | 29 (Good) | 29 (Good) | 42 (Moderate) | 35 (Good) | 36 (Good) | 29 (Good) |
| o3 | 171 (Unhealthy) | 124 (Unhealthy for Sensitive Groups) | 117 (Moderate) | 81 (Moderate) | 65 (Good) | 60 (Good) | 55 (Good) | 86 (Moderate) | 115 (Moderate) | 171 (Unhealthy) | 118 (Moderate) | 121 (Unhealthy for Sensitive Groups) | 109 (Moderate) | 135 (Unhealthy for Sensitive Groups) | 93 (Moderate) | 64 (Good) | 60 (Good) | 41 (Good) | 72 (Moderate) | 71 (Moderate) |
| pm10 | 61 (Unhealthy for Sensitive Groups) | 53 (Unhealthy for Sensitive Groups) | 58 (Unhealthy for Sensitive Groups) | 79 (Unhealthy for Sensitive Groups) | 90 (Unhealthy) | 91 (Unhealthy) | 65 (Unhealthy for Sensitive Groups) | 39 (Moderate) | 49 (Moderate) | 49 (Moderate) | 36 (Moderate) | 42 (Moderate) | 57 (Unhealthy for Sensitive Groups) | 60 (Unhealthy for Sensitive Groups) | 72 (Unhealthy for Sensitive Groups) | 84 (Unhealthy) | 106 (Unhealthy) | 84 (Unhealthy) | 79 (Unhealthy for Sensitive Groups) | 72 (Unhealthy for Sensitive Groups) |
| so2 | 10 (Good) | 8.7 (Good) | 8.7 (Good) | 6.1 (Good) | 8.3 (Good) | 14 (Good) | 9.8 (Good) | 8.1 (Good) | 9.4 (Good) | 9.5 (Good) | 6.5 (Good) | 7.6 (Good) | 6.1 (Good) | 10 (Good) | 14 (Good) | 10 (Good) | 13 (Good) | 10 (Good) | 13 (Good) | 11 (Good) |
PM2,5 22 (Moderate)
particulate matter (PM2.5) dustCO 219 (Good)
carbon monoxide (CO)O3 0.05 (Good)
ozone (O3)NO2 7 (Good)
nitrogen dioxide (NO2)PM10 36 (Moderate)
particulate matter (PM10) suspended dustSO2 7.7 (Good)
sulfur dioxide (SO2)檀木林体育馆
| index | 2022-05-27 |
|---|---|
| pm25 | 23 |
| co | 475 |
| o3 | 25 |
| no2 | 21 |
| pm10 | 32 |
| so2 | 4.4 |
檀木林体育馆

| index | 2020-05 | 2020-04 | 2020-03 | 2020-02 | 2020-01 | 2019-12 | 2019-11 | 2019-10 | 2019-09 | 2019-08 | 2019-07 | 2019-06 | 2019-05 | 2019-04 | 2019-03 | 2019-02 | 2019-01 | 2018-12 | 2018-11 | 2018-10 |
|---|---|---|---|---|---|---|---|---|---|---|---|---|---|---|---|---|---|---|---|---|
| pm25 | 41 | 40 | 40 | 65 | 75 | 76 | 48 | 28 | 31 | 36 | 21 | 21 | 39 | 39 | 47 | 62 | 82 | 58 | 58 | 56 |
| co | 559 | 531 | 566 | 701 | 1 | 867 | 615 | 620 | 625 | 434 | 488 | 518 | 550 | 667 | 722 | 891 | 1 | 828 | 778 | 789 |
| no2 | 22 | 26 | 25 | 17 | 31 | 39 | 30 | 21 | 20 | 19 | 16 | 18 | 16 | 18 | 29 | 29 | 42 | 35 | 36 | 29 |
| o3 | 171 | 124 | 117 | 81 | 65 | 60 | 55 | 86 | 115 | 171 | 118 | 121 | 109 | 135 | 93 | 64 | 60 | 41 | 72 | 71 |
| pm10 | 61 | 53 | 58 | 79 | 90 | 91 | 65 | 39 | 49 | 49 | 36 | 42 | 57 | 60 | 72 | 84 | 106 | 84 | 79 | 72 |
| so2 | 10 | 8.7 | 8.7 | 6.1 | 8.3 | 14 | 9.8 | 8.1 | 9.4 | 9.5 | 6.5 | 7.6 | 6.1 | 10 | 14 | 10 | 13 | 10 | 13 | 11 |