Air Pollution in Shibagang: Real-time Air Quality Index and smog alert.
Pollution and air quality forecast for Shibagang. Today is Tuesday, June 16, 2026. The following air pollution values have been recorded for Shibagang:- particulate matter (PM2.5) dust - 22 (Moderate)
- carbon monoxide (CO) - 219 (Good)
- ozone (O3) - 0 (Good)
- nitrogen dioxide (NO2) - 7 (Good)
- particulate matter (PM10) suspended dust - 36 (Moderate)
- sulfur dioxide (SO2) - 8 (Good)

What is the air quality in Shibagang today? Is the air polluted in Shibagang?. Is there smog?
What is the current level of PM2.5 in Shibagang? (particulate matter (PM2.5) dust)
Today's PM2.5 level is:
22 (Moderate)
For comparison, the highest level of PM2.5 in Shibagang in the last 7 days was: 23 (Friday, May 27, 2022) and the lowest: 23 (Friday, May 27, 2022).
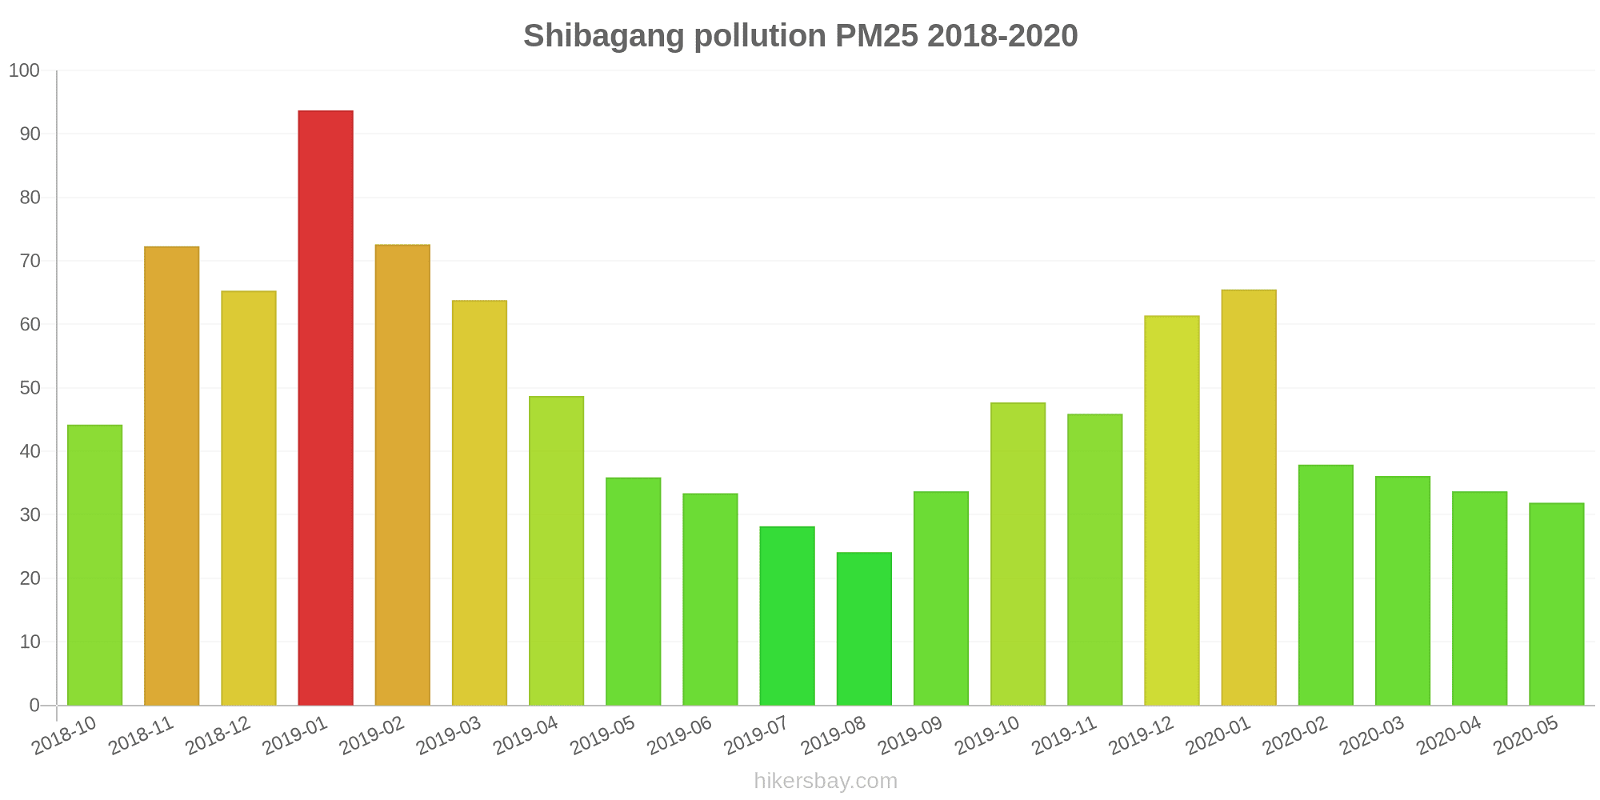
The highest PM2.5 values were recorded: 94 (January 2019).
The lowest level of particulate matter PM2.5 pollution occurs in month: August (24).
How high is the CO level? (carbon monoxide (CO))
219 (Good)
How is the O3 level today in Shibagang? (ozone (O3))
0 (Good)
How high is the level of NO2? (nitrogen dioxide (NO2))
7 (Good)
What is the level of PM10 today in Shibagang? (particulate matter (PM10) suspended dust)
The current level of particulate matter PM10 in Shibagang is:
36 (Moderate)
The highest PM10 values usually occur in month: 115 (January 2019).
The lowest value of particulate matter PM10 pollution in Shibagang is usually recorded in: February (48).
What is the level of SO2 pollution? (sulfur dioxide (SO2))
8 (Good)
Current data Friday, May 27, 2022, 3:00 PM
PM2,5 22 (Moderate)
CO 219 (Good)
O3 0 (Good)
NO2 7 (Good)
PM10 36 (Moderate)
SO2 8 (Good)
Data on air pollution from recent days in Shibagang
index
2022-05-27
pm25
23
Moderate
co
475
Good
o3
25
Good
no2
21
Good
pm10
32
Moderate
so2
4
Good
data source »
Air pollution in Shibagang from October 2018 to May 2020
index
2020-05
2020-04
2020-03
2020-02
2020-01
2019-12
2019-11
2019-10
2019-09
2019-08
2019-07
2019-06
2019-05
2019-04
2019-03
2019-02
2019-01
2018-12
2018-11
2018-10
pm25
32 (Moderate)
34 (Moderate)
36 (Unhealthy for Sensitive Groups)
38 (Unhealthy for Sensitive Groups)
66 (Unhealthy)
61 (Unhealthy)
46 (Unhealthy for Sensitive Groups)
48 (Unhealthy for Sensitive Groups)
34 (Moderate)
24 (Moderate)
28 (Moderate)
33 (Moderate)
36 (Unhealthy for Sensitive Groups)
49 (Unhealthy for Sensitive Groups)
64 (Unhealthy)
73 (Unhealthy)
94 (Very Unhealthy)
65 (Unhealthy)
72 (Unhealthy)
44 (Unhealthy for Sensitive Groups)
co
484 (Good)
565 (Good)
557 (Good)
542 (Good)
815 (Good)
817 (Good)
621 (Good)
634 (Good)
654 (Good)
550 (Good)
587 (Good)
591 (Good)
521 (Good)
612 (Good)
642 (Good)
846 (Good)
959 (Good)
847 (Good)
964 (Good)
538 (Good)
no2
31 (Good)
53 (Moderate)
43 (Moderate)
23 (Good)
43 (Moderate)
60 (Moderate)
59 (Moderate)
54 (Moderate)
41 (Moderate)
26 (Good)
25 (Good)
27 (Good)
40 (Good)
42 (Moderate)
51 (Moderate)
34 (Good)
57 (Moderate)
52 (Moderate)
56 (Moderate)
47 (Moderate)
o3
125 (Unhealthy for Sensitive Groups)
114 (Moderate)
91 (Moderate)
89 (Moderate)
57 (Good)
58 (Good)
88 (Moderate)
122 (Unhealthy for Sensitive Groups)
151 (Unhealthy)
157 (Unhealthy)
152 (Unhealthy)
182 (Very Unhealthy)
162 (Unhealthy)
127 (Unhealthy for Sensitive Groups)
118 (Moderate)
77 (Moderate)
58 (Good)
46 (Good)
84 (Moderate)
104 (Moderate)
pm10
60 (Unhealthy for Sensitive Groups)
76 (Unhealthy for Sensitive Groups)
65 (Unhealthy for Sensitive Groups)
48 (Moderate)
65 (Unhealthy for Sensitive Groups)
85 (Unhealthy)
96 (Unhealthy)
100 (Unhealthy)
90 (Unhealthy)
56 (Unhealthy for Sensitive Groups)
57 (Unhealthy for Sensitive Groups)
57 (Unhealthy for Sensitive Groups)
77 (Unhealthy for Sensitive Groups)
83 (Unhealthy)
98 (Unhealthy)
79 (Unhealthy for Sensitive Groups)
115 (Very Unhealthy)
87 (Unhealthy)
96 (Unhealthy)
76 (Unhealthy for Sensitive Groups)
so2
8.6 (Good)
10 (Good)
8.5 (Good)
6 (Good)
6.3 (Good)
8.7 (Good)
9.3 (Good)
8.9 (Good)
7.6 (Good)
4.9 (Good)
3.8 (Good)
4.1 (Good)
5.4 (Good)
5.3 (Good)
6.1 (Good)
4.2 (Good)
8.4 (Good)
7.5 (Good)
6.8 (Good)
6 (Good)
data source »
Hefei Lu Yang Qu
Friday, May 27, 2022, 3:00 PM
PM2,5 22 (Moderate)
particulate matter (PM2.5) dust
CO 219 (Good)
carbon monoxide (CO)
O3 0.05 (Good)
ozone (O3)
NO2 7 (Good)
nitrogen dioxide (NO2)
PM10 36 (Moderate)
particulate matter (PM10) suspended dust
SO2 7.7 (Good)
sulfur dioxide (SO2)
Hefei Lu Yang Qu
index
2022-05-27
pm25
23
co
475
o3
25
no2
21
pm10
32
so2
4.4
庐阳区
2018-10 2020-05

index
2020-05
2020-04
2020-03
2020-02
2020-01
2019-12
2019-11
2019-10
2019-09
2019-08
2019-07
2019-06
2019-05
2019-04
2019-03
2019-02
2019-01
2018-12
2018-11
2018-10
pm25
32
34
36
38
66
61
46
48
34
24
28
33
36
49
64
73
94
65
72
44
co
484
565
557
542
815
817
621
634
654
550
587
591
521
612
642
846
959
847
964
538
no2
31
53
43
23
43
60
59
54
41
26
25
27
40
42
51
34
57
52
56
47
o3
125
114
91
89
57
58
88
122
151
157
152
182
162
127
118
77
58
46
84
104
pm10
60
76
65
48
65
85
96
100
90
56
57
57
77
83
98
79
115
87
96
76
so2
8.6
10
8.5
6
6.3
8.7
9.3
8.9
7.6
4.9
3.8
4.1
5.4
5.3
6.1
4.2
8.4
7.5
6.8
6
* Pollution data source:
https://openaq.org
(ChinaAQIData)
The data is licensed under CC-By 4.0
PM2,5 22 (Moderate)
CO 219 (Good)
O3 0 (Good)
NO2 7 (Good)
PM10 36 (Moderate)
SO2 8 (Good)
Data on air pollution from recent days in Shibagang
| index | 2022-05-27 |
|---|---|
| pm25 | 23 Moderate |
| co | 475 Good |
| o3 | 25 Good |
| no2 | 21 Good |
| pm10 | 32 Moderate |
| so2 | 4 Good |

| index | 2020-05 | 2020-04 | 2020-03 | 2020-02 | 2020-01 | 2019-12 | 2019-11 | 2019-10 | 2019-09 | 2019-08 | 2019-07 | 2019-06 | 2019-05 | 2019-04 | 2019-03 | 2019-02 | 2019-01 | 2018-12 | 2018-11 | 2018-10 |
|---|---|---|---|---|---|---|---|---|---|---|---|---|---|---|---|---|---|---|---|---|
| pm25 | 32 (Moderate) | 34 (Moderate) | 36 (Unhealthy for Sensitive Groups) | 38 (Unhealthy for Sensitive Groups) | 66 (Unhealthy) | 61 (Unhealthy) | 46 (Unhealthy for Sensitive Groups) | 48 (Unhealthy for Sensitive Groups) | 34 (Moderate) | 24 (Moderate) | 28 (Moderate) | 33 (Moderate) | 36 (Unhealthy for Sensitive Groups) | 49 (Unhealthy for Sensitive Groups) | 64 (Unhealthy) | 73 (Unhealthy) | 94 (Very Unhealthy) | 65 (Unhealthy) | 72 (Unhealthy) | 44 (Unhealthy for Sensitive Groups) |
| co | 484 (Good) | 565 (Good) | 557 (Good) | 542 (Good) | 815 (Good) | 817 (Good) | 621 (Good) | 634 (Good) | 654 (Good) | 550 (Good) | 587 (Good) | 591 (Good) | 521 (Good) | 612 (Good) | 642 (Good) | 846 (Good) | 959 (Good) | 847 (Good) | 964 (Good) | 538 (Good) |
| no2 | 31 (Good) | 53 (Moderate) | 43 (Moderate) | 23 (Good) | 43 (Moderate) | 60 (Moderate) | 59 (Moderate) | 54 (Moderate) | 41 (Moderate) | 26 (Good) | 25 (Good) | 27 (Good) | 40 (Good) | 42 (Moderate) | 51 (Moderate) | 34 (Good) | 57 (Moderate) | 52 (Moderate) | 56 (Moderate) | 47 (Moderate) |
| o3 | 125 (Unhealthy for Sensitive Groups) | 114 (Moderate) | 91 (Moderate) | 89 (Moderate) | 57 (Good) | 58 (Good) | 88 (Moderate) | 122 (Unhealthy for Sensitive Groups) | 151 (Unhealthy) | 157 (Unhealthy) | 152 (Unhealthy) | 182 (Very Unhealthy) | 162 (Unhealthy) | 127 (Unhealthy for Sensitive Groups) | 118 (Moderate) | 77 (Moderate) | 58 (Good) | 46 (Good) | 84 (Moderate) | 104 (Moderate) |
| pm10 | 60 (Unhealthy for Sensitive Groups) | 76 (Unhealthy for Sensitive Groups) | 65 (Unhealthy for Sensitive Groups) | 48 (Moderate) | 65 (Unhealthy for Sensitive Groups) | 85 (Unhealthy) | 96 (Unhealthy) | 100 (Unhealthy) | 90 (Unhealthy) | 56 (Unhealthy for Sensitive Groups) | 57 (Unhealthy for Sensitive Groups) | 57 (Unhealthy for Sensitive Groups) | 77 (Unhealthy for Sensitive Groups) | 83 (Unhealthy) | 98 (Unhealthy) | 79 (Unhealthy for Sensitive Groups) | 115 (Very Unhealthy) | 87 (Unhealthy) | 96 (Unhealthy) | 76 (Unhealthy for Sensitive Groups) |
| so2 | 8.6 (Good) | 10 (Good) | 8.5 (Good) | 6 (Good) | 6.3 (Good) | 8.7 (Good) | 9.3 (Good) | 8.9 (Good) | 7.6 (Good) | 4.9 (Good) | 3.8 (Good) | 4.1 (Good) | 5.4 (Good) | 5.3 (Good) | 6.1 (Good) | 4.2 (Good) | 8.4 (Good) | 7.5 (Good) | 6.8 (Good) | 6 (Good) |
PM2,5 22 (Moderate)
particulate matter (PM2.5) dustCO 219 (Good)
carbon monoxide (CO)O3 0.05 (Good)
ozone (O3)NO2 7 (Good)
nitrogen dioxide (NO2)PM10 36 (Moderate)
particulate matter (PM10) suspended dustSO2 7.7 (Good)
sulfur dioxide (SO2)Hefei Lu Yang Qu
| index | 2022-05-27 |
|---|---|
| pm25 | 23 |
| co | 475 |
| o3 | 25 |
| no2 | 21 |
| pm10 | 32 |
| so2 | 4.4 |
庐阳区

| index | 2020-05 | 2020-04 | 2020-03 | 2020-02 | 2020-01 | 2019-12 | 2019-11 | 2019-10 | 2019-09 | 2019-08 | 2019-07 | 2019-06 | 2019-05 | 2019-04 | 2019-03 | 2019-02 | 2019-01 | 2018-12 | 2018-11 | 2018-10 |
|---|---|---|---|---|---|---|---|---|---|---|---|---|---|---|---|---|---|---|---|---|
| pm25 | 32 | 34 | 36 | 38 | 66 | 61 | 46 | 48 | 34 | 24 | 28 | 33 | 36 | 49 | 64 | 73 | 94 | 65 | 72 | 44 |
| co | 484 | 565 | 557 | 542 | 815 | 817 | 621 | 634 | 654 | 550 | 587 | 591 | 521 | 612 | 642 | 846 | 959 | 847 | 964 | 538 |
| no2 | 31 | 53 | 43 | 23 | 43 | 60 | 59 | 54 | 41 | 26 | 25 | 27 | 40 | 42 | 51 | 34 | 57 | 52 | 56 | 47 |
| o3 | 125 | 114 | 91 | 89 | 57 | 58 | 88 | 122 | 151 | 157 | 152 | 182 | 162 | 127 | 118 | 77 | 58 | 46 | 84 | 104 |
| pm10 | 60 | 76 | 65 | 48 | 65 | 85 | 96 | 100 | 90 | 56 | 57 | 57 | 77 | 83 | 98 | 79 | 115 | 87 | 96 | 76 |
| so2 | 8.6 | 10 | 8.5 | 6 | 6.3 | 8.7 | 9.3 | 8.9 | 7.6 | 4.9 | 3.8 | 4.1 | 5.4 | 5.3 | 6.1 | 4.2 | 8.4 | 7.5 | 6.8 | 6 |