Air Pollution in Shisanhucun: Real-time Air Quality Index and smog alert.
Pollution and air quality forecast for Shisanhucun. Today is Tuesday, June 16, 2026. The following air pollution values have been recorded for Shisanhucun:- particulate matter (PM2.5) dust - 22 (Moderate)
- carbon monoxide (CO) - 219 (Good)
- ozone (O3) - 0 (Good)
- nitrogen dioxide (NO2) - 7 (Good)
- particulate matter (PM10) suspended dust - 36 (Moderate)
- sulfur dioxide (SO2) - 8 (Good)

What is the air quality in Shisanhucun today? Is the air polluted in Shisanhucun?. Is there smog?
What is the current level of PM2.5 in Shisanhucun? (particulate matter (PM2.5) dust)
Today's PM2.5 level is:
22 (Moderate)
For comparison, the highest level of PM2.5 in Shisanhucun in the last 7 days was: 23 (Friday, May 27, 2022) and the lowest: 23 (Friday, May 27, 2022).
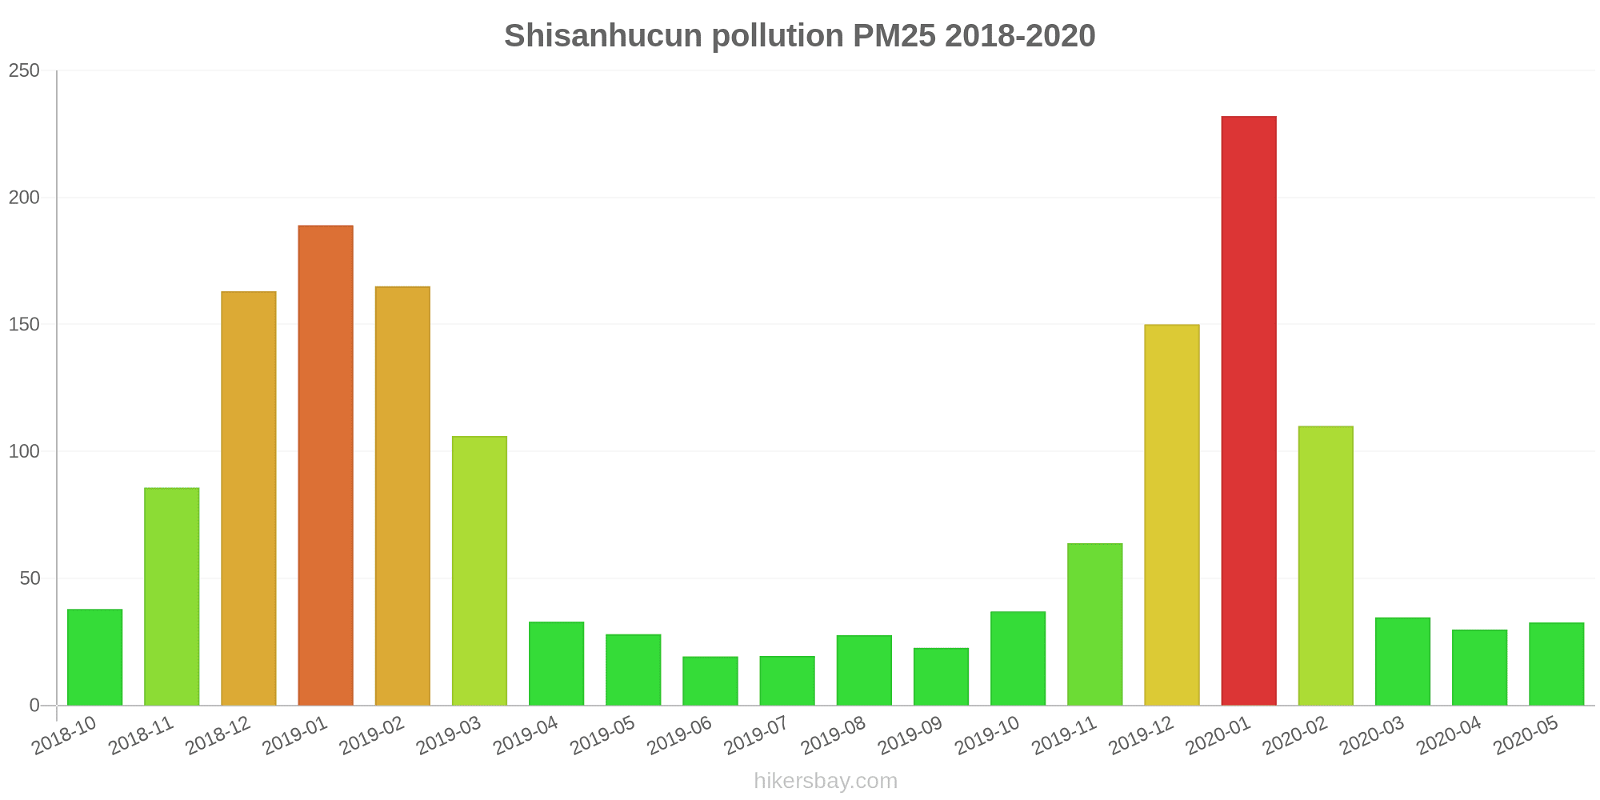
The highest PM2.5 values were recorded: 232 (January 2020).
The lowest level of particulate matter PM2.5 pollution occurs in month: June (19).
How high is the CO level? (carbon monoxide (CO))
219 (Good)
How is the O3 level today in Shisanhucun? (ozone (O3))
0 (Good)
How high is the level of NO2? (nitrogen dioxide (NO2))
7 (Good)
What is the level of PM10 today in Shisanhucun? (particulate matter (PM10) suspended dust)
The current level of particulate matter PM10 in Shisanhucun is:
36 (Moderate)
The highest PM10 values usually occur in month: 266 (December 2018).
The lowest value of particulate matter PM10 pollution in Shisanhucun is usually recorded in: June (43).
What is the level of SO2 pollution? (sulfur dioxide (SO2))
8 (Good)
Current data Friday, May 27, 2022, 3:00 PM
PM2,5 22 (Moderate)
CO 219 (Good)
O3 0 (Good)
NO2 7 (Good)
PM10 36 (Moderate)
SO2 8 (Good)
Data on air pollution from recent days in Shisanhucun
index
2022-05-27
pm25
23
Moderate
co
475
Good
o3
25
Good
no2
21
Good
pm10
32
Moderate
so2
4
Good
data source »
Air pollution in Shisanhucun from October 2018 to May 2020
index
2020-05
2020-04
2020-03
2020-02
2020-01
2019-12
2019-11
2019-10
2019-09
2019-08
2019-07
2019-06
2019-05
2019-04
2019-03
2019-02
2019-01
2018-12
2018-11
2018-10
co
498 (Good)
645 (Good)
975 (Good)
1 (Good)
2 (Good)
2 (Good)
1 (Good)
869 (Good)
535 (Good)
553 (Good)
484 (Good)
471 (Good)
391 (Good)
402 (Good)
1 (Good)
1 (Good)
2 (Good)
1 (Good)
1 (Good)
1 (Good)
no2
22 (Good)
25 (Good)
25 (Good)
38 (Good)
59 (Moderate)
56 (Moderate)
39 (Good)
38 (Good)
30 (Good)
26 (Good)
24 (Good)
19 (Good)
20 (Good)
23 (Good)
34 (Good)
44 (Moderate)
54 (Moderate)
55 (Moderate)
40 (Moderate)
36 (Good)
o3
125 (Unhealthy for Sensitive Groups)
129 (Unhealthy for Sensitive Groups)
102 (Moderate)
119 (Moderate)
71 (Moderate)
35 (Good)
51 (Good)
91 (Moderate)
124 (Unhealthy for Sensitive Groups)
139 (Unhealthy for Sensitive Groups)
151 (Unhealthy)
129 (Unhealthy for Sensitive Groups)
124 (Unhealthy for Sensitive Groups)
114 (Moderate)
110 (Moderate)
101 (Moderate)
69 (Good)
50 (Good)
64 (Good)
70 (Good)
pm10
69 (Unhealthy for Sensitive Groups)
138 (Very Unhealthy)
58 (Unhealthy for Sensitive Groups)
113 (Very Unhealthy)
215 (Very bad Hazardous)
175 (Very bad Hazardous)
101 (Unhealthy)
89 (Unhealthy)
78 (Unhealthy for Sensitive Groups)
67 (Unhealthy for Sensitive Groups)
64 (Unhealthy for Sensitive Groups)
43 (Moderate)
64 (Unhealthy for Sensitive Groups)
69 (Unhealthy for Sensitive Groups)
129 (Very Unhealthy)
177 (Very bad Hazardous)
228 (Very bad Hazardous)
266 (Very bad Hazardous)
195 (Very bad Hazardous)
65 (Unhealthy for Sensitive Groups)
so2
5.6 (Good)
7.2 (Good)
6.5 (Good)
13 (Good)
14 (Good)
12 (Good)
15 (Good)
15 (Good)
12 (Good)
9.6 (Good)
8.4 (Good)
7.2 (Good)
8.7 (Good)
7.7 (Good)
13 (Good)
15 (Good)
17 (Good)
12 (Good)
15 (Good)
13 (Good)
pm25
33 (Moderate)
30 (Moderate)
35 (Moderate)
110 (Very bad Hazardous)
232 (Very bad Hazardous)
150 (Very bad Hazardous)
64 (Unhealthy)
37 (Unhealthy for Sensitive Groups)
23 (Moderate)
28 (Moderate)
19 (Moderate)
19 (Moderate)
28 (Moderate)
33 (Moderate)
106 (Very Unhealthy)
165 (Very bad Hazardous)
189 (Very bad Hazardous)
163 (Very bad Hazardous)
86 (Very Unhealthy)
38 (Unhealthy for Sensitive Groups)
data source »
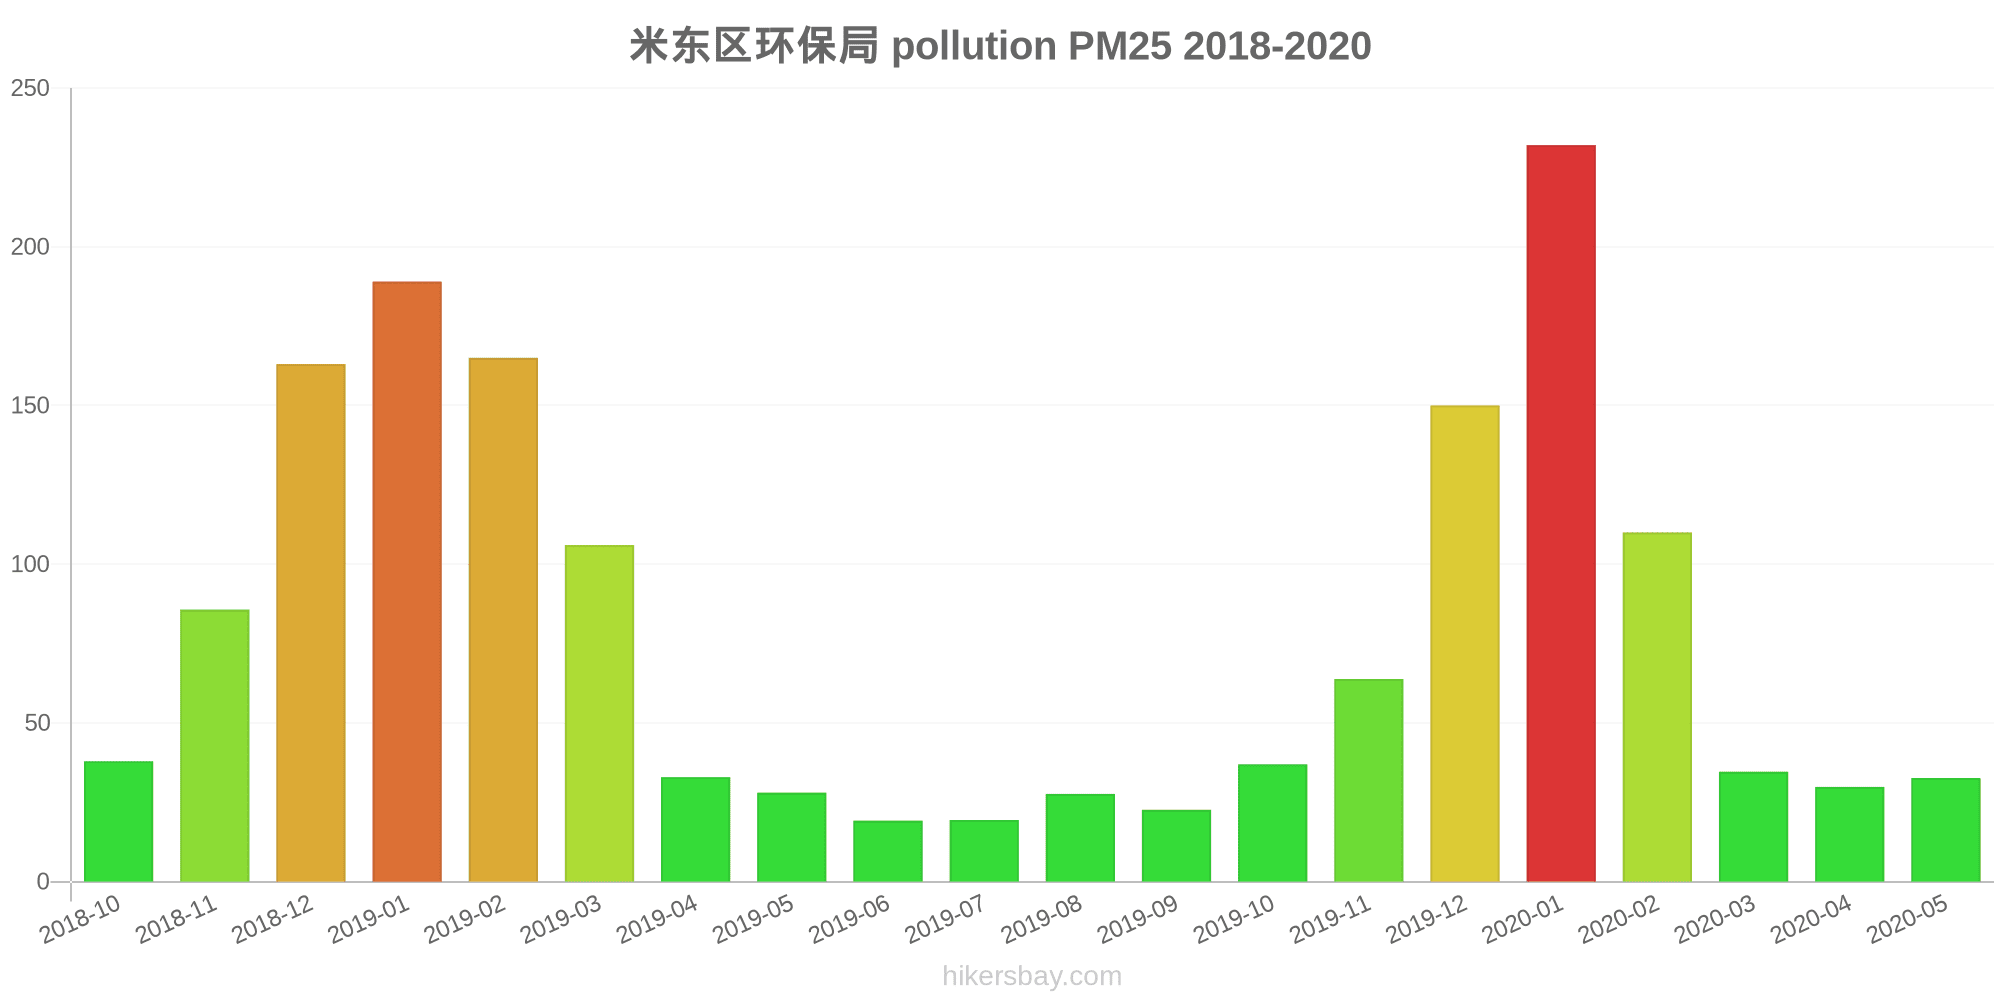
米东区环保局
Friday, May 27, 2022, 3:00 PM
PM2,5 22 (Moderate)
particulate matter (PM2.5) dust
CO 219 (Good)
carbon monoxide (CO)
O3 0.05 (Good)
ozone (O3)
NO2 7 (Good)
nitrogen dioxide (NO2)
PM10 36 (Moderate)
particulate matter (PM10) suspended dust
SO2 7.7 (Good)
sulfur dioxide (SO2)
米东区环保局
index
2022-05-27
pm25
23
co
475
o3
25
no2
21
pm10
32
so2
4.4
米东区环保局
2018-10 2020-05

index
2020-05
2020-04
2020-03
2020-02
2020-01
2019-12
2019-11
2019-10
2019-09
2019-08
2019-07
2019-06
2019-05
2019-04
2019-03
2019-02
2019-01
2018-12
2018-11
2018-10
pm25
33
30
35
110
232
150
64
37
23
28
19
19
28
33
106
165
189
163
86
38
co
498
645
975
1
2
2
1
869
535
553
484
471
391
402
1
1
2
1
1
1
no2
22
25
25
38
59
56
39
38
30
26
24
19
20
23
34
44
54
55
40
36
o3
125
129
102
119
71
35
51
91
124
139
151
129
124
114
110
101
69
50
64
70
so2
5.6
7.2
6.5
13
14
12
15
15
12
9.6
8.4
7.2
8.7
7.7
13
15
17
12
15
13
pm10
69
138
58
113
215
175
101
89
78
67
64
43
64
69
129
177
228
266
195
65
* Pollution data source:
https://openaq.org
(ChinaAQIData)
The data is licensed under CC-By 4.0
PM2,5 22 (Moderate)
CO 219 (Good)
O3 0 (Good)
NO2 7 (Good)
PM10 36 (Moderate)
SO2 8 (Good)
Data on air pollution from recent days in Shisanhucun
| index | 2022-05-27 |
|---|---|
| pm25 | 23 Moderate |
| co | 475 Good |
| o3 | 25 Good |
| no2 | 21 Good |
| pm10 | 32 Moderate |
| so2 | 4 Good |

| index | 2020-05 | 2020-04 | 2020-03 | 2020-02 | 2020-01 | 2019-12 | 2019-11 | 2019-10 | 2019-09 | 2019-08 | 2019-07 | 2019-06 | 2019-05 | 2019-04 | 2019-03 | 2019-02 | 2019-01 | 2018-12 | 2018-11 | 2018-10 |
|---|---|---|---|---|---|---|---|---|---|---|---|---|---|---|---|---|---|---|---|---|
| co | 498 (Good) | 645 (Good) | 975 (Good) | 1 (Good) | 2 (Good) | 2 (Good) | 1 (Good) | 869 (Good) | 535 (Good) | 553 (Good) | 484 (Good) | 471 (Good) | 391 (Good) | 402 (Good) | 1 (Good) | 1 (Good) | 2 (Good) | 1 (Good) | 1 (Good) | 1 (Good) |
| no2 | 22 (Good) | 25 (Good) | 25 (Good) | 38 (Good) | 59 (Moderate) | 56 (Moderate) | 39 (Good) | 38 (Good) | 30 (Good) | 26 (Good) | 24 (Good) | 19 (Good) | 20 (Good) | 23 (Good) | 34 (Good) | 44 (Moderate) | 54 (Moderate) | 55 (Moderate) | 40 (Moderate) | 36 (Good) |
| o3 | 125 (Unhealthy for Sensitive Groups) | 129 (Unhealthy for Sensitive Groups) | 102 (Moderate) | 119 (Moderate) | 71 (Moderate) | 35 (Good) | 51 (Good) | 91 (Moderate) | 124 (Unhealthy for Sensitive Groups) | 139 (Unhealthy for Sensitive Groups) | 151 (Unhealthy) | 129 (Unhealthy for Sensitive Groups) | 124 (Unhealthy for Sensitive Groups) | 114 (Moderate) | 110 (Moderate) | 101 (Moderate) | 69 (Good) | 50 (Good) | 64 (Good) | 70 (Good) |
| pm10 | 69 (Unhealthy for Sensitive Groups) | 138 (Very Unhealthy) | 58 (Unhealthy for Sensitive Groups) | 113 (Very Unhealthy) | 215 (Very bad Hazardous) | 175 (Very bad Hazardous) | 101 (Unhealthy) | 89 (Unhealthy) | 78 (Unhealthy for Sensitive Groups) | 67 (Unhealthy for Sensitive Groups) | 64 (Unhealthy for Sensitive Groups) | 43 (Moderate) | 64 (Unhealthy for Sensitive Groups) | 69 (Unhealthy for Sensitive Groups) | 129 (Very Unhealthy) | 177 (Very bad Hazardous) | 228 (Very bad Hazardous) | 266 (Very bad Hazardous) | 195 (Very bad Hazardous) | 65 (Unhealthy for Sensitive Groups) |
| so2 | 5.6 (Good) | 7.2 (Good) | 6.5 (Good) | 13 (Good) | 14 (Good) | 12 (Good) | 15 (Good) | 15 (Good) | 12 (Good) | 9.6 (Good) | 8.4 (Good) | 7.2 (Good) | 8.7 (Good) | 7.7 (Good) | 13 (Good) | 15 (Good) | 17 (Good) | 12 (Good) | 15 (Good) | 13 (Good) |
| pm25 | 33 (Moderate) | 30 (Moderate) | 35 (Moderate) | 110 (Very bad Hazardous) | 232 (Very bad Hazardous) | 150 (Very bad Hazardous) | 64 (Unhealthy) | 37 (Unhealthy for Sensitive Groups) | 23 (Moderate) | 28 (Moderate) | 19 (Moderate) | 19 (Moderate) | 28 (Moderate) | 33 (Moderate) | 106 (Very Unhealthy) | 165 (Very bad Hazardous) | 189 (Very bad Hazardous) | 163 (Very bad Hazardous) | 86 (Very Unhealthy) | 38 (Unhealthy for Sensitive Groups) |
PM2,5 22 (Moderate)
particulate matter (PM2.5) dustCO 219 (Good)
carbon monoxide (CO)O3 0.05 (Good)
ozone (O3)NO2 7 (Good)
nitrogen dioxide (NO2)PM10 36 (Moderate)
particulate matter (PM10) suspended dustSO2 7.7 (Good)
sulfur dioxide (SO2)米东区环保局
| index | 2022-05-27 |
|---|---|
| pm25 | 23 |
| co | 475 |
| o3 | 25 |
| no2 | 21 |
| pm10 | 32 |
| so2 | 4.4 |
米东区环保局
| index | 2020-05 | 2020-04 | 2020-03 | 2020-02 | 2020-01 | 2019-12 | 2019-11 | 2019-10 | 2019-09 | 2019-08 | 2019-07 | 2019-06 | 2019-05 | 2019-04 | 2019-03 | 2019-02 | 2019-01 | 2018-12 | 2018-11 | 2018-10 |
|---|---|---|---|---|---|---|---|---|---|---|---|---|---|---|---|---|---|---|---|---|
| pm25 | 33 | 30 | 35 | 110 | 232 | 150 | 64 | 37 | 23 | 28 | 19 | 19 | 28 | 33 | 106 | 165 | 189 | 163 | 86 | 38 |
| co | 498 | 645 | 975 | 1 | 2 | 2 | 1 | 869 | 535 | 553 | 484 | 471 | 391 | 402 | 1 | 1 | 2 | 1 | 1 | 1 |
| no2 | 22 | 25 | 25 | 38 | 59 | 56 | 39 | 38 | 30 | 26 | 24 | 19 | 20 | 23 | 34 | 44 | 54 | 55 | 40 | 36 |
| o3 | 125 | 129 | 102 | 119 | 71 | 35 | 51 | 91 | 124 | 139 | 151 | 129 | 124 | 114 | 110 | 101 | 69 | 50 | 64 | 70 |
| so2 | 5.6 | 7.2 | 6.5 | 13 | 14 | 12 | 15 | 15 | 12 | 9.6 | 8.4 | 7.2 | 8.7 | 7.7 | 13 | 15 | 17 | 12 | 15 | 13 |
| pm10 | 69 | 138 | 58 | 113 | 215 | 175 | 101 | 89 | 78 | 67 | 64 | 43 | 64 | 69 | 129 | 177 | 228 | 266 | 195 | 65 |