Air Pollution in Liaogongda: Real-time Air Quality Index and smog alert.
Pollution and air quality forecast for Liaogongda. Today is Tuesday, June 16, 2026. The following air pollution values have been recorded for Liaogongda:- particulate matter (PM10) suspended dust - 7 (Good)
- particulate matter (PM2.5) dust - 2 (Good)
- carbon monoxide (CO) - 100 (Good)
- nitrogen dioxide (NO2) - 8 (Good)
- ozone (O3) - 0 (Good)
- sulfur dioxide (SO2) - 9 (Good)

What is the air quality in Liaogongda today? Is the air polluted in Liaogongda?. Is there smog?
What is the level of PM10 today in Liaogongda? (particulate matter (PM10) suspended dust)
The current level of particulate matter PM10 in Liaogongda is:
7 (Good)
The highest PM10 values usually occur in month: 122 (April 2019).
The lowest value of particulate matter PM10 pollution in Liaogongda is usually recorded in: August (31).
What is the current level of PM2.5 in Liaogongda? (particulate matter (PM2.5) dust)
Today's PM2.5 level is:
2 (Good)
For comparison, the highest level of PM2.5 in Liaogongda in the last 7 days was: 24 (Friday, May 27, 2022) and the lowest: 24 (Friday, May 27, 2022).
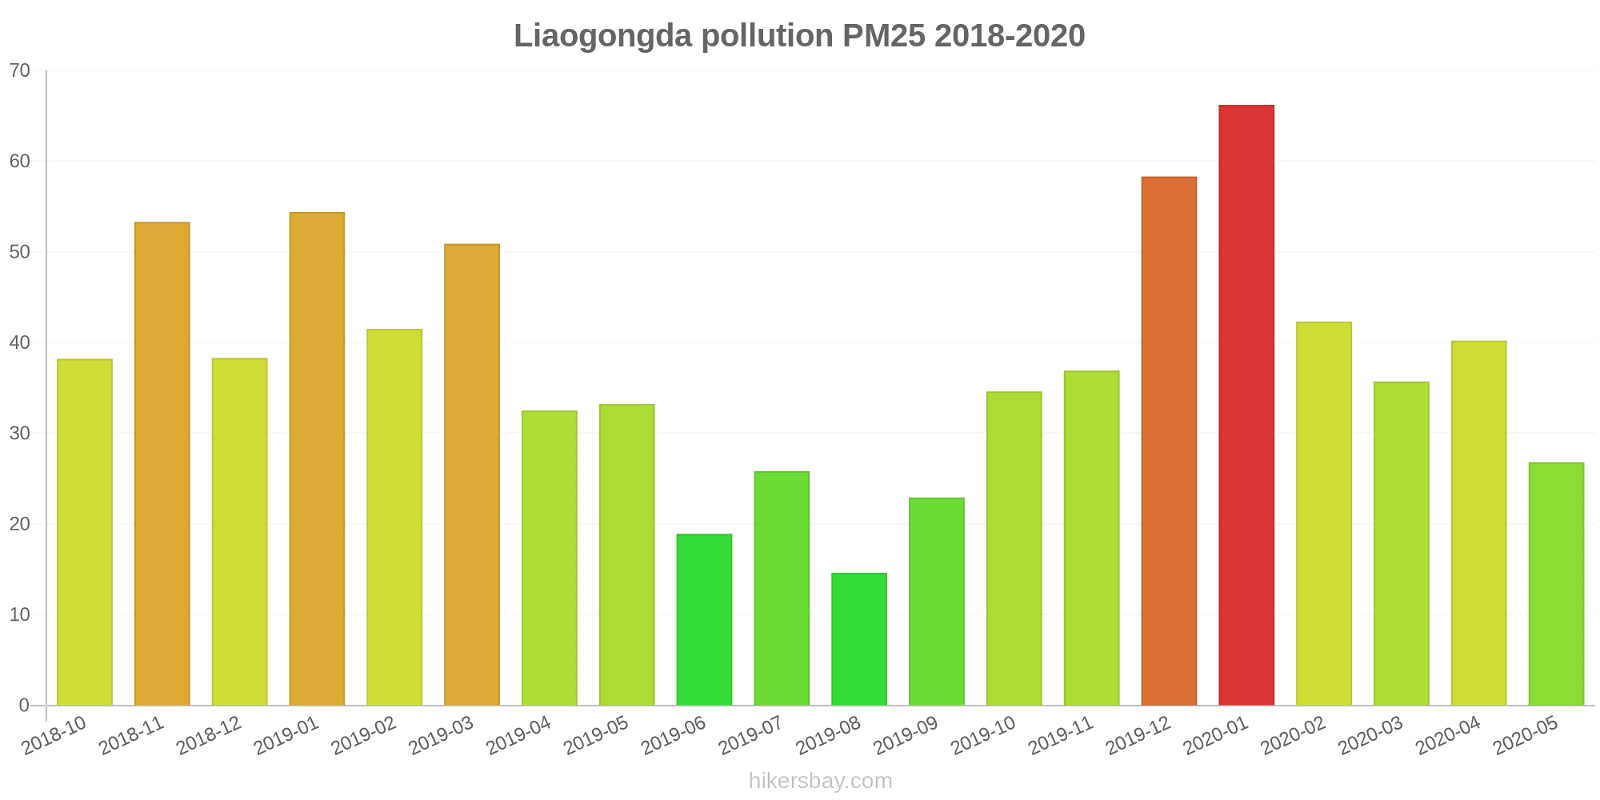
The highest PM2.5 values were recorded: 66 (January 2020).
The lowest level of particulate matter PM2.5 pollution occurs in month: August (15).
How high is the CO level? (carbon monoxide (CO))
100 (Good)
How high is the level of NO2? (nitrogen dioxide (NO2))
8 (Good)
How is the O3 level today in Liaogongda? (ozone (O3))
0 (Good)
What is the level of SO2 pollution? (sulfur dioxide (SO2))
9 (Good)
Current data Friday, May 27, 2022, 12:00 PM
PM10 7 (Good)
PM2,5 2 (Good)
CO 100 (Good)
NO2 8 (Good)
O3 0 (Good)
SO2 9 (Good)
Data on air pollution from recent days in Liaogongda
index
2022-05-27
pm10
32
Moderate
pm25
24
Moderate
co
468
Good
no2
21
Good
o3
32
Good
so2
5
Good
data source »
Air pollution in Liaogongda from October 2018 to May 2020
index
2020-05
2020-04
2020-03
2020-02
2020-01
2019-12
2019-11
2019-10
2019-09
2019-08
2019-07
2019-06
2019-05
2019-04
2019-03
2019-02
2019-01
2018-12
2018-11
2018-10
pm25
27 (Moderate)
40 (Unhealthy for Sensitive Groups)
36 (Unhealthy for Sensitive Groups)
42 (Unhealthy for Sensitive Groups)
66 (Unhealthy)
58 (Unhealthy)
37 (Unhealthy for Sensitive Groups)
35 (Moderate)
23 (Moderate)
15 (Moderate)
26 (Moderate)
19 (Moderate)
33 (Moderate)
33 (Moderate)
51 (Unhealthy for Sensitive Groups)
42 (Unhealthy for Sensitive Groups)
54 (Unhealthy for Sensitive Groups)
38 (Unhealthy for Sensitive Groups)
53 (Unhealthy for Sensitive Groups)
38 (Unhealthy for Sensitive Groups)
co
349 (Good)
508 (Good)
606 (Good)
693 (Good)
1 (Good)
1 (Good)
779 (Good)
678 (Good)
580 (Good)
520 (Good)
657 (Good)
534 (Good)
558 (Good)
595 (Good)
721 (Good)
823 (Good)
941 (Good)
758 (Good)
782 (Good)
679 (Good)
no2
15 (Good)
24 (Good)
20 (Good)
15 (Good)
28 (Good)
31 (Good)
25 (Good)
25 (Good)
20 (Good)
14 (Good)
16 (Good)
18 (Good)
17 (Good)
21 (Good)
29 (Good)
24 (Good)
32 (Good)
28 (Good)
38 (Good)
32 (Good)
o3
140 (Unhealthy for Sensitive Groups)
129 (Unhealthy for Sensitive Groups)
102 (Moderate)
88 (Moderate)
83 (Moderate)
61 (Good)
69 (Good)
105 (Moderate)
125 (Unhealthy for Sensitive Groups)
105 (Moderate)
155 (Unhealthy)
150 (Unhealthy)
141 (Unhealthy for Sensitive Groups)
117 (Moderate)
105 (Moderate)
85 (Moderate)
77 (Moderate)
61 (Good)
71 (Moderate)
89 (Moderate)
pm10
92 (Unhealthy)
81 (Unhealthy)
61 (Unhealthy for Sensitive Groups)
56 (Unhealthy for Sensitive Groups)
83 (Unhealthy)
80 (Unhealthy for Sensitive Groups)
66 (Unhealthy for Sensitive Groups)
70 (Unhealthy for Sensitive Groups)
53 (Unhealthy for Sensitive Groups)
31 (Moderate)
46 (Moderate)
40 (Moderate)
79 (Unhealthy for Sensitive Groups)
122 (Very Unhealthy)
87 (Unhealthy)
65 (Unhealthy for Sensitive Groups)
94 (Unhealthy)
71 (Unhealthy for Sensitive Groups)
89 (Unhealthy)
68 (Unhealthy for Sensitive Groups)
so2
15 (Good)
14 (Good)
15 (Good)
17 (Good)
32 (Good)
29 (Good)
23 (Good)
16 (Good)
14 (Good)
7.2 (Good)
5.7 (Good)
9.9 (Good)
14 (Good)
15 (Good)
26 (Good)
25 (Good)
34 (Good)
30 (Good)
34 (Good)
19 (Good)
data source »
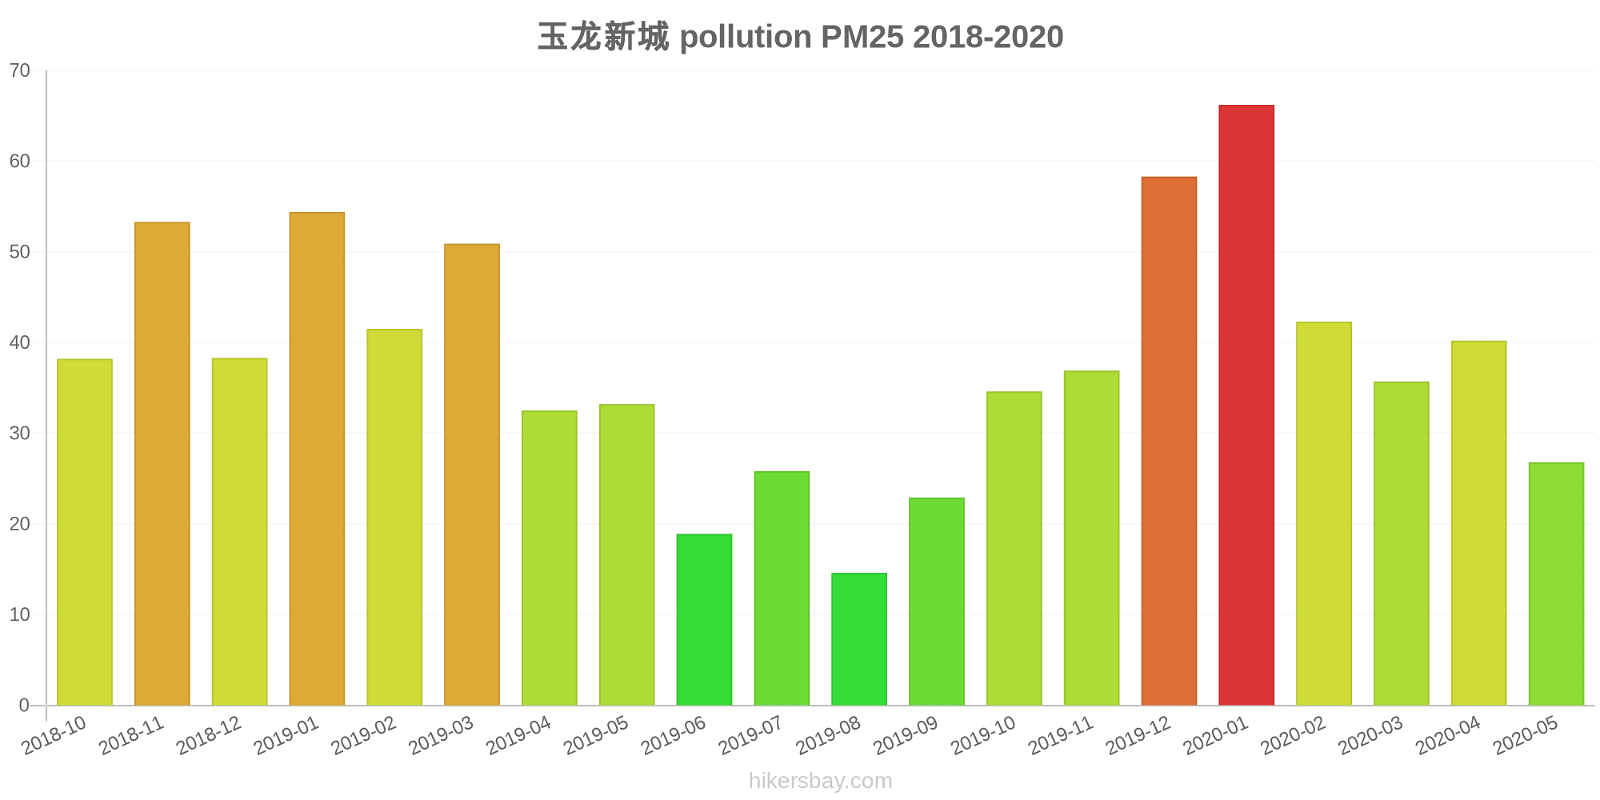
玉龙新城
Friday, May 27, 2022, 12:00 PM
PM10 6.7 (Good)
particulate matter (PM10) suspended dust
PM2,5 1.7 (Good)
particulate matter (PM2.5) dust
CO 100 (Good)
carbon monoxide (CO)
NO2 7.6 (Good)
nitrogen dioxide (NO2)
O3 0.02 (Good)
ozone (O3)
SO2 8.6 (Good)
sulfur dioxide (SO2)
玉龙新城
index
2022-05-27
pm10
32
pm25
24
co
468
no2
21
o3
32
so2
4.6
玉龙新城
2018-10 2020-05
index
2020-05
2020-04
2020-03
2020-02
2020-01
2019-12
2019-11
2019-10
2019-09
2019-08
2019-07
2019-06
2019-05
2019-04
2019-03
2019-02
2019-01
2018-12
2018-11
2018-10
pm25
27
40
36
42
66
58
37
35
23
15
26
19
33
33
51
42
54
38
53
38
co
349
508
606
693
1
1
779
678
580
520
657
534
558
595
721
823
941
758
782
679
no2
15
24
20
15
28
31
25
25
20
14
16
18
17
21
29
24
32
28
38
32
o3
140
129
102
88
83
61
69
105
125
105
155
150
141
117
105
85
77
61
71
89
pm10
92
81
61
56
83
80
66
70
53
31
46
40
79
122
87
65
94
71
89
68
so2
15
14
15
17
32
29
23
16
14
7.2
5.7
9.9
14
15
26
25
34
30
34
19
* Pollution data source:
https://openaq.org
(ChinaAQIData)
The data is licensed under CC-By 4.0
PM10 7 (Good)
PM2,5 2 (Good)
CO 100 (Good)
NO2 8 (Good)
O3 0 (Good)
SO2 9 (Good)
Data on air pollution from recent days in Liaogongda
| index | 2022-05-27 |
|---|---|
| pm10 | 32 Moderate |
| pm25 | 24 Moderate |
| co | 468 Good |
| no2 | 21 Good |
| o3 | 32 Good |
| so2 | 5 Good |

| index | 2020-05 | 2020-04 | 2020-03 | 2020-02 | 2020-01 | 2019-12 | 2019-11 | 2019-10 | 2019-09 | 2019-08 | 2019-07 | 2019-06 | 2019-05 | 2019-04 | 2019-03 | 2019-02 | 2019-01 | 2018-12 | 2018-11 | 2018-10 |
|---|---|---|---|---|---|---|---|---|---|---|---|---|---|---|---|---|---|---|---|---|
| pm25 | 27 (Moderate) | 40 (Unhealthy for Sensitive Groups) | 36 (Unhealthy for Sensitive Groups) | 42 (Unhealthy for Sensitive Groups) | 66 (Unhealthy) | 58 (Unhealthy) | 37 (Unhealthy for Sensitive Groups) | 35 (Moderate) | 23 (Moderate) | 15 (Moderate) | 26 (Moderate) | 19 (Moderate) | 33 (Moderate) | 33 (Moderate) | 51 (Unhealthy for Sensitive Groups) | 42 (Unhealthy for Sensitive Groups) | 54 (Unhealthy for Sensitive Groups) | 38 (Unhealthy for Sensitive Groups) | 53 (Unhealthy for Sensitive Groups) | 38 (Unhealthy for Sensitive Groups) |
| co | 349 (Good) | 508 (Good) | 606 (Good) | 693 (Good) | 1 (Good) | 1 (Good) | 779 (Good) | 678 (Good) | 580 (Good) | 520 (Good) | 657 (Good) | 534 (Good) | 558 (Good) | 595 (Good) | 721 (Good) | 823 (Good) | 941 (Good) | 758 (Good) | 782 (Good) | 679 (Good) |
| no2 | 15 (Good) | 24 (Good) | 20 (Good) | 15 (Good) | 28 (Good) | 31 (Good) | 25 (Good) | 25 (Good) | 20 (Good) | 14 (Good) | 16 (Good) | 18 (Good) | 17 (Good) | 21 (Good) | 29 (Good) | 24 (Good) | 32 (Good) | 28 (Good) | 38 (Good) | 32 (Good) |
| o3 | 140 (Unhealthy for Sensitive Groups) | 129 (Unhealthy for Sensitive Groups) | 102 (Moderate) | 88 (Moderate) | 83 (Moderate) | 61 (Good) | 69 (Good) | 105 (Moderate) | 125 (Unhealthy for Sensitive Groups) | 105 (Moderate) | 155 (Unhealthy) | 150 (Unhealthy) | 141 (Unhealthy for Sensitive Groups) | 117 (Moderate) | 105 (Moderate) | 85 (Moderate) | 77 (Moderate) | 61 (Good) | 71 (Moderate) | 89 (Moderate) |
| pm10 | 92 (Unhealthy) | 81 (Unhealthy) | 61 (Unhealthy for Sensitive Groups) | 56 (Unhealthy for Sensitive Groups) | 83 (Unhealthy) | 80 (Unhealthy for Sensitive Groups) | 66 (Unhealthy for Sensitive Groups) | 70 (Unhealthy for Sensitive Groups) | 53 (Unhealthy for Sensitive Groups) | 31 (Moderate) | 46 (Moderate) | 40 (Moderate) | 79 (Unhealthy for Sensitive Groups) | 122 (Very Unhealthy) | 87 (Unhealthy) | 65 (Unhealthy for Sensitive Groups) | 94 (Unhealthy) | 71 (Unhealthy for Sensitive Groups) | 89 (Unhealthy) | 68 (Unhealthy for Sensitive Groups) |
| so2 | 15 (Good) | 14 (Good) | 15 (Good) | 17 (Good) | 32 (Good) | 29 (Good) | 23 (Good) | 16 (Good) | 14 (Good) | 7.2 (Good) | 5.7 (Good) | 9.9 (Good) | 14 (Good) | 15 (Good) | 26 (Good) | 25 (Good) | 34 (Good) | 30 (Good) | 34 (Good) | 19 (Good) |
PM10 6.7 (Good)
particulate matter (PM10) suspended dustPM2,5 1.7 (Good)
particulate matter (PM2.5) dustCO 100 (Good)
carbon monoxide (CO)NO2 7.6 (Good)
nitrogen dioxide (NO2)O3 0.02 (Good)
ozone (O3)SO2 8.6 (Good)
sulfur dioxide (SO2)玉龙新城
| index | 2022-05-27 |
|---|---|
| pm10 | 32 |
| pm25 | 24 |
| co | 468 |
| no2 | 21 |
| o3 | 32 |
| so2 | 4.6 |
玉龙新城

| index | 2020-05 | 2020-04 | 2020-03 | 2020-02 | 2020-01 | 2019-12 | 2019-11 | 2019-10 | 2019-09 | 2019-08 | 2019-07 | 2019-06 | 2019-05 | 2019-04 | 2019-03 | 2019-02 | 2019-01 | 2018-12 | 2018-11 | 2018-10 |
|---|---|---|---|---|---|---|---|---|---|---|---|---|---|---|---|---|---|---|---|---|
| pm25 | 27 | 40 | 36 | 42 | 66 | 58 | 37 | 35 | 23 | 15 | 26 | 19 | 33 | 33 | 51 | 42 | 54 | 38 | 53 | 38 |
| co | 349 | 508 | 606 | 693 | 1 | 1 | 779 | 678 | 580 | 520 | 657 | 534 | 558 | 595 | 721 | 823 | 941 | 758 | 782 | 679 |
| no2 | 15 | 24 | 20 | 15 | 28 | 31 | 25 | 25 | 20 | 14 | 16 | 18 | 17 | 21 | 29 | 24 | 32 | 28 | 38 | 32 |
| o3 | 140 | 129 | 102 | 88 | 83 | 61 | 69 | 105 | 125 | 105 | 155 | 150 | 141 | 117 | 105 | 85 | 77 | 61 | 71 | 89 |
| pm10 | 92 | 81 | 61 | 56 | 83 | 80 | 66 | 70 | 53 | 31 | 46 | 40 | 79 | 122 | 87 | 65 | 94 | 71 | 89 | 68 |
| so2 | 15 | 14 | 15 | 17 | 32 | 29 | 23 | 16 | 14 | 7.2 | 5.7 | 9.9 | 14 | 15 | 26 | 25 | 34 | 30 | 34 | 19 |