Air Pollution in Huadong: Real-time Air Quality Index and smog alert.
Pollution and air quality forecast for Huadong. Today is Tuesday, June 16, 2026. The following air pollution values have been recorded for Huadong:- particulate matter (PM10) suspended dust - 7 (Good)
- particulate matter (PM2.5) dust - 2 (Good)
- carbon monoxide (CO) - 100 (Good)
- nitrogen dioxide (NO2) - 8 (Good)
- ozone (O3) - 0 (Good)
- sulfur dioxide (SO2) - 9 (Good)

What is the air quality in Huadong today? Is the air polluted in Huadong?. Is there smog?
What is the level of PM10 today in Huadong? (particulate matter (PM10) suspended dust)
The current level of particulate matter PM10 in Huadong is:
7 (Good)
The highest PM10 values usually occur in month: 136 (April 2019).
The lowest value of particulate matter PM10 pollution in Huadong is usually recorded in: August (39).
What is the current level of PM2.5 in Huadong? (particulate matter (PM2.5) dust)
Today's PM2.5 level is:
2 (Good)
For comparison, the highest level of PM2.5 in Huadong in the last 7 days was: 24 (Friday, May 27, 2022) and the lowest: 24 (Friday, May 27, 2022).
The highest PM2.5 values were recorded: 85 (January 2020).
The lowest level of particulate matter PM2.5 pollution occurs in month: August (22).
How high is the CO level? (carbon monoxide (CO))
100 (Good)
How high is the level of NO2? (nitrogen dioxide (NO2))
8 (Good)
How is the O3 level today in Huadong? (ozone (O3))
0 (Good)
What is the level of SO2 pollution? (sulfur dioxide (SO2))
9 (Good)
Current data Friday, May 27, 2022, 12:00 PM
PM10 7 (Good)
PM2,5 2 (Good)
CO 100 (Good)
NO2 8 (Good)
O3 0 (Good)
SO2 9 (Good)
Data on air pollution from recent days in Huadong
index
2022-05-27
pm10
32
Moderate
pm25
24
Moderate
co
468
Good
no2
21
Good
o3
32
Good
so2
5
Good
data source »
Air pollution in Huadong from October 2018 to May 2020
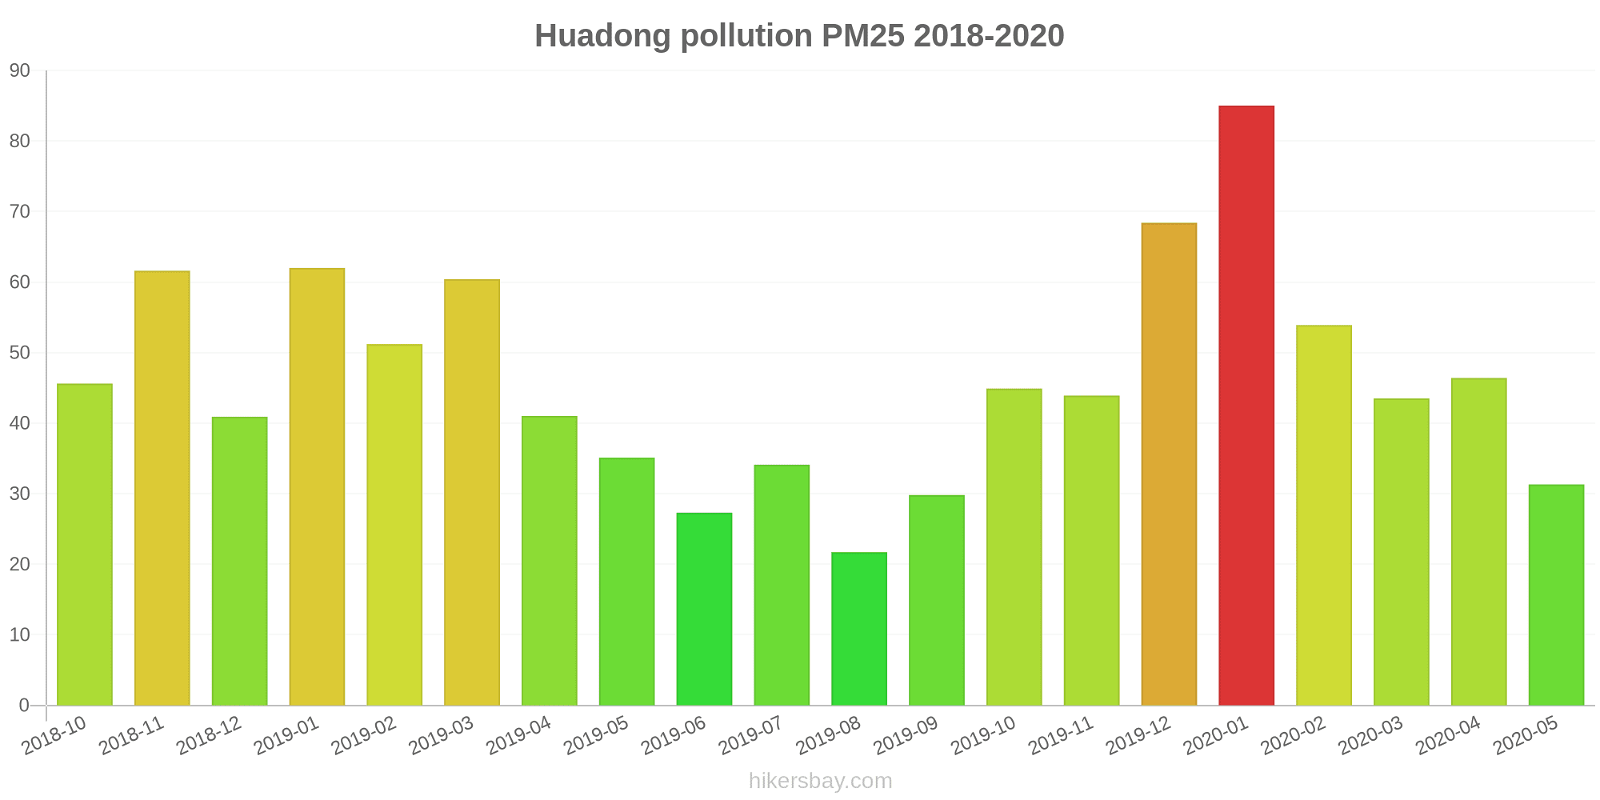
index
2020-05
2020-04
2020-03
2020-02
2020-01
2019-12
2019-11
2019-10
2019-09
2019-08
2019-07
2019-06
2019-05
2019-04
2019-03
2019-02
2019-01
2018-12
2018-11
2018-10
pm25
31 (Moderate)
46 (Unhealthy for Sensitive Groups)
44 (Unhealthy for Sensitive Groups)
54 (Unhealthy for Sensitive Groups)
85 (Very Unhealthy)
68 (Unhealthy)
44 (Unhealthy for Sensitive Groups)
45 (Unhealthy for Sensitive Groups)
30 (Moderate)
22 (Moderate)
34 (Moderate)
27 (Moderate)
35 (Unhealthy for Sensitive Groups)
41 (Unhealthy for Sensitive Groups)
60 (Unhealthy)
51 (Unhealthy for Sensitive Groups)
62 (Unhealthy)
41 (Unhealthy for Sensitive Groups)
62 (Unhealthy)
46 (Unhealthy for Sensitive Groups)
co
492 (Good)
524 (Good)
613 (Good)
660 (Good)
1 (Good)
1 (Good)
814 (Good)
1 (Good)
698 (Good)
655 (Good)
764 (Good)
636 (Good)
558 (Good)
611 (Good)
676 (Good)
714 (Good)
976 (Good)
720 (Good)
964 (Good)
1 (Good)
no2
17 (Good)
22 (Good)
21 (Good)
16 (Good)
32 (Good)
34 (Good)
28 (Good)
31 (Good)
23 (Good)
17 (Good)
19 (Good)
19 (Good)
19 (Good)
25 (Good)
27 (Good)
25 (Good)
33 (Good)
27 (Good)
38 (Good)
32 (Good)
o3
133 (Unhealthy for Sensitive Groups)
123 (Unhealthy for Sensitive Groups)
98 (Moderate)
82 (Moderate)
75 (Moderate)
58 (Good)
65 (Good)
97 (Moderate)
126 (Unhealthy for Sensitive Groups)
112 (Moderate)
165 (Unhealthy)
152 (Unhealthy)
149 (Unhealthy for Sensitive Groups)
121 (Unhealthy for Sensitive Groups)
106 (Moderate)
80 (Moderate)
70 (Good)
69 (Good)
68 (Good)
87 (Moderate)
pm10
107 (Unhealthy)
99 (Unhealthy)
77 (Unhealthy for Sensitive Groups)
75 (Unhealthy for Sensitive Groups)
109 (Unhealthy)
91 (Unhealthy)
77 (Unhealthy for Sensitive Groups)
84 (Unhealthy)
63 (Unhealthy for Sensitive Groups)
39 (Moderate)
55 (Unhealthy for Sensitive Groups)
50 (Moderate)
88 (Unhealthy)
136 (Very Unhealthy)
95 (Unhealthy)
80 (Unhealthy)
108 (Unhealthy)
81 (Unhealthy)
110 (Very Unhealthy)
83 (Unhealthy)
so2
17 (Good)
28 (Good)
22 (Good)
41 (Good)
55 (Moderate)
44 (Good)
35 (Good)
27 (Good)
24 (Good)
11 (Good)
16 (Good)
16 (Good)
18 (Good)
20 (Good)
40 (Good)
47 (Good)
57 (Moderate)
42 (Good)
46 (Good)
25 (Good)
data source »
东苑
Friday, May 27, 2022, 12:00 PM
PM10 6.7 (Good)
particulate matter (PM10) suspended dust
PM2,5 1.7 (Good)
particulate matter (PM2.5) dust
CO 100 (Good)
carbon monoxide (CO)
NO2 7.6 (Good)
nitrogen dioxide (NO2)
O3 0.02 (Good)
ozone (O3)
SO2 8.6 (Good)
sulfur dioxide (SO2)
东苑
index
2022-05-27
pm10
32
pm25
24
co
468
no2
21
o3
32
so2
4.6
东苑
2018-10 2020-05

index
2020-05
2020-04
2020-03
2020-02
2020-01
2019-12
2019-11
2019-10
2019-09
2019-08
2019-07
2019-06
2019-05
2019-04
2019-03
2019-02
2019-01
2018-12
2018-11
2018-10
pm25
31
46
44
54
85
68
44
45
30
22
34
27
35
41
60
51
62
41
62
46
co
492
524
613
660
1
1
814
1
698
655
764
636
558
611
676
714
976
720
964
1
no2
17
22
21
16
32
34
28
31
23
17
19
19
19
25
27
25
33
27
38
32
o3
133
123
98
82
75
58
65
97
126
112
165
152
149
121
106
80
70
69
68
87
so2
17
28
22
41
55
44
35
27
24
11
16
16
18
20
40
47
57
42
46
25
pm10
107
99
77
75
109
91
77
84
63
39
55
50
88
136
95
80
108
81
110
83
* Pollution data source:
https://openaq.org
(ChinaAQIData)
The data is licensed under CC-By 4.0
PM10 7 (Good)
PM2,5 2 (Good)
CO 100 (Good)
NO2 8 (Good)
O3 0 (Good)
SO2 9 (Good)
Data on air pollution from recent days in Huadong
| index | 2022-05-27 |
|---|---|
| pm10 | 32 Moderate |
| pm25 | 24 Moderate |
| co | 468 Good |
| no2 | 21 Good |
| o3 | 32 Good |
| so2 | 5 Good |
| index | 2020-05 | 2020-04 | 2020-03 | 2020-02 | 2020-01 | 2019-12 | 2019-11 | 2019-10 | 2019-09 | 2019-08 | 2019-07 | 2019-06 | 2019-05 | 2019-04 | 2019-03 | 2019-02 | 2019-01 | 2018-12 | 2018-11 | 2018-10 |
|---|---|---|---|---|---|---|---|---|---|---|---|---|---|---|---|---|---|---|---|---|
| pm25 | 31 (Moderate) | 46 (Unhealthy for Sensitive Groups) | 44 (Unhealthy for Sensitive Groups) | 54 (Unhealthy for Sensitive Groups) | 85 (Very Unhealthy) | 68 (Unhealthy) | 44 (Unhealthy for Sensitive Groups) | 45 (Unhealthy for Sensitive Groups) | 30 (Moderate) | 22 (Moderate) | 34 (Moderate) | 27 (Moderate) | 35 (Unhealthy for Sensitive Groups) | 41 (Unhealthy for Sensitive Groups) | 60 (Unhealthy) | 51 (Unhealthy for Sensitive Groups) | 62 (Unhealthy) | 41 (Unhealthy for Sensitive Groups) | 62 (Unhealthy) | 46 (Unhealthy for Sensitive Groups) |
| co | 492 (Good) | 524 (Good) | 613 (Good) | 660 (Good) | 1 (Good) | 1 (Good) | 814 (Good) | 1 (Good) | 698 (Good) | 655 (Good) | 764 (Good) | 636 (Good) | 558 (Good) | 611 (Good) | 676 (Good) | 714 (Good) | 976 (Good) | 720 (Good) | 964 (Good) | 1 (Good) |
| no2 | 17 (Good) | 22 (Good) | 21 (Good) | 16 (Good) | 32 (Good) | 34 (Good) | 28 (Good) | 31 (Good) | 23 (Good) | 17 (Good) | 19 (Good) | 19 (Good) | 19 (Good) | 25 (Good) | 27 (Good) | 25 (Good) | 33 (Good) | 27 (Good) | 38 (Good) | 32 (Good) |
| o3 | 133 (Unhealthy for Sensitive Groups) | 123 (Unhealthy for Sensitive Groups) | 98 (Moderate) | 82 (Moderate) | 75 (Moderate) | 58 (Good) | 65 (Good) | 97 (Moderate) | 126 (Unhealthy for Sensitive Groups) | 112 (Moderate) | 165 (Unhealthy) | 152 (Unhealthy) | 149 (Unhealthy for Sensitive Groups) | 121 (Unhealthy for Sensitive Groups) | 106 (Moderate) | 80 (Moderate) | 70 (Good) | 69 (Good) | 68 (Good) | 87 (Moderate) |
| pm10 | 107 (Unhealthy) | 99 (Unhealthy) | 77 (Unhealthy for Sensitive Groups) | 75 (Unhealthy for Sensitive Groups) | 109 (Unhealthy) | 91 (Unhealthy) | 77 (Unhealthy for Sensitive Groups) | 84 (Unhealthy) | 63 (Unhealthy for Sensitive Groups) | 39 (Moderate) | 55 (Unhealthy for Sensitive Groups) | 50 (Moderate) | 88 (Unhealthy) | 136 (Very Unhealthy) | 95 (Unhealthy) | 80 (Unhealthy) | 108 (Unhealthy) | 81 (Unhealthy) | 110 (Very Unhealthy) | 83 (Unhealthy) |
| so2 | 17 (Good) | 28 (Good) | 22 (Good) | 41 (Good) | 55 (Moderate) | 44 (Good) | 35 (Good) | 27 (Good) | 24 (Good) | 11 (Good) | 16 (Good) | 16 (Good) | 18 (Good) | 20 (Good) | 40 (Good) | 47 (Good) | 57 (Moderate) | 42 (Good) | 46 (Good) | 25 (Good) |
PM10 6.7 (Good)
particulate matter (PM10) suspended dustPM2,5 1.7 (Good)
particulate matter (PM2.5) dustCO 100 (Good)
carbon monoxide (CO)NO2 7.6 (Good)
nitrogen dioxide (NO2)O3 0.02 (Good)
ozone (O3)SO2 8.6 (Good)
sulfur dioxide (SO2)东苑
| index | 2022-05-27 |
|---|---|
| pm10 | 32 |
| pm25 | 24 |
| co | 468 |
| no2 | 21 |
| o3 | 32 |
| so2 | 4.6 |
东苑

| index | 2020-05 | 2020-04 | 2020-03 | 2020-02 | 2020-01 | 2019-12 | 2019-11 | 2019-10 | 2019-09 | 2019-08 | 2019-07 | 2019-06 | 2019-05 | 2019-04 | 2019-03 | 2019-02 | 2019-01 | 2018-12 | 2018-11 | 2018-10 |
|---|---|---|---|---|---|---|---|---|---|---|---|---|---|---|---|---|---|---|---|---|
| pm25 | 31 | 46 | 44 | 54 | 85 | 68 | 44 | 45 | 30 | 22 | 34 | 27 | 35 | 41 | 60 | 51 | 62 | 41 | 62 | 46 |
| co | 492 | 524 | 613 | 660 | 1 | 1 | 814 | 1 | 698 | 655 | 764 | 636 | 558 | 611 | 676 | 714 | 976 | 720 | 964 | 1 |
| no2 | 17 | 22 | 21 | 16 | 32 | 34 | 28 | 31 | 23 | 17 | 19 | 19 | 19 | 25 | 27 | 25 | 33 | 27 | 38 | 32 |
| o3 | 133 | 123 | 98 | 82 | 75 | 58 | 65 | 97 | 126 | 112 | 165 | 152 | 149 | 121 | 106 | 80 | 70 | 69 | 68 | 87 |
| so2 | 17 | 28 | 22 | 41 | 55 | 44 | 35 | 27 | 24 | 11 | 16 | 16 | 18 | 20 | 40 | 47 | 57 | 42 | 46 | 25 |
| pm10 | 107 | 99 | 77 | 75 | 109 | 91 | 77 | 84 | 63 | 39 | 55 | 50 | 88 | 136 | 95 | 80 | 108 | 81 | 110 | 83 |