Air Pollution in Shenyangzhan: Real-time Air Quality Index and smog alert.
Pollution and air quality forecast for Shenyangzhan. Today is Saturday, June 20, 2026. The following air pollution values have been recorded for Shenyangzhan:- particulate matter (PM10) suspended dust - 7 (Good)
- particulate matter (PM2.5) dust - 2 (Good)
- carbon monoxide (CO) - 100 (Good)
- nitrogen dioxide (NO2) - 8 (Good)
- ozone (O3) - 0 (Good)
- sulfur dioxide (SO2) - 9 (Good)

What is the air quality in Shenyangzhan today? Is the air polluted in Shenyangzhan?. Is there smog?
What is the level of PM10 today in Shenyangzhan? (particulate matter (PM10) suspended dust)
The current level of particulate matter PM10 in Shenyangzhan is:
7 (Good)
The highest PM10 values usually occur in month: 134 (January 2020).
The lowest value of particulate matter PM10 pollution in Shenyangzhan is usually recorded in: August (33).
What is the current level of PM2.5 in Shenyangzhan? (particulate matter (PM2.5) dust)
Today's PM2.5 level is:
2 (Good)
For comparison, the highest level of PM2.5 in Shenyangzhan in the last 7 days was: 24 (Friday, May 27, 2022) and the lowest: 24 (Friday, May 27, 2022).
The highest PM2.5 values were recorded: 112 (January 2020).
The lowest level of particulate matter PM2.5 pollution occurs in month: August (21).
How high is the CO level? (carbon monoxide (CO))
100 (Good)
How high is the level of NO2? (nitrogen dioxide (NO2))
8 (Good)
How is the O3 level today in Shenyangzhan? (ozone (O3))
0 (Good)
What is the level of SO2 pollution? (sulfur dioxide (SO2))
9 (Good)
Current data Friday, May 27, 2022, 12:00 PM
PM10 7 (Good)
PM2,5 2 (Good)
CO 100 (Good)
NO2 8 (Good)
O3 0 (Good)
SO2 9 (Good)
Data on air pollution from recent days in Shenyangzhan
index
2022-05-27
pm10
32
Moderate
pm25
24
Moderate
co
468
Good
no2
21
Good
o3
32
Good
so2
5
Good
data source »
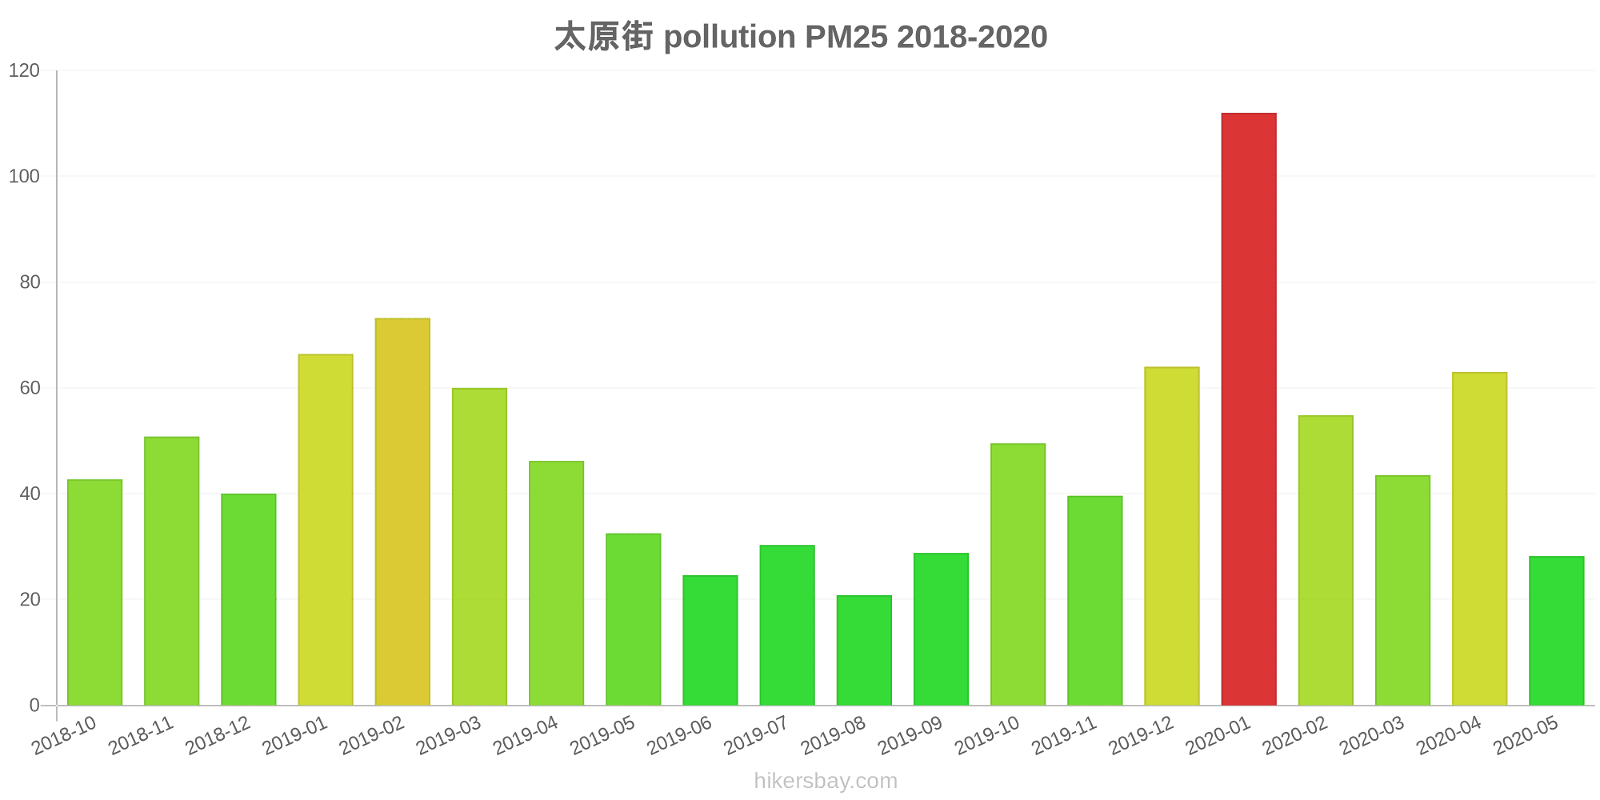
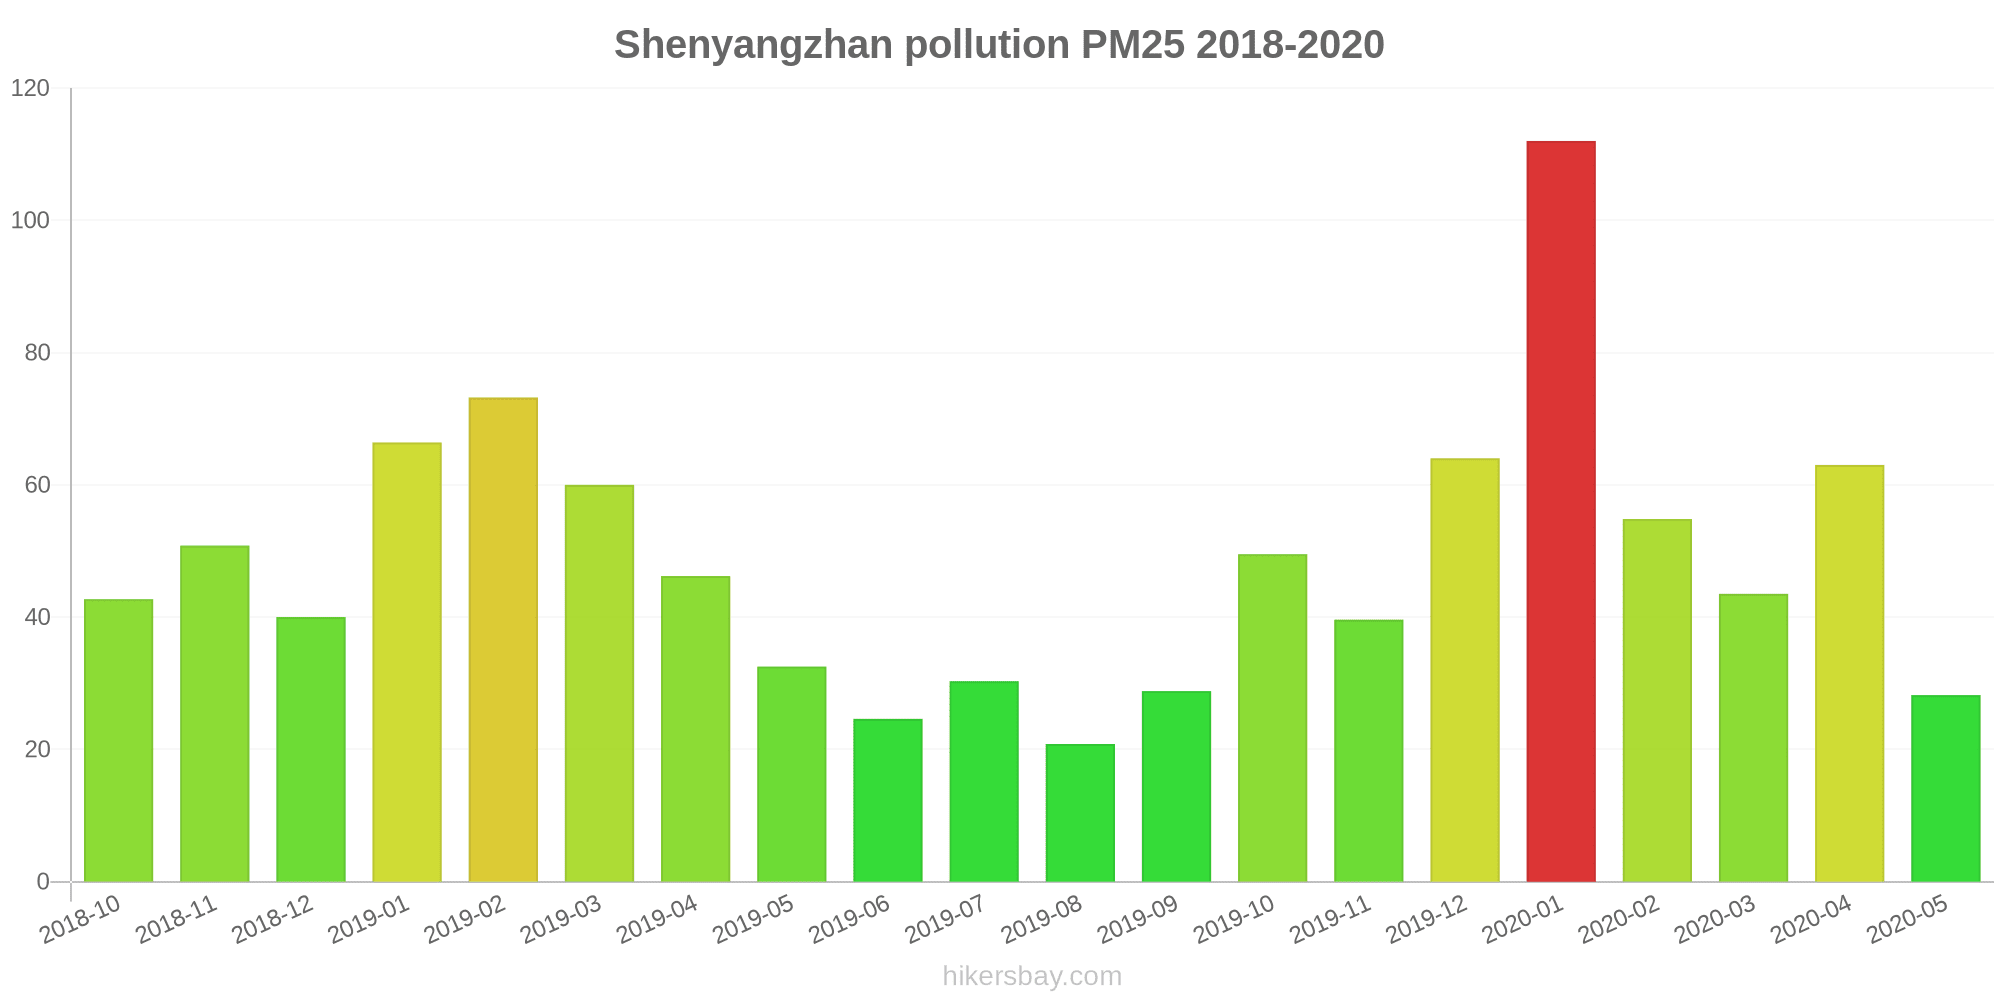
Air pollution in Shenyangzhan from October 2018 to May 2020

index
2020-05
2020-04
2020-03
2020-02
2020-01
2019-12
2019-11
2019-10
2019-09
2019-08
2019-07
2019-06
2019-05
2019-04
2019-03
2019-02
2019-01
2018-12
2018-11
2018-10
pm25
28 (Moderate)
63 (Unhealthy)
44 (Unhealthy for Sensitive Groups)
55 (Unhealthy for Sensitive Groups)
112 (Very bad Hazardous)
64 (Unhealthy)
40 (Unhealthy for Sensitive Groups)
50 (Unhealthy for Sensitive Groups)
29 (Moderate)
21 (Moderate)
30 (Moderate)
25 (Moderate)
33 (Moderate)
46 (Unhealthy for Sensitive Groups)
60 (Unhealthy)
73 (Unhealthy)
66 (Unhealthy)
40 (Unhealthy for Sensitive Groups)
51 (Unhealthy for Sensitive Groups)
43 (Unhealthy for Sensitive Groups)
co
609 (Good)
978 (Good)
731 (Good)
994 (Good)
1 (Good)
1 (Good)
849 (Good)
969 (Good)
888 (Good)
727 (Good)
819 (Good)
703 (Good)
745 (Good)
865 (Good)
1 (Good)
1 (Good)
1 (Good)
961 (Good)
1 (Good)
1 (Good)
no2
33 (Good)
46 (Moderate)
36 (Good)
35 (Good)
64 (Moderate)
54 (Moderate)
47 (Moderate)
51 (Moderate)
43 (Moderate)
27 (Good)
26 (Good)
34 (Good)
34 (Good)
44 (Moderate)
54 (Moderate)
54 (Moderate)
54 (Moderate)
42 (Moderate)
56 (Moderate)
54 (Moderate)
o3
124 (Unhealthy for Sensitive Groups)
125 (Unhealthy for Sensitive Groups)
93 (Moderate)
77 (Moderate)
57 (Good)
41 (Good)
47 (Good)
91 (Moderate)
120 (Unhealthy for Sensitive Groups)
109 (Moderate)
164 (Unhealthy)
143 (Unhealthy for Sensitive Groups)
137 (Unhealthy for Sensitive Groups)
107 (Moderate)
91 (Moderate)
69 (Good)
51 (Good)
47 (Good)
48 (Good)
72 (Moderate)
pm10
69 (Unhealthy for Sensitive Groups)
113 (Very Unhealthy)
70 (Unhealthy for Sensitive Groups)
68 (Unhealthy for Sensitive Groups)
134 (Very Unhealthy)
83 (Unhealthy)
58 (Unhealthy for Sensitive Groups)
88 (Unhealthy)
55 (Unhealthy for Sensitive Groups)
33 (Moderate)
43 (Moderate)
41 (Moderate)
72 (Unhealthy for Sensitive Groups)
101 (Unhealthy)
100 (Unhealthy)
101 (Unhealthy)
110 (Very Unhealthy)
68 (Unhealthy for Sensitive Groups)
83 (Unhealthy)
78 (Unhealthy for Sensitive Groups)
so2
15 (Good)
15 (Good)
15 (Good)
21 (Good)
40 (Good)
36 (Good)
29 (Good)
22 (Good)
20 (Good)
13 (Good)
10 (Good)
15 (Good)
20 (Good)
21 (Good)
28 (Good)
36 (Good)
43 (Good)
36 (Good)
38 (Good)
27 (Good)
data source »
太原街
Friday, May 27, 2022, 12:00 PM
PM10 6.7 (Good)
particulate matter (PM10) suspended dust
PM2,5 1.7 (Good)
particulate matter (PM2.5) dust
CO 100 (Good)
carbon monoxide (CO)
NO2 7.6 (Good)
nitrogen dioxide (NO2)
O3 0.02 (Good)
ozone (O3)
SO2 8.6 (Good)
sulfur dioxide (SO2)
太原街
index
2022-05-27
pm10
32
pm25
24
co
468
no2
21
o3
32
so2
4.6
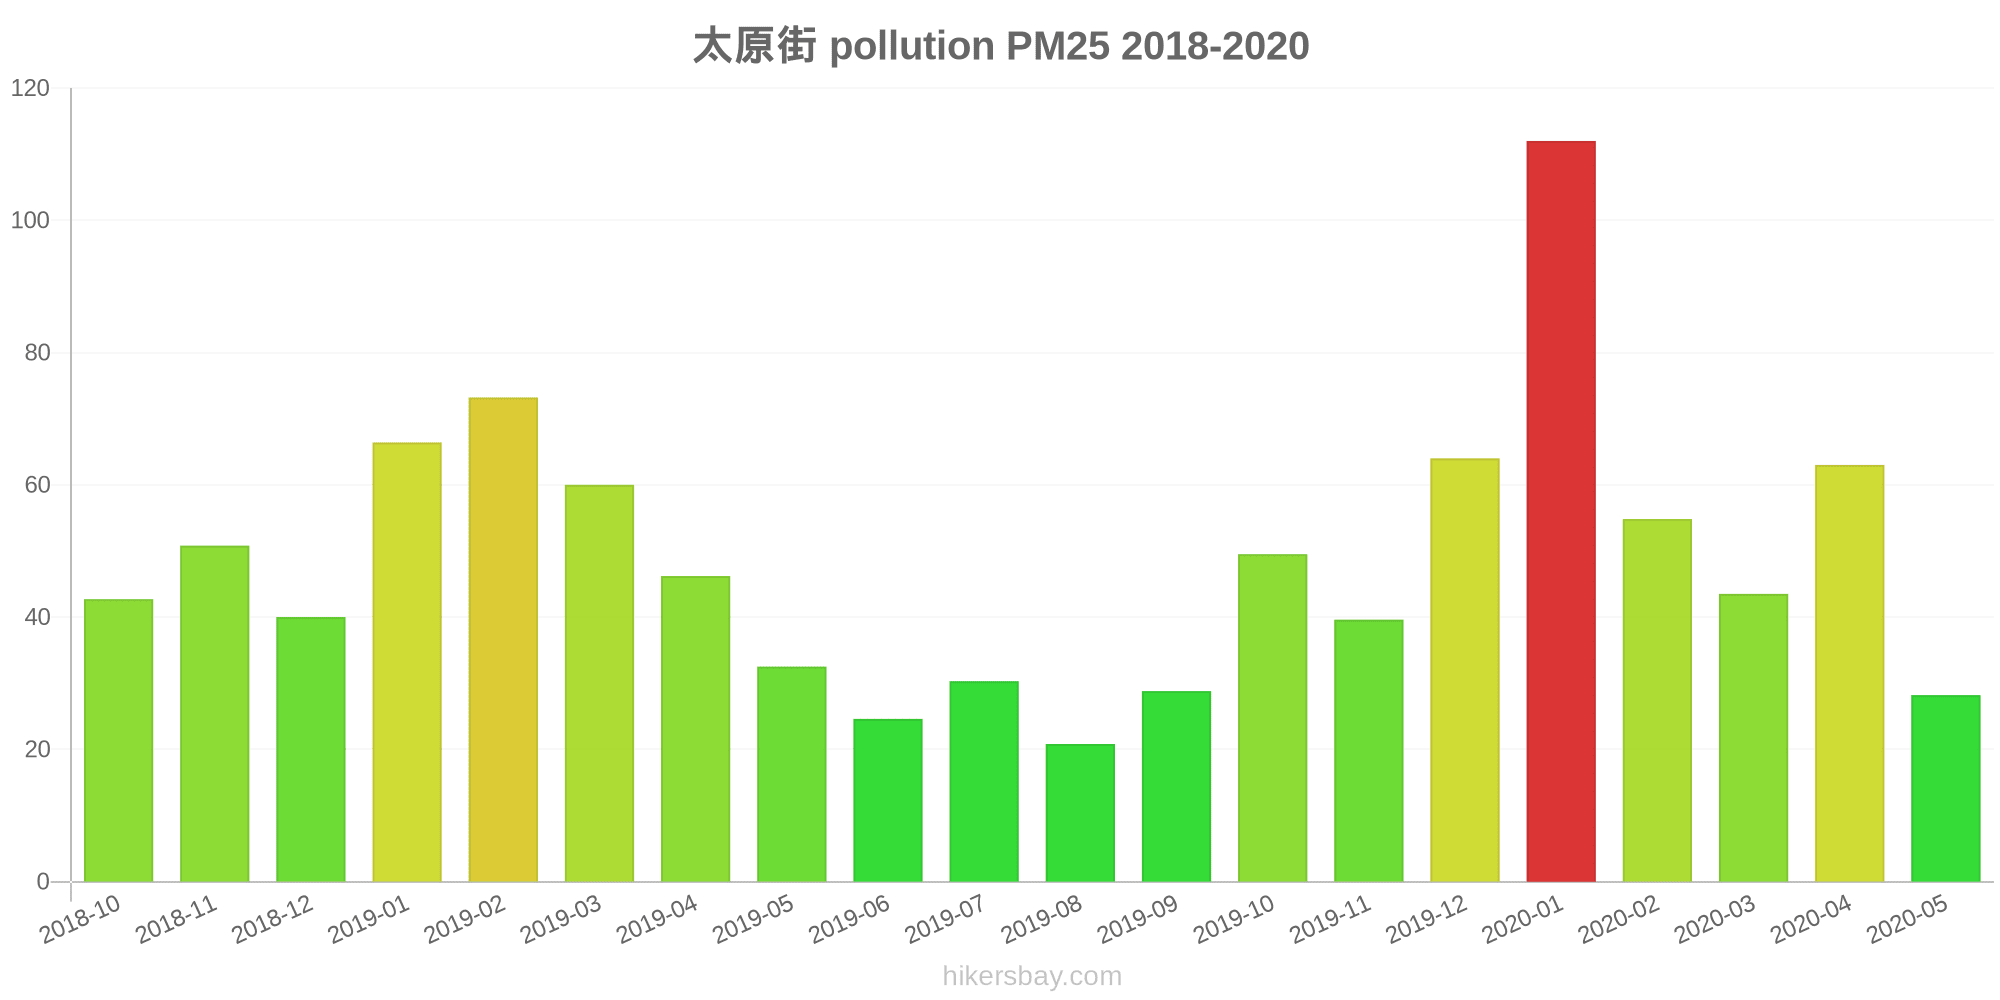
太原街
2018-10 2020-05
index
2020-05
2020-04
2020-03
2020-02
2020-01
2019-12
2019-11
2019-10
2019-09
2019-08
2019-07
2019-06
2019-05
2019-04
2019-03
2019-02
2019-01
2018-12
2018-11
2018-10
pm25
28
63
44
55
112
64
40
50
29
21
30
25
33
46
60
73
66
40
51
43
co
609
978
731
994
1
1
849
969
888
727
819
703
745
865
1
1
1
961
1
1
no2
33
46
36
35
64
54
47
51
43
27
26
34
34
44
54
54
54
42
56
54
o3
124
125
93
77
57
41
47
91
120
109
164
143
137
107
91
69
51
47
48
72
pm10
69
113
70
68
134
83
58
88
55
33
43
41
72
101
100
101
110
68
83
78
so2
15
15
15
21
40
36
29
22
20
13
10
15
20
21
28
36
43
36
38
27
* Pollution data source:
https://openaq.org
(ChinaAQIData)
The data is licensed under CC-By 4.0
PM10 7 (Good)
PM2,5 2 (Good)
CO 100 (Good)
NO2 8 (Good)
O3 0 (Good)
SO2 9 (Good)
Data on air pollution from recent days in Shenyangzhan
| index | 2022-05-27 |
|---|---|
| pm10 | 32 Moderate |
| pm25 | 24 Moderate |
| co | 468 Good |
| no2 | 21 Good |
| o3 | 32 Good |
| so2 | 5 Good |
| index | 2020-05 | 2020-04 | 2020-03 | 2020-02 | 2020-01 | 2019-12 | 2019-11 | 2019-10 | 2019-09 | 2019-08 | 2019-07 | 2019-06 | 2019-05 | 2019-04 | 2019-03 | 2019-02 | 2019-01 | 2018-12 | 2018-11 | 2018-10 |
|---|---|---|---|---|---|---|---|---|---|---|---|---|---|---|---|---|---|---|---|---|
| pm25 | 28 (Moderate) | 63 (Unhealthy) | 44 (Unhealthy for Sensitive Groups) | 55 (Unhealthy for Sensitive Groups) | 112 (Very bad Hazardous) | 64 (Unhealthy) | 40 (Unhealthy for Sensitive Groups) | 50 (Unhealthy for Sensitive Groups) | 29 (Moderate) | 21 (Moderate) | 30 (Moderate) | 25 (Moderate) | 33 (Moderate) | 46 (Unhealthy for Sensitive Groups) | 60 (Unhealthy) | 73 (Unhealthy) | 66 (Unhealthy) | 40 (Unhealthy for Sensitive Groups) | 51 (Unhealthy for Sensitive Groups) | 43 (Unhealthy for Sensitive Groups) |
| co | 609 (Good) | 978 (Good) | 731 (Good) | 994 (Good) | 1 (Good) | 1 (Good) | 849 (Good) | 969 (Good) | 888 (Good) | 727 (Good) | 819 (Good) | 703 (Good) | 745 (Good) | 865 (Good) | 1 (Good) | 1 (Good) | 1 (Good) | 961 (Good) | 1 (Good) | 1 (Good) |
| no2 | 33 (Good) | 46 (Moderate) | 36 (Good) | 35 (Good) | 64 (Moderate) | 54 (Moderate) | 47 (Moderate) | 51 (Moderate) | 43 (Moderate) | 27 (Good) | 26 (Good) | 34 (Good) | 34 (Good) | 44 (Moderate) | 54 (Moderate) | 54 (Moderate) | 54 (Moderate) | 42 (Moderate) | 56 (Moderate) | 54 (Moderate) |
| o3 | 124 (Unhealthy for Sensitive Groups) | 125 (Unhealthy for Sensitive Groups) | 93 (Moderate) | 77 (Moderate) | 57 (Good) | 41 (Good) | 47 (Good) | 91 (Moderate) | 120 (Unhealthy for Sensitive Groups) | 109 (Moderate) | 164 (Unhealthy) | 143 (Unhealthy for Sensitive Groups) | 137 (Unhealthy for Sensitive Groups) | 107 (Moderate) | 91 (Moderate) | 69 (Good) | 51 (Good) | 47 (Good) | 48 (Good) | 72 (Moderate) |
| pm10 | 69 (Unhealthy for Sensitive Groups) | 113 (Very Unhealthy) | 70 (Unhealthy for Sensitive Groups) | 68 (Unhealthy for Sensitive Groups) | 134 (Very Unhealthy) | 83 (Unhealthy) | 58 (Unhealthy for Sensitive Groups) | 88 (Unhealthy) | 55 (Unhealthy for Sensitive Groups) | 33 (Moderate) | 43 (Moderate) | 41 (Moderate) | 72 (Unhealthy for Sensitive Groups) | 101 (Unhealthy) | 100 (Unhealthy) | 101 (Unhealthy) | 110 (Very Unhealthy) | 68 (Unhealthy for Sensitive Groups) | 83 (Unhealthy) | 78 (Unhealthy for Sensitive Groups) |
| so2 | 15 (Good) | 15 (Good) | 15 (Good) | 21 (Good) | 40 (Good) | 36 (Good) | 29 (Good) | 22 (Good) | 20 (Good) | 13 (Good) | 10 (Good) | 15 (Good) | 20 (Good) | 21 (Good) | 28 (Good) | 36 (Good) | 43 (Good) | 36 (Good) | 38 (Good) | 27 (Good) |
PM10 6.7 (Good)
particulate matter (PM10) suspended dustPM2,5 1.7 (Good)
particulate matter (PM2.5) dustCO 100 (Good)
carbon monoxide (CO)NO2 7.6 (Good)
nitrogen dioxide (NO2)O3 0.02 (Good)
ozone (O3)SO2 8.6 (Good)
sulfur dioxide (SO2)太原街
| index | 2022-05-27 |
|---|---|
| pm10 | 32 |
| pm25 | 24 |
| co | 468 |
| no2 | 21 |
| o3 | 32 |
| so2 | 4.6 |
太原街
| index | 2020-05 | 2020-04 | 2020-03 | 2020-02 | 2020-01 | 2019-12 | 2019-11 | 2019-10 | 2019-09 | 2019-08 | 2019-07 | 2019-06 | 2019-05 | 2019-04 | 2019-03 | 2019-02 | 2019-01 | 2018-12 | 2018-11 | 2018-10 |
|---|---|---|---|---|---|---|---|---|---|---|---|---|---|---|---|---|---|---|---|---|
| pm25 | 28 | 63 | 44 | 55 | 112 | 64 | 40 | 50 | 29 | 21 | 30 | 25 | 33 | 46 | 60 | 73 | 66 | 40 | 51 | 43 |
| co | 609 | 978 | 731 | 994 | 1 | 1 | 849 | 969 | 888 | 727 | 819 | 703 | 745 | 865 | 1 | 1 | 1 | 961 | 1 | 1 |
| no2 | 33 | 46 | 36 | 35 | 64 | 54 | 47 | 51 | 43 | 27 | 26 | 34 | 34 | 44 | 54 | 54 | 54 | 42 | 56 | 54 |
| o3 | 124 | 125 | 93 | 77 | 57 | 41 | 47 | 91 | 120 | 109 | 164 | 143 | 137 | 107 | 91 | 69 | 51 | 47 | 48 | 72 |
| pm10 | 69 | 113 | 70 | 68 | 134 | 83 | 58 | 88 | 55 | 33 | 43 | 41 | 72 | 101 | 100 | 101 | 110 | 68 | 83 | 78 |
| so2 | 15 | 15 | 15 | 21 | 40 | 36 | 29 | 22 | 20 | 13 | 10 | 15 | 20 | 21 | 28 | 36 | 43 | 36 | 38 | 27 |