Air Pollution in Luyuan: Real-time Air Quality Index and smog alert.
Pollution and air quality forecast for Luyuan. Today is Tuesday, June 16, 2026. The following air pollution values have been recorded for Luyuan:- particulate matter (PM10) suspended dust - 7 (Good)
- particulate matter (PM2.5) dust - 2 (Good)
- carbon monoxide (CO) - 100 (Good)
- nitrogen dioxide (NO2) - 8 (Good)
- ozone (O3) - 0 (Good)
- sulfur dioxide (SO2) - 9 (Good)

What is the air quality in Luyuan today? Is the air polluted in Luyuan?. Is there smog?
What is the level of PM10 today in Luyuan? (particulate matter (PM10) suspended dust)
The current level of particulate matter PM10 in Luyuan is:
7 (Good)
The highest PM10 values usually occur in month: 110 (January 2019).
The lowest value of particulate matter PM10 pollution in Luyuan is usually recorded in: August (45).
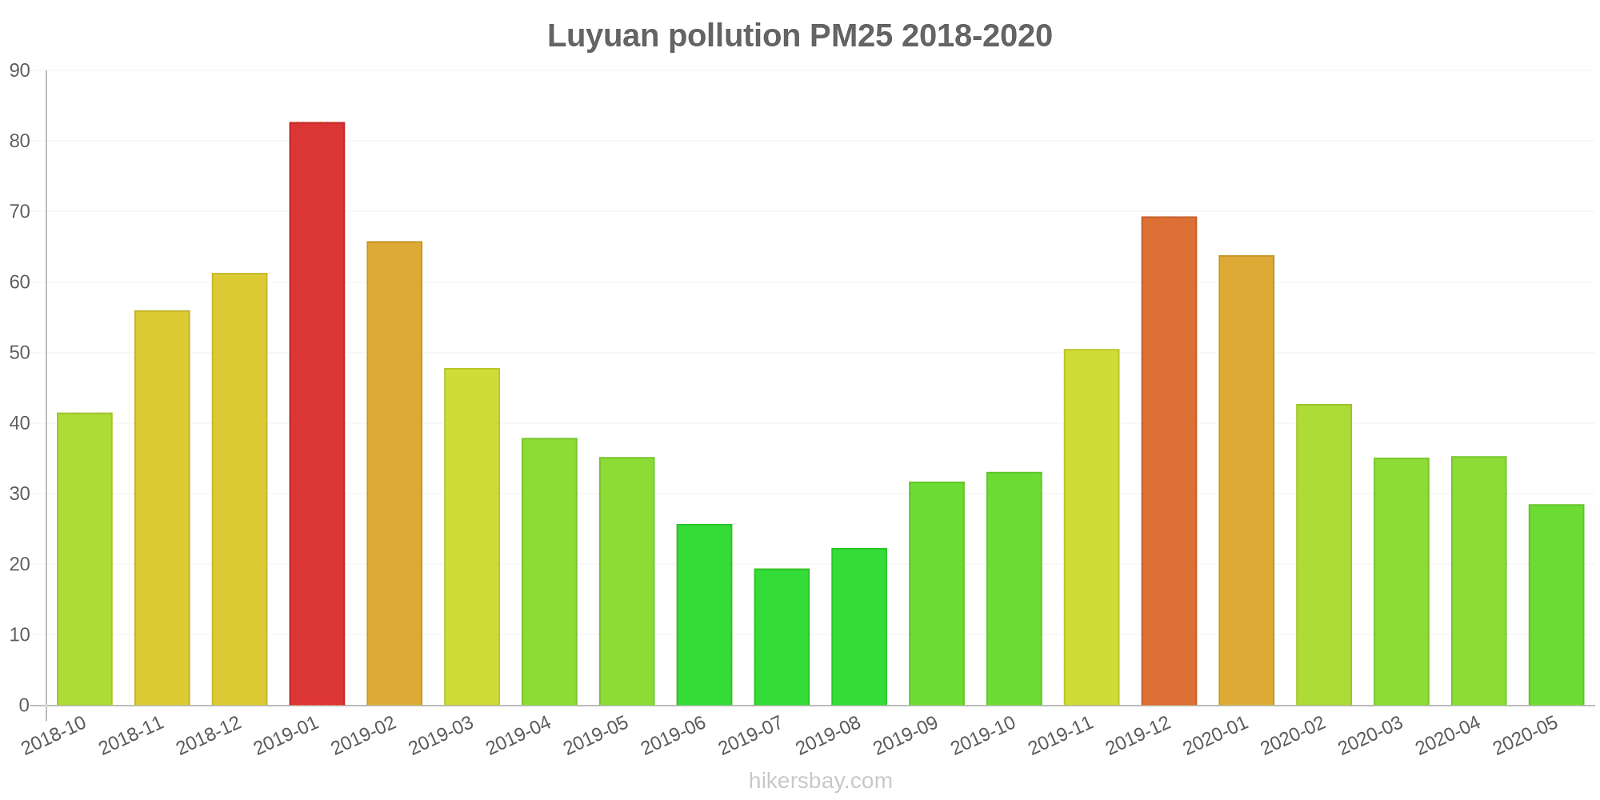
What is the current level of PM2.5 in Luyuan? (particulate matter (PM2.5) dust)
Today's PM2.5 level is:
2 (Good)
For comparison, the highest level of PM2.5 in Luyuan in the last 7 days was: 24 (Friday, May 27, 2022) and the lowest: 24 (Friday, May 27, 2022).
The highest PM2.5 values were recorded: 83 (January 2019).
The lowest level of particulate matter PM2.5 pollution occurs in month: July (19).
How high is the CO level? (carbon monoxide (CO))
100 (Good)
How high is the level of NO2? (nitrogen dioxide (NO2))
8 (Good)
How is the O3 level today in Luyuan? (ozone (O3))
0 (Good)
What is the level of SO2 pollution? (sulfur dioxide (SO2))
9 (Good)
Current data Friday, May 27, 2022, 12:00 PM
PM10 7 (Good)
PM2,5 2 (Good)
CO 100 (Good)
NO2 8 (Good)
O3 0 (Good)
SO2 9 (Good)
Data on air pollution from recent days in Luyuan
index
2022-05-27
pm10
32
Moderate
pm25
24
Moderate
co
468
Good
no2
21
Good
o3
32
Good
so2
5
Good
data source »
Air pollution in Luyuan from October 2018 to May 2020
index
2020-05
2020-04
2020-03
2020-02
2020-01
2019-12
2019-11
2019-10
2019-09
2019-08
2019-07
2019-06
2019-05
2019-04
2019-03
2019-02
2019-01
2018-12
2018-11
2018-10
pm25
29 (Moderate)
35 (Unhealthy for Sensitive Groups)
35 (Unhealthy for Sensitive Groups)
43 (Unhealthy for Sensitive Groups)
64 (Unhealthy)
69 (Unhealthy)
51 (Unhealthy for Sensitive Groups)
33 (Moderate)
32 (Moderate)
22 (Moderate)
19 (Moderate)
26 (Moderate)
35 (Unhealthy for Sensitive Groups)
38 (Unhealthy for Sensitive Groups)
48 (Unhealthy for Sensitive Groups)
66 (Unhealthy)
83 (Very Unhealthy)
61 (Unhealthy)
56 (Unhealthy)
42 (Unhealthy for Sensitive Groups)
co
972 (Good)
858 (Good)
1 (Good)
1 (Good)
1 (Good)
1 (Good)
1 (Good)
1 (Good)
1 (Good)
551 (Good)
363 (Good)
382 (Good)
476 (Good)
943 (Good)
1 (Good)
1 (Good)
1 (Good)
1 (Good)
1 (Good)
931 (Good)
no2
13 (Good)
19 (Good)
12 (Good)
11 (Good)
21 (Good)
43 (Moderate)
34 (Good)
21 (Good)
17 (Good)
8.6 (Good)
9 (Good)
12 (Good)
20 (Good)
18 (Good)
24 (Good)
21 (Good)
30 (Good)
30 (Good)
30 (Good)
27 (Good)
o3
125 (Unhealthy for Sensitive Groups)
137 (Unhealthy for Sensitive Groups)
104 (Moderate)
87 (Moderate)
65 (Good)
64 (Good)
95 (Moderate)
123 (Unhealthy for Sensitive Groups)
176 (Unhealthy)
152 (Unhealthy)
137 (Unhealthy for Sensitive Groups)
165 (Unhealthy)
147 (Unhealthy for Sensitive Groups)
128 (Unhealthy for Sensitive Groups)
111 (Moderate)
66 (Good)
59 (Good)
47 (Good)
95 (Moderate)
115 (Moderate)
pm10
49 (Moderate)
57 (Unhealthy for Sensitive Groups)
53 (Unhealthy for Sensitive Groups)
50 (Moderate)
76 (Unhealthy for Sensitive Groups)
105 (Unhealthy)
94 (Unhealthy)
62 (Unhealthy for Sensitive Groups)
58 (Unhealthy for Sensitive Groups)
45 (Moderate)
48 (Moderate)
47 (Moderate)
71 (Unhealthy for Sensitive Groups)
59 (Unhealthy for Sensitive Groups)
79 (Unhealthy for Sensitive Groups)
86 (Unhealthy)
110 (Very Unhealthy)
90 (Unhealthy)
83 (Unhealthy)
65 (Unhealthy for Sensitive Groups)
so2
7 (Good)
8.3 (Good)
6.2 (Good)
6 (Good)
6.2 (Good)
10 (Good)
9 (Good)
7.1 (Good)
9 (Good)
6.6 (Good)
5.2 (Good)
6 (Good)
8 (Good)
6.3 (Good)
6.9 (Good)
7.6 (Good)
11 (Good)
12 (Good)
11 (Good)
11 (Good)
data source »
文化路
Friday, May 27, 2022, 12:00 PM
PM10 6.7 (Good)
particulate matter (PM10) suspended dust
PM2,5 1.7 (Good)
particulate matter (PM2.5) dust
CO 100 (Good)
carbon monoxide (CO)
NO2 7.6 (Good)
nitrogen dioxide (NO2)
O3 0.02 (Good)
ozone (O3)
SO2 8.6 (Good)
sulfur dioxide (SO2)
文化路
index
2022-05-27
pm10
32
pm25
24
co
468
no2
21
o3
32
so2
4.6
文化路
2018-10 2020-05

index
2020-05
2020-04
2020-03
2020-02
2020-01
2019-12
2019-11
2019-10
2019-09
2019-08
2019-07
2019-06
2019-05
2019-04
2019-03
2019-02
2019-01
2018-12
2018-11
2018-10
pm25
29
35
35
43
64
69
51
33
32
22
19
26
35
38
48
66
83
61
56
42
co
972
858
1
1
1
1
1
1
1
551
363
382
476
943
1
1
1
1
1
931
no2
13
19
12
11
21
43
34
21
17
8.6
9
12
20
18
24
21
30
30
30
27
o3
125
137
104
87
65
64
95
123
176
152
137
165
147
128
111
66
59
47
95
115
pm10
49
57
53
50
76
105
94
62
58
45
48
47
71
59
79
86
110
90
83
65
so2
7
8.3
6.2
6
6.2
10
9
7.1
9
6.6
5.2
6
8
6.3
6.9
7.6
11
12
11
11
* Pollution data source:
https://openaq.org
(ChinaAQIData)
The data is licensed under CC-By 4.0
PM10 7 (Good)
PM2,5 2 (Good)
CO 100 (Good)
NO2 8 (Good)
O3 0 (Good)
SO2 9 (Good)
Data on air pollution from recent days in Luyuan
| index | 2022-05-27 |
|---|---|
| pm10 | 32 Moderate |
| pm25 | 24 Moderate |
| co | 468 Good |
| no2 | 21 Good |
| o3 | 32 Good |
| so2 | 5 Good |

| index | 2020-05 | 2020-04 | 2020-03 | 2020-02 | 2020-01 | 2019-12 | 2019-11 | 2019-10 | 2019-09 | 2019-08 | 2019-07 | 2019-06 | 2019-05 | 2019-04 | 2019-03 | 2019-02 | 2019-01 | 2018-12 | 2018-11 | 2018-10 |
|---|---|---|---|---|---|---|---|---|---|---|---|---|---|---|---|---|---|---|---|---|
| pm25 | 29 (Moderate) | 35 (Unhealthy for Sensitive Groups) | 35 (Unhealthy for Sensitive Groups) | 43 (Unhealthy for Sensitive Groups) | 64 (Unhealthy) | 69 (Unhealthy) | 51 (Unhealthy for Sensitive Groups) | 33 (Moderate) | 32 (Moderate) | 22 (Moderate) | 19 (Moderate) | 26 (Moderate) | 35 (Unhealthy for Sensitive Groups) | 38 (Unhealthy for Sensitive Groups) | 48 (Unhealthy for Sensitive Groups) | 66 (Unhealthy) | 83 (Very Unhealthy) | 61 (Unhealthy) | 56 (Unhealthy) | 42 (Unhealthy for Sensitive Groups) |
| co | 972 (Good) | 858 (Good) | 1 (Good) | 1 (Good) | 1 (Good) | 1 (Good) | 1 (Good) | 1 (Good) | 1 (Good) | 551 (Good) | 363 (Good) | 382 (Good) | 476 (Good) | 943 (Good) | 1 (Good) | 1 (Good) | 1 (Good) | 1 (Good) | 1 (Good) | 931 (Good) |
| no2 | 13 (Good) | 19 (Good) | 12 (Good) | 11 (Good) | 21 (Good) | 43 (Moderate) | 34 (Good) | 21 (Good) | 17 (Good) | 8.6 (Good) | 9 (Good) | 12 (Good) | 20 (Good) | 18 (Good) | 24 (Good) | 21 (Good) | 30 (Good) | 30 (Good) | 30 (Good) | 27 (Good) |
| o3 | 125 (Unhealthy for Sensitive Groups) | 137 (Unhealthy for Sensitive Groups) | 104 (Moderate) | 87 (Moderate) | 65 (Good) | 64 (Good) | 95 (Moderate) | 123 (Unhealthy for Sensitive Groups) | 176 (Unhealthy) | 152 (Unhealthy) | 137 (Unhealthy for Sensitive Groups) | 165 (Unhealthy) | 147 (Unhealthy for Sensitive Groups) | 128 (Unhealthy for Sensitive Groups) | 111 (Moderate) | 66 (Good) | 59 (Good) | 47 (Good) | 95 (Moderate) | 115 (Moderate) |
| pm10 | 49 (Moderate) | 57 (Unhealthy for Sensitive Groups) | 53 (Unhealthy for Sensitive Groups) | 50 (Moderate) | 76 (Unhealthy for Sensitive Groups) | 105 (Unhealthy) | 94 (Unhealthy) | 62 (Unhealthy for Sensitive Groups) | 58 (Unhealthy for Sensitive Groups) | 45 (Moderate) | 48 (Moderate) | 47 (Moderate) | 71 (Unhealthy for Sensitive Groups) | 59 (Unhealthy for Sensitive Groups) | 79 (Unhealthy for Sensitive Groups) | 86 (Unhealthy) | 110 (Very Unhealthy) | 90 (Unhealthy) | 83 (Unhealthy) | 65 (Unhealthy for Sensitive Groups) |
| so2 | 7 (Good) | 8.3 (Good) | 6.2 (Good) | 6 (Good) | 6.2 (Good) | 10 (Good) | 9 (Good) | 7.1 (Good) | 9 (Good) | 6.6 (Good) | 5.2 (Good) | 6 (Good) | 8 (Good) | 6.3 (Good) | 6.9 (Good) | 7.6 (Good) | 11 (Good) | 12 (Good) | 11 (Good) | 11 (Good) |
PM10 6.7 (Good)
particulate matter (PM10) suspended dustPM2,5 1.7 (Good)
particulate matter (PM2.5) dustCO 100 (Good)
carbon monoxide (CO)NO2 7.6 (Good)
nitrogen dioxide (NO2)O3 0.02 (Good)
ozone (O3)SO2 8.6 (Good)
sulfur dioxide (SO2)文化路
| index | 2022-05-27 |
|---|---|
| pm10 | 32 |
| pm25 | 24 |
| co | 468 |
| no2 | 21 |
| o3 | 32 |
| so2 | 4.6 |
文化路

| index | 2020-05 | 2020-04 | 2020-03 | 2020-02 | 2020-01 | 2019-12 | 2019-11 | 2019-10 | 2019-09 | 2019-08 | 2019-07 | 2019-06 | 2019-05 | 2019-04 | 2019-03 | 2019-02 | 2019-01 | 2018-12 | 2018-11 | 2018-10 |
|---|---|---|---|---|---|---|---|---|---|---|---|---|---|---|---|---|---|---|---|---|
| pm25 | 29 | 35 | 35 | 43 | 64 | 69 | 51 | 33 | 32 | 22 | 19 | 26 | 35 | 38 | 48 | 66 | 83 | 61 | 56 | 42 |
| co | 972 | 858 | 1 | 1 | 1 | 1 | 1 | 1 | 1 | 551 | 363 | 382 | 476 | 943 | 1 | 1 | 1 | 1 | 1 | 931 |
| no2 | 13 | 19 | 12 | 11 | 21 | 43 | 34 | 21 | 17 | 8.6 | 9 | 12 | 20 | 18 | 24 | 21 | 30 | 30 | 30 | 27 |
| o3 | 125 | 137 | 104 | 87 | 65 | 64 | 95 | 123 | 176 | 152 | 137 | 165 | 147 | 128 | 111 | 66 | 59 | 47 | 95 | 115 |
| pm10 | 49 | 57 | 53 | 50 | 76 | 105 | 94 | 62 | 58 | 45 | 48 | 47 | 71 | 59 | 79 | 86 | 110 | 90 | 83 | 65 |
| so2 | 7 | 8.3 | 6.2 | 6 | 6.2 | 10 | 9 | 7.1 | 9 | 6.6 | 5.2 | 6 | 8 | 6.3 | 6.9 | 7.6 | 11 | 12 | 11 | 11 |