Air Pollution in Lingxi: Real-time Air Quality Index and smog alert.
Pollution and air quality forecast for Lingxi. Today is Tuesday, June 16, 2026. The following air pollution values have been recorded for Lingxi:- particulate matter (PM10) suspended dust - 7 (Good)
- particulate matter (PM2.5) dust - 2 (Good)
- carbon monoxide (CO) - 100 (Good)
- nitrogen dioxide (NO2) - 8 (Good)
- ozone (O3) - 0 (Good)
- sulfur dioxide (SO2) - 9 (Good)

What is the air quality in Lingxi today? Is the air polluted in Lingxi?. Is there smog?
What is the level of PM10 today in Lingxi? (particulate matter (PM10) suspended dust)
The current level of particulate matter PM10 in Lingxi is:
7 (Good)
The highest PM10 values usually occur in month: 139 (January 2020).
The lowest value of particulate matter PM10 pollution in Lingxi is usually recorded in: August (31).
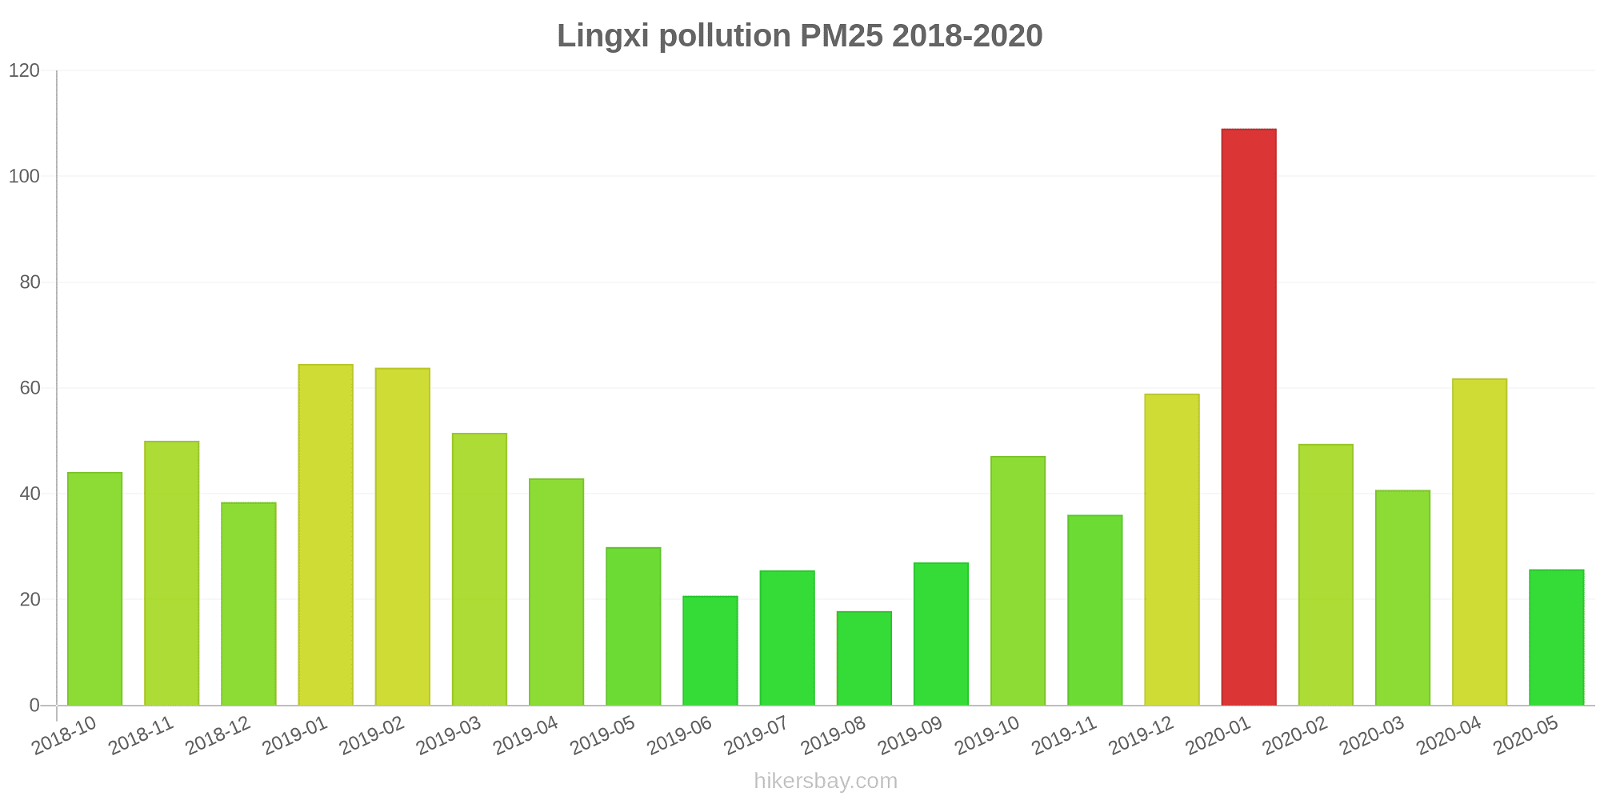
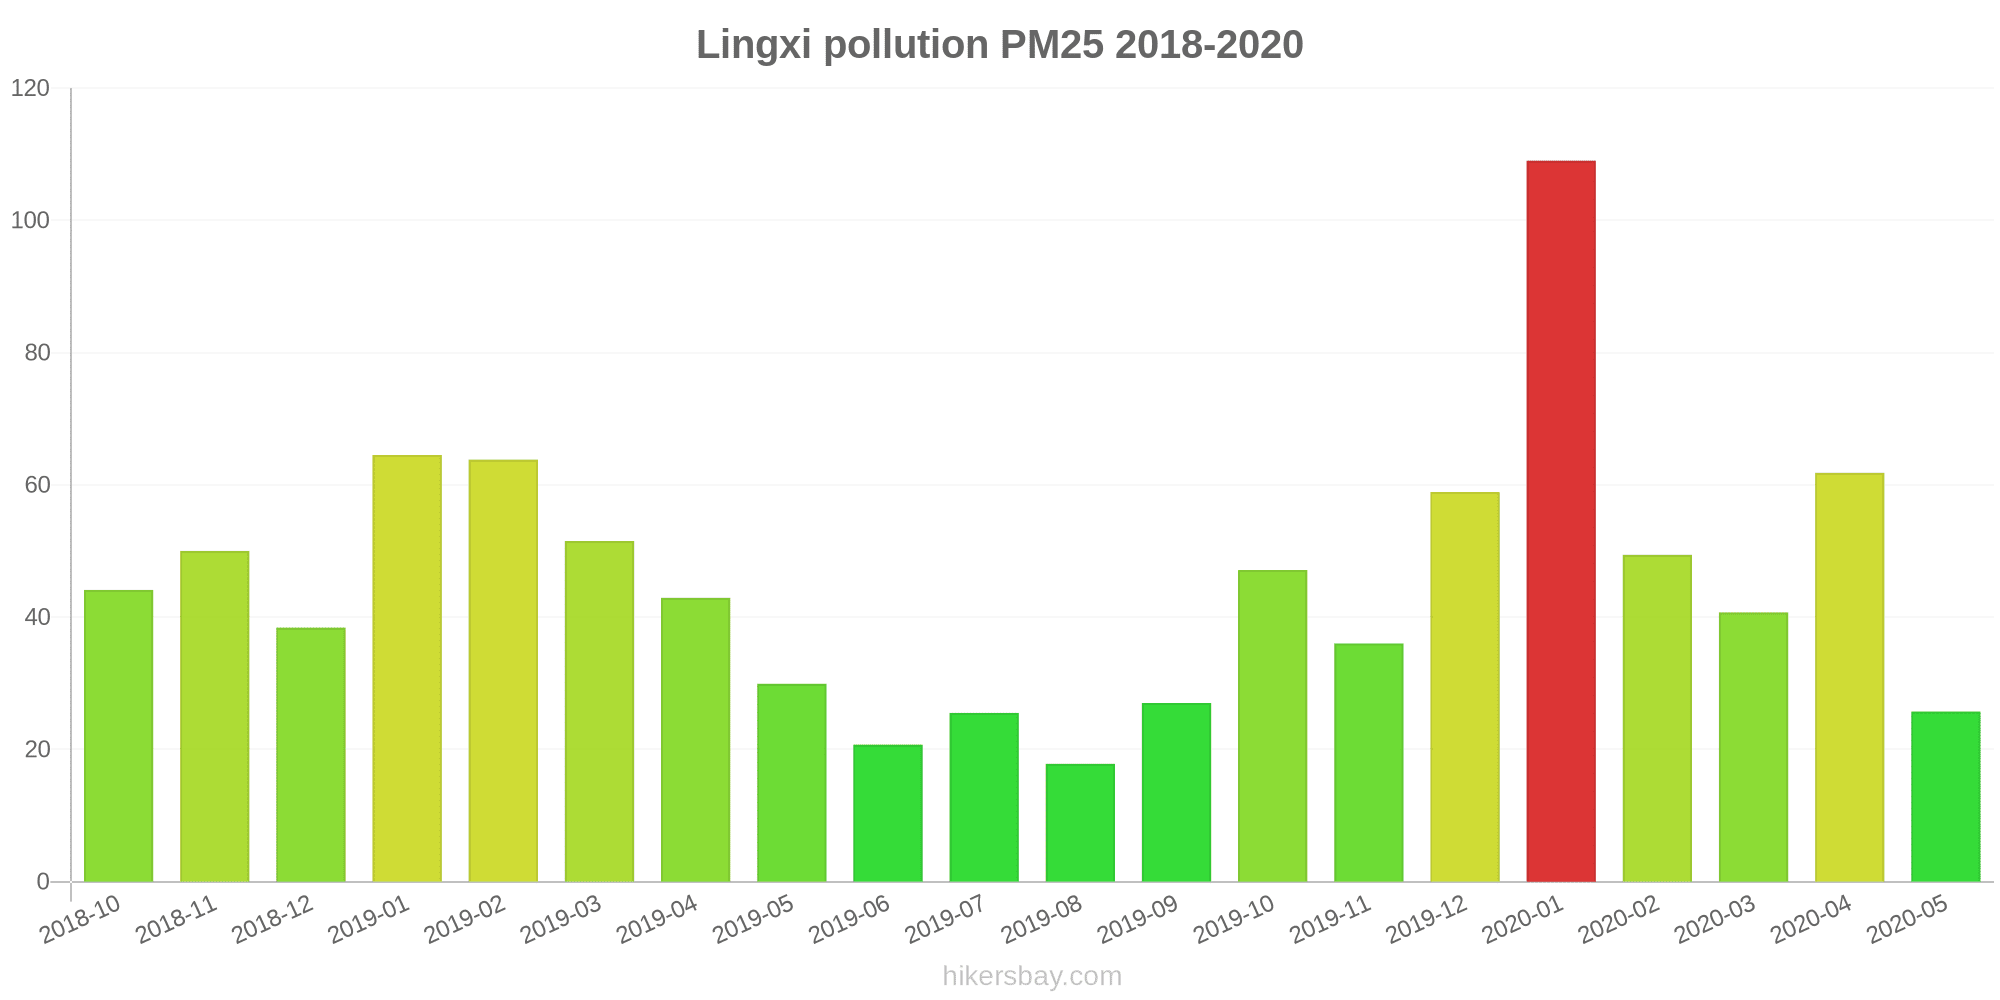
What is the current level of PM2.5 in Lingxi? (particulate matter (PM2.5) dust)
Today's PM2.5 level is:
2 (Good)
For comparison, the highest level of PM2.5 in Lingxi in the last 7 days was: 24 (Friday, May 27, 2022) and the lowest: 24 (Friday, May 27, 2022).
The highest PM2.5 values were recorded: 109 (January 2020).
The lowest level of particulate matter PM2.5 pollution occurs in month: August (18).
How high is the CO level? (carbon monoxide (CO))
100 (Good)
How high is the level of NO2? (nitrogen dioxide (NO2))
8 (Good)
How is the O3 level today in Lingxi? (ozone (O3))
0 (Good)
What is the level of SO2 pollution? (sulfur dioxide (SO2))
9 (Good)
Current data Friday, May 27, 2022, 12:00 PM
PM10 7 (Good)
PM2,5 2 (Good)
CO 100 (Good)
NO2 8 (Good)
O3 0 (Good)
SO2 9 (Good)
Data on air pollution from recent days in Lingxi
index
2022-05-27
pm10
32
Moderate
pm25
24
Moderate
co
468
Good
no2
21
Good
o3
32
Good
so2
5
Good
data source »
Air pollution in Lingxi from October 2018 to May 2020
index
2020-05
2020-04
2020-03
2020-02
2020-01
2019-12
2019-11
2019-10
2019-09
2019-08
2019-07
2019-06
2019-05
2019-04
2019-03
2019-02
2019-01
2018-12
2018-11
2018-10
pm25
26 (Moderate)
62 (Unhealthy)
41 (Unhealthy for Sensitive Groups)
49 (Unhealthy for Sensitive Groups)
109 (Very Unhealthy)
59 (Unhealthy)
36 (Unhealthy for Sensitive Groups)
47 (Unhealthy for Sensitive Groups)
27 (Moderate)
18 (Moderate)
26 (Moderate)
21 (Moderate)
30 (Moderate)
43 (Unhealthy for Sensitive Groups)
52 (Unhealthy for Sensitive Groups)
64 (Unhealthy)
65 (Unhealthy)
38 (Unhealthy for Sensitive Groups)
50 (Unhealthy for Sensitive Groups)
44 (Unhealthy for Sensitive Groups)
co
745 (Good)
965 (Good)
789 (Good)
1 (Good)
1 (Good)
1 (Good)
1 (Good)
1 (Good)
1 (Good)
840 (Good)
893 (Good)
788 (Good)
759 (Good)
849 (Good)
1 (Good)
1 (Good)
1 (Good)
1 (Good)
1 (Good)
1 (Good)
no2
30 (Good)
44 (Moderate)
34 (Good)
35 (Good)
62 (Moderate)
53 (Moderate)
44 (Moderate)
43 (Moderate)
36 (Good)
25 (Good)
24 (Good)
31 (Good)
26 (Good)
40 (Good)
43 (Moderate)
50 (Moderate)
55 (Moderate)
46 (Moderate)
54 (Moderate)
51 (Moderate)
o3
133 (Unhealthy for Sensitive Groups)
136 (Unhealthy for Sensitive Groups)
99 (Moderate)
82 (Moderate)
64 (Good)
50 (Good)
55 (Good)
99 (Moderate)
123 (Unhealthy for Sensitive Groups)
108 (Moderate)
159 (Unhealthy)
146 (Unhealthy for Sensitive Groups)
151 (Unhealthy)
113 (Moderate)
106 (Moderate)
79 (Moderate)
53 (Good)
53 (Good)
58 (Good)
80 (Moderate)
pm10
71 (Unhealthy for Sensitive Groups)
120 (Very Unhealthy)
69 (Unhealthy for Sensitive Groups)
74 (Unhealthy for Sensitive Groups)
139 (Very Unhealthy)
83 (Unhealthy)
66 (Unhealthy for Sensitive Groups)
85 (Unhealthy)
50 (Unhealthy for Sensitive Groups)
31 (Moderate)
39 (Moderate)
38 (Moderate)
80 (Unhealthy for Sensitive Groups)
113 (Very Unhealthy)
102 (Unhealthy)
99 (Unhealthy)
117 (Very Unhealthy)
72 (Unhealthy for Sensitive Groups)
97 (Unhealthy)
85 (Unhealthy)
so2
18 (Good)
19 (Good)
19 (Good)
22 (Good)
34 (Good)
29 (Good)
27 (Good)
18 (Good)
15 (Good)
11 (Good)
8.2 (Good)
13 (Good)
18 (Good)
18 (Good)
24 (Good)
34 (Good)
36 (Good)
28 (Good)
29 (Good)
20 (Good)
data source »
陵东街
Friday, May 27, 2022, 12:00 PM
PM10 6.7 (Good)
particulate matter (PM10) suspended dust
PM2,5 1.7 (Good)
particulate matter (PM2.5) dust
CO 100 (Good)
carbon monoxide (CO)
NO2 7.6 (Good)
nitrogen dioxide (NO2)
O3 0.02 (Good)
ozone (O3)
SO2 8.6 (Good)
sulfur dioxide (SO2)
陵东街
index
2022-05-27
pm10
32
pm25
24
co
468
no2
21
o3
32
so2
4.6
陵东街
2018-10 2020-05

index
2020-05
2020-04
2020-03
2020-02
2020-01
2019-12
2019-11
2019-10
2019-09
2019-08
2019-07
2019-06
2019-05
2019-04
2019-03
2019-02
2019-01
2018-12
2018-11
2018-10
pm25
26
62
41
49
109
59
36
47
27
18
26
21
30
43
52
64
65
38
50
44
co
745
965
789
1
1
1
1
1
1
840
893
788
759
849
1
1
1
1
1
1
no2
30
44
34
35
62
53
44
43
36
25
24
31
26
40
43
50
55
46
54
51
o3
133
136
99
82
64
50
55
99
123
108
159
146
151
113
106
79
53
53
58
80
pm10
71
120
69
74
139
83
66
85
50
31
39
38
80
113
102
99
117
72
97
85
so2
18
19
19
22
34
29
27
18
15
11
8.2
13
18
18
24
34
36
28
29
20
* Pollution data source:
https://openaq.org
(ChinaAQIData)
The data is licensed under CC-By 4.0
PM10 7 (Good)
PM2,5 2 (Good)
CO 100 (Good)
NO2 8 (Good)
O3 0 (Good)
SO2 9 (Good)
Data on air pollution from recent days in Lingxi
| index | 2022-05-27 |
|---|---|
| pm10 | 32 Moderate |
| pm25 | 24 Moderate |
| co | 468 Good |
| no2 | 21 Good |
| o3 | 32 Good |
| so2 | 5 Good |
| index | 2020-05 | 2020-04 | 2020-03 | 2020-02 | 2020-01 | 2019-12 | 2019-11 | 2019-10 | 2019-09 | 2019-08 | 2019-07 | 2019-06 | 2019-05 | 2019-04 | 2019-03 | 2019-02 | 2019-01 | 2018-12 | 2018-11 | 2018-10 |
|---|---|---|---|---|---|---|---|---|---|---|---|---|---|---|---|---|---|---|---|---|
| pm25 | 26 (Moderate) | 62 (Unhealthy) | 41 (Unhealthy for Sensitive Groups) | 49 (Unhealthy for Sensitive Groups) | 109 (Very Unhealthy) | 59 (Unhealthy) | 36 (Unhealthy for Sensitive Groups) | 47 (Unhealthy for Sensitive Groups) | 27 (Moderate) | 18 (Moderate) | 26 (Moderate) | 21 (Moderate) | 30 (Moderate) | 43 (Unhealthy for Sensitive Groups) | 52 (Unhealthy for Sensitive Groups) | 64 (Unhealthy) | 65 (Unhealthy) | 38 (Unhealthy for Sensitive Groups) | 50 (Unhealthy for Sensitive Groups) | 44 (Unhealthy for Sensitive Groups) |
| co | 745 (Good) | 965 (Good) | 789 (Good) | 1 (Good) | 1 (Good) | 1 (Good) | 1 (Good) | 1 (Good) | 1 (Good) | 840 (Good) | 893 (Good) | 788 (Good) | 759 (Good) | 849 (Good) | 1 (Good) | 1 (Good) | 1 (Good) | 1 (Good) | 1 (Good) | 1 (Good) |
| no2 | 30 (Good) | 44 (Moderate) | 34 (Good) | 35 (Good) | 62 (Moderate) | 53 (Moderate) | 44 (Moderate) | 43 (Moderate) | 36 (Good) | 25 (Good) | 24 (Good) | 31 (Good) | 26 (Good) | 40 (Good) | 43 (Moderate) | 50 (Moderate) | 55 (Moderate) | 46 (Moderate) | 54 (Moderate) | 51 (Moderate) |
| o3 | 133 (Unhealthy for Sensitive Groups) | 136 (Unhealthy for Sensitive Groups) | 99 (Moderate) | 82 (Moderate) | 64 (Good) | 50 (Good) | 55 (Good) | 99 (Moderate) | 123 (Unhealthy for Sensitive Groups) | 108 (Moderate) | 159 (Unhealthy) | 146 (Unhealthy for Sensitive Groups) | 151 (Unhealthy) | 113 (Moderate) | 106 (Moderate) | 79 (Moderate) | 53 (Good) | 53 (Good) | 58 (Good) | 80 (Moderate) |
| pm10 | 71 (Unhealthy for Sensitive Groups) | 120 (Very Unhealthy) | 69 (Unhealthy for Sensitive Groups) | 74 (Unhealthy for Sensitive Groups) | 139 (Very Unhealthy) | 83 (Unhealthy) | 66 (Unhealthy for Sensitive Groups) | 85 (Unhealthy) | 50 (Unhealthy for Sensitive Groups) | 31 (Moderate) | 39 (Moderate) | 38 (Moderate) | 80 (Unhealthy for Sensitive Groups) | 113 (Very Unhealthy) | 102 (Unhealthy) | 99 (Unhealthy) | 117 (Very Unhealthy) | 72 (Unhealthy for Sensitive Groups) | 97 (Unhealthy) | 85 (Unhealthy) |
| so2 | 18 (Good) | 19 (Good) | 19 (Good) | 22 (Good) | 34 (Good) | 29 (Good) | 27 (Good) | 18 (Good) | 15 (Good) | 11 (Good) | 8.2 (Good) | 13 (Good) | 18 (Good) | 18 (Good) | 24 (Good) | 34 (Good) | 36 (Good) | 28 (Good) | 29 (Good) | 20 (Good) |
PM10 6.7 (Good)
particulate matter (PM10) suspended dustPM2,5 1.7 (Good)
particulate matter (PM2.5) dustCO 100 (Good)
carbon monoxide (CO)NO2 7.6 (Good)
nitrogen dioxide (NO2)O3 0.02 (Good)
ozone (O3)SO2 8.6 (Good)
sulfur dioxide (SO2)陵东街
| index | 2022-05-27 |
|---|---|
| pm10 | 32 |
| pm25 | 24 |
| co | 468 |
| no2 | 21 |
| o3 | 32 |
| so2 | 4.6 |
陵东街

| index | 2020-05 | 2020-04 | 2020-03 | 2020-02 | 2020-01 | 2019-12 | 2019-11 | 2019-10 | 2019-09 | 2019-08 | 2019-07 | 2019-06 | 2019-05 | 2019-04 | 2019-03 | 2019-02 | 2019-01 | 2018-12 | 2018-11 | 2018-10 |
|---|---|---|---|---|---|---|---|---|---|---|---|---|---|---|---|---|---|---|---|---|
| pm25 | 26 | 62 | 41 | 49 | 109 | 59 | 36 | 47 | 27 | 18 | 26 | 21 | 30 | 43 | 52 | 64 | 65 | 38 | 50 | 44 |
| co | 745 | 965 | 789 | 1 | 1 | 1 | 1 | 1 | 1 | 840 | 893 | 788 | 759 | 849 | 1 | 1 | 1 | 1 | 1 | 1 |
| no2 | 30 | 44 | 34 | 35 | 62 | 53 | 44 | 43 | 36 | 25 | 24 | 31 | 26 | 40 | 43 | 50 | 55 | 46 | 54 | 51 |
| o3 | 133 | 136 | 99 | 82 | 64 | 50 | 55 | 99 | 123 | 108 | 159 | 146 | 151 | 113 | 106 | 79 | 53 | 53 | 58 | 80 |
| pm10 | 71 | 120 | 69 | 74 | 139 | 83 | 66 | 85 | 50 | 31 | 39 | 38 | 80 | 113 | 102 | 99 | 117 | 72 | 97 | 85 |
| so2 | 18 | 19 | 19 | 22 | 34 | 29 | 27 | 18 | 15 | 11 | 8.2 | 13 | 18 | 18 | 24 | 34 | 36 | 28 | 29 | 20 |