Air Pollution in Beizhan: Real-time Air Quality Index and smog alert.
Pollution and air quality forecast for Beizhan. Today is Tuesday, June 16, 2026. The following air pollution values have been recorded for Beizhan:- particulate matter (PM10) suspended dust - 7 (Good)
- particulate matter (PM2.5) dust - 2 (Good)
- carbon monoxide (CO) - 100 (Good)
- nitrogen dioxide (NO2) - 8 (Good)
- ozone (O3) - 0 (Good)
- sulfur dioxide (SO2) - 9 (Good)

What is the air quality in Beizhan today? Is the air polluted in Beizhan?. Is there smog?
What is the level of PM10 today in Beizhan? (particulate matter (PM10) suspended dust)
The current level of particulate matter PM10 in Beizhan is:
7 (Good)
The highest PM10 values usually occur in month: 158 (January 2019).
The lowest value of particulate matter PM10 pollution in Beizhan is usually recorded in: August (38).
What is the current level of PM2.5 in Beizhan? (particulate matter (PM2.5) dust)
Today's PM2.5 level is:
2 (Good)
For comparison, the highest level of PM2.5 in Beizhan in the last 7 days was: 24 (Friday, May 27, 2022) and the lowest: 24 (Friday, May 27, 2022).
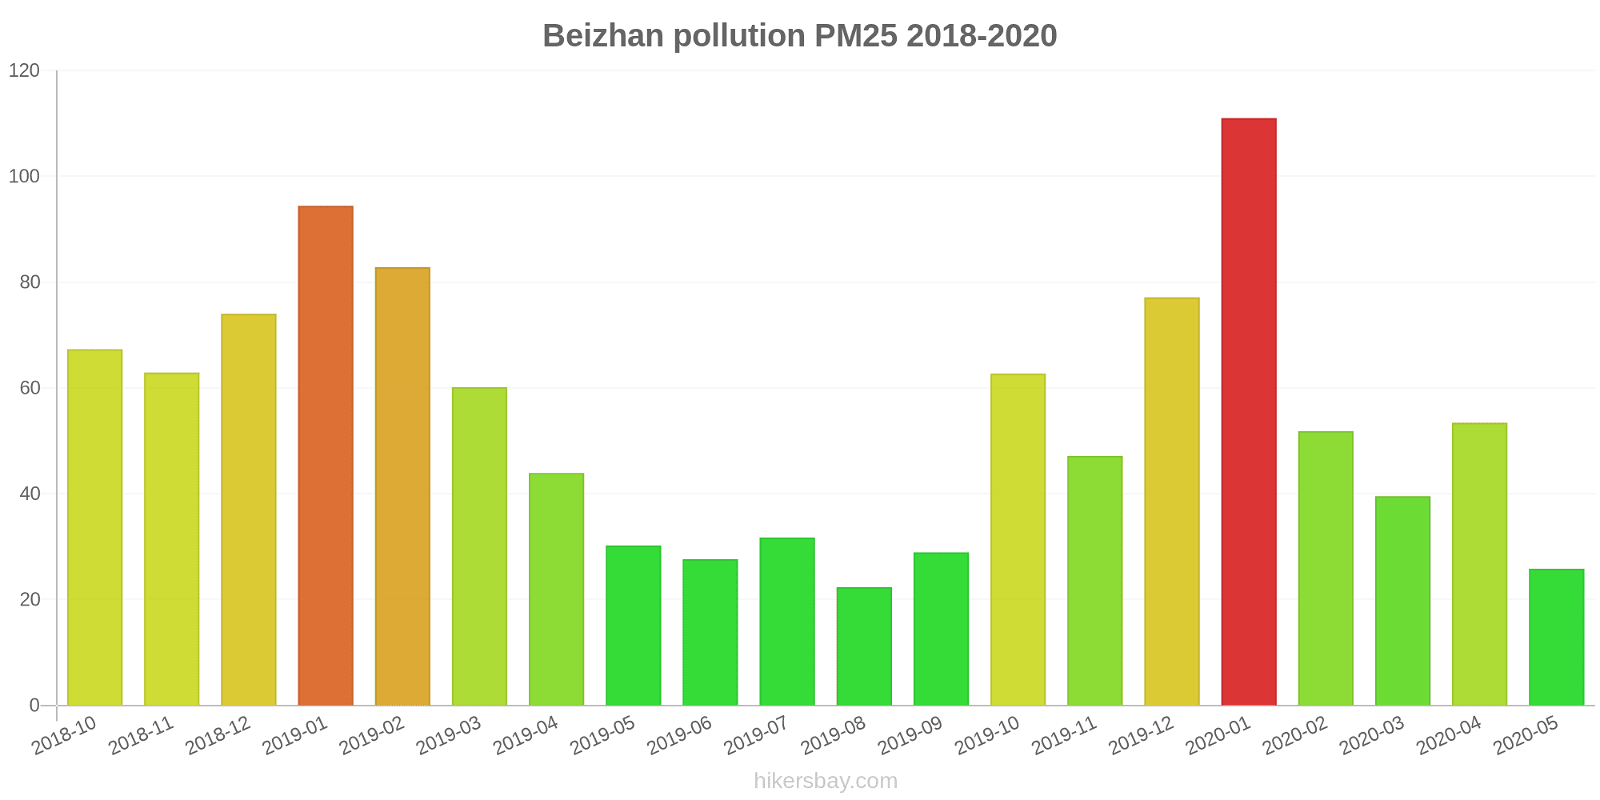
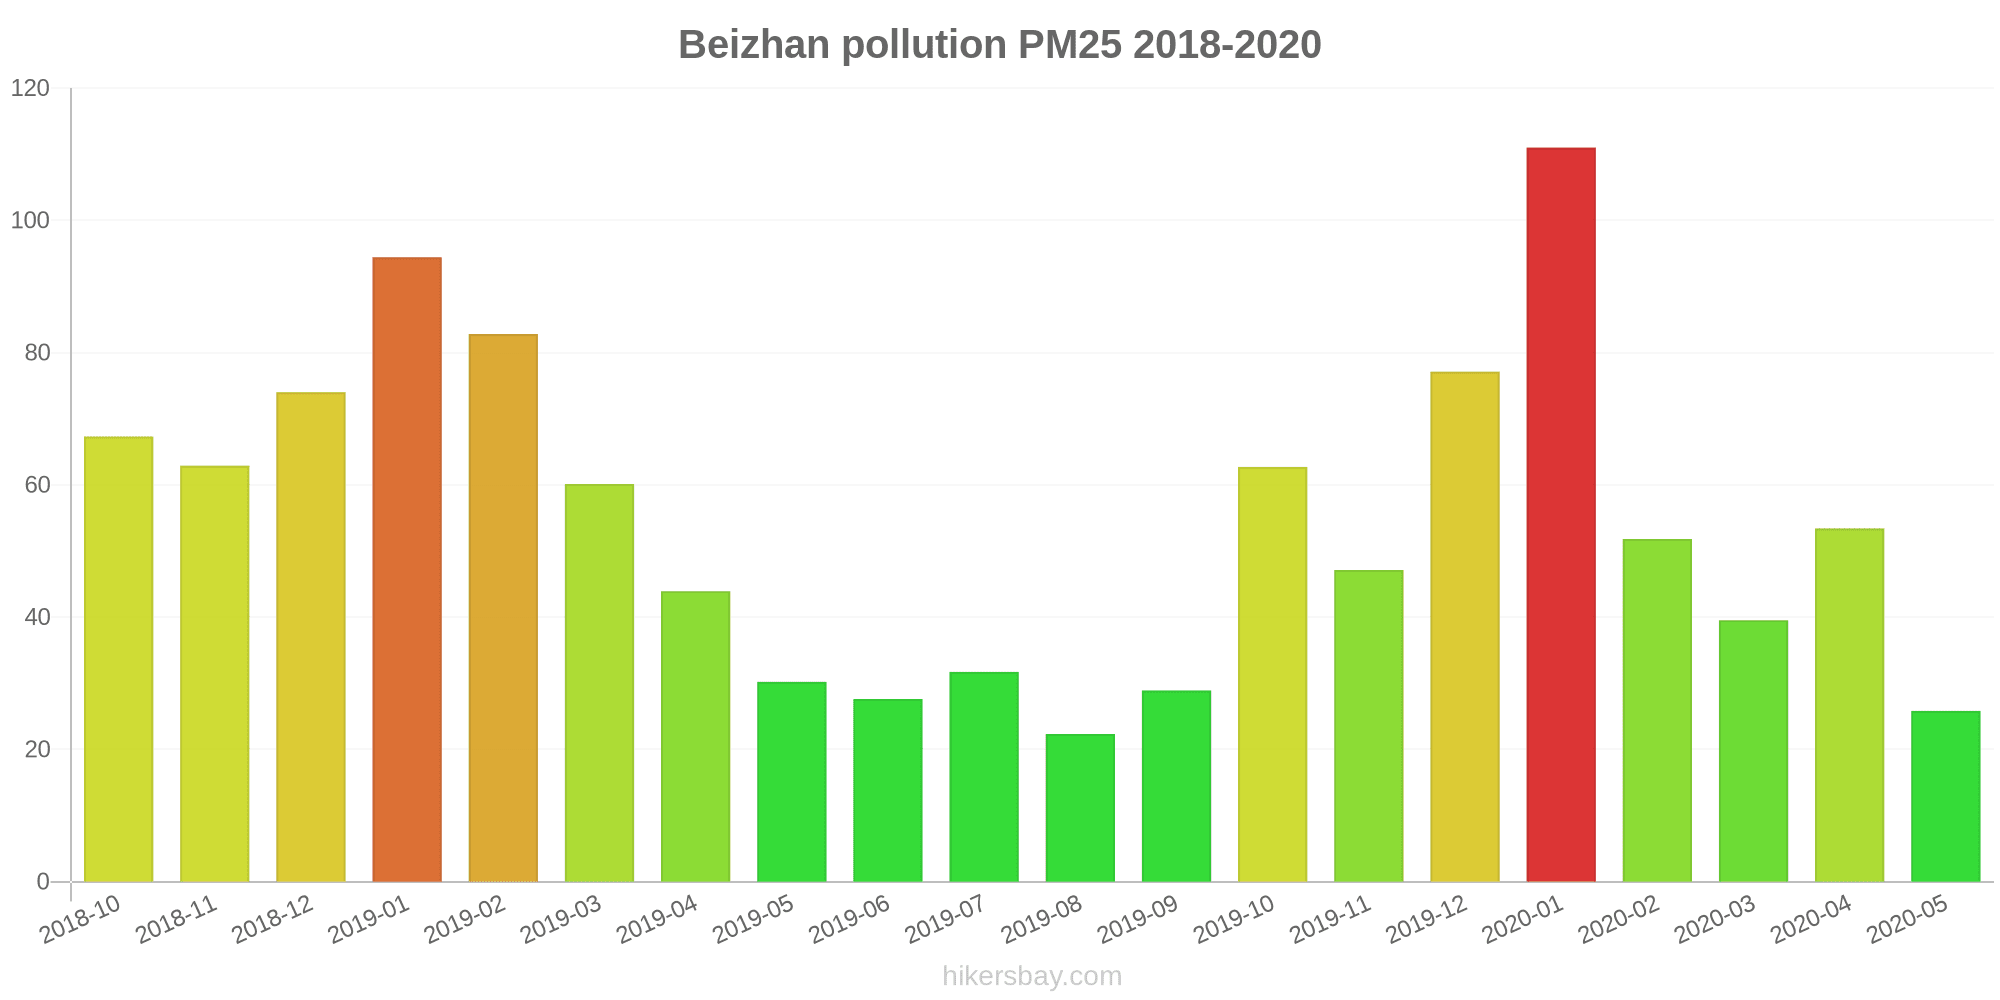
The highest PM2.5 values were recorded: 111 (January 2020).
The lowest level of particulate matter PM2.5 pollution occurs in month: August (22).
How high is the CO level? (carbon monoxide (CO))
100 (Good)
How high is the level of NO2? (nitrogen dioxide (NO2))
8 (Good)
How is the O3 level today in Beizhan? (ozone (O3))
0 (Good)
What is the level of SO2 pollution? (sulfur dioxide (SO2))
9 (Good)
Current data Friday, May 27, 2022, 12:00 PM
PM10 7 (Good)
PM2,5 2 (Good)
CO 100 (Good)
NO2 8 (Good)
O3 0 (Good)
SO2 9 (Good)
Data on air pollution from recent days in Beizhan
index
2022-05-27
pm10
32
Moderate
pm25
24
Moderate
co
468
Good
no2
21
Good
o3
32
Good
so2
5
Good
data source »
Air pollution in Beizhan from October 2018 to May 2020
index
2020-05
2020-04
2020-03
2020-02
2020-01
2019-12
2019-11
2019-10
2019-09
2019-08
2019-07
2019-06
2019-05
2019-04
2019-03
2019-02
2019-01
2018-12
2018-11
2018-10
pm25
26 (Moderate)
53 (Unhealthy for Sensitive Groups)
40 (Unhealthy for Sensitive Groups)
52 (Unhealthy for Sensitive Groups)
111 (Very bad Hazardous)
77 (Very Unhealthy)
47 (Unhealthy for Sensitive Groups)
63 (Unhealthy)
29 (Moderate)
22 (Moderate)
32 (Moderate)
28 (Moderate)
30 (Moderate)
44 (Unhealthy for Sensitive Groups)
60 (Unhealthy)
83 (Very Unhealthy)
94 (Very Unhealthy)
74 (Unhealthy)
63 (Unhealthy)
67 (Unhealthy)
co
593 (Good)
700 (Good)
692 (Good)
877 (Good)
1 (Good)
1 (Good)
790 (Good)
964 (Good)
873 (Good)
841 (Good)
942 (Good)
719 (Good)
662 (Good)
761 (Good)
925 (Good)
1 (Good)
1 (Good)
1 (Good)
925 (Good)
852 (Good)
no2
23 (Good)
32 (Good)
25 (Good)
27 (Good)
49 (Moderate)
43 (Moderate)
33 (Good)
40 (Good)
30 (Good)
19 (Good)
23 (Good)
26 (Good)
28 (Good)
33 (Good)
38 (Good)
39 (Good)
43 (Moderate)
36 (Good)
39 (Good)
39 (Good)
o3
130 (Unhealthy for Sensitive Groups)
130 (Unhealthy for Sensitive Groups)
102 (Moderate)
87 (Moderate)
68 (Good)
60 (Good)
62 (Good)
98 (Moderate)
121 (Unhealthy for Sensitive Groups)
119 (Moderate)
180 (Very Unhealthy)
157 (Unhealthy)
145 (Unhealthy for Sensitive Groups)
117 (Moderate)
110 (Moderate)
84 (Moderate)
60 (Good)
58 (Good)
62 (Good)
76 (Moderate)
pm10
68 (Unhealthy for Sensitive Groups)
99 (Unhealthy)
71 (Unhealthy for Sensitive Groups)
71 (Unhealthy for Sensitive Groups)
141 (Very Unhealthy)
104 (Unhealthy)
78 (Unhealthy for Sensitive Groups)
106 (Unhealthy)
58 (Unhealthy for Sensitive Groups)
38 (Moderate)
54 (Unhealthy for Sensitive Groups)
51 (Unhealthy for Sensitive Groups)
74 (Unhealthy for Sensitive Groups)
106 (Unhealthy)
110 (Very Unhealthy)
128 (Very Unhealthy)
158 (Very bad Hazardous)
118 (Very Unhealthy)
101 (Unhealthy)
101 (Unhealthy)
so2
14 (Good)
16 (Good)
14 (Good)
12 (Good)
27 (Good)
17 (Good)
16 (Good)
14 (Good)
12 (Good)
10 (Good)
15 (Good)
15 (Good)
18 (Good)
15 (Good)
19 (Good)
29 (Good)
24 (Good)
23 (Good)
23 (Good)
18 (Good)
data source »
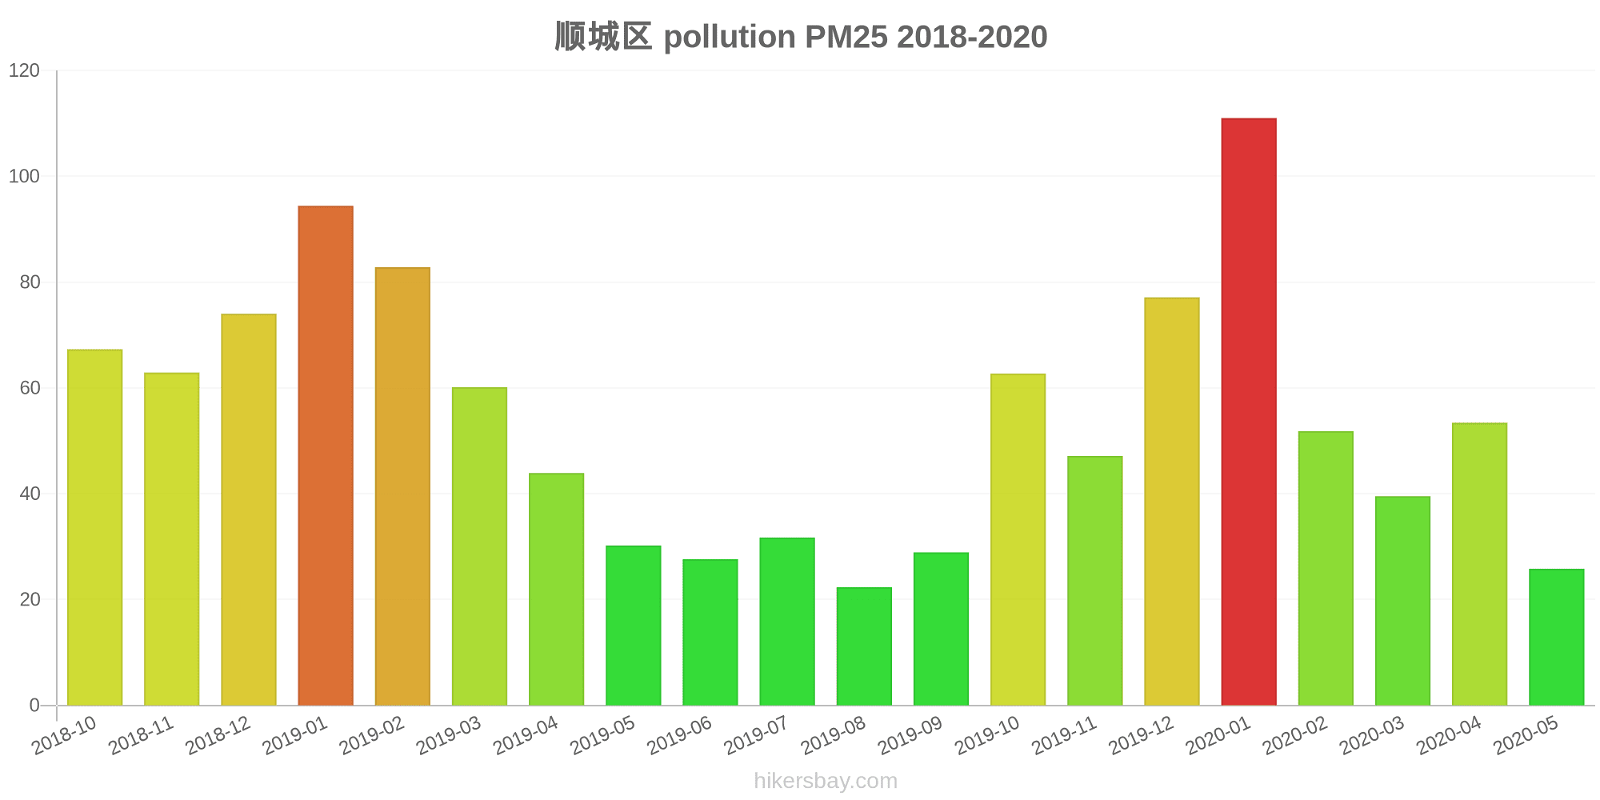
顺城区
Friday, May 27, 2022, 12:00 PM
PM10 6.7 (Good)
particulate matter (PM10) suspended dust
PM2,5 1.7 (Good)
particulate matter (PM2.5) dust
CO 100 (Good)
carbon monoxide (CO)
NO2 7.6 (Good)
nitrogen dioxide (NO2)
O3 0.02 (Good)
ozone (O3)
SO2 8.6 (Good)
sulfur dioxide (SO2)
顺城区
index
2022-05-27
pm10
32
pm25
24
co
468
no2
21
o3
32
so2
4.6
顺城区
2018-10 2020-05
index
2020-05
2020-04
2020-03
2020-02
2020-01
2019-12
2019-11
2019-10
2019-09
2019-08
2019-07
2019-06
2019-05
2019-04
2019-03
2019-02
2019-01
2018-12
2018-11
2018-10
pm25
26
53
40
52
111
77
47
63
29
22
32
28
30
44
60
83
94
74
63
67
co
593
700
692
877
1
1
790
964
873
841
942
719
662
761
925
1
1
1
925
852
no2
23
32
25
27
49
43
33
40
30
19
23
26
28
33
38
39
43
36
39
39
o3
130
130
102
87
68
60
62
98
121
119
180
157
145
117
110
84
60
58
62
76
pm10
68
99
71
71
141
104
78
106
58
38
54
51
74
106
110
128
158
118
101
101
so2
14
16
14
12
27
17
16
14
12
10
15
15
18
15
19
29
24
23
23
18
* Pollution data source:
https://openaq.org
(ChinaAQIData)
The data is licensed under CC-By 4.0
PM10 7 (Good)
PM2,5 2 (Good)
CO 100 (Good)
NO2 8 (Good)
O3 0 (Good)
SO2 9 (Good)
Data on air pollution from recent days in Beizhan
| index | 2022-05-27 |
|---|---|
| pm10 | 32 Moderate |
| pm25 | 24 Moderate |
| co | 468 Good |
| no2 | 21 Good |
| o3 | 32 Good |
| so2 | 5 Good |
| index | 2020-05 | 2020-04 | 2020-03 | 2020-02 | 2020-01 | 2019-12 | 2019-11 | 2019-10 | 2019-09 | 2019-08 | 2019-07 | 2019-06 | 2019-05 | 2019-04 | 2019-03 | 2019-02 | 2019-01 | 2018-12 | 2018-11 | 2018-10 |
|---|---|---|---|---|---|---|---|---|---|---|---|---|---|---|---|---|---|---|---|---|
| pm25 | 26 (Moderate) | 53 (Unhealthy for Sensitive Groups) | 40 (Unhealthy for Sensitive Groups) | 52 (Unhealthy for Sensitive Groups) | 111 (Very bad Hazardous) | 77 (Very Unhealthy) | 47 (Unhealthy for Sensitive Groups) | 63 (Unhealthy) | 29 (Moderate) | 22 (Moderate) | 32 (Moderate) | 28 (Moderate) | 30 (Moderate) | 44 (Unhealthy for Sensitive Groups) | 60 (Unhealthy) | 83 (Very Unhealthy) | 94 (Very Unhealthy) | 74 (Unhealthy) | 63 (Unhealthy) | 67 (Unhealthy) |
| co | 593 (Good) | 700 (Good) | 692 (Good) | 877 (Good) | 1 (Good) | 1 (Good) | 790 (Good) | 964 (Good) | 873 (Good) | 841 (Good) | 942 (Good) | 719 (Good) | 662 (Good) | 761 (Good) | 925 (Good) | 1 (Good) | 1 (Good) | 1 (Good) | 925 (Good) | 852 (Good) |
| no2 | 23 (Good) | 32 (Good) | 25 (Good) | 27 (Good) | 49 (Moderate) | 43 (Moderate) | 33 (Good) | 40 (Good) | 30 (Good) | 19 (Good) | 23 (Good) | 26 (Good) | 28 (Good) | 33 (Good) | 38 (Good) | 39 (Good) | 43 (Moderate) | 36 (Good) | 39 (Good) | 39 (Good) |
| o3 | 130 (Unhealthy for Sensitive Groups) | 130 (Unhealthy for Sensitive Groups) | 102 (Moderate) | 87 (Moderate) | 68 (Good) | 60 (Good) | 62 (Good) | 98 (Moderate) | 121 (Unhealthy for Sensitive Groups) | 119 (Moderate) | 180 (Very Unhealthy) | 157 (Unhealthy) | 145 (Unhealthy for Sensitive Groups) | 117 (Moderate) | 110 (Moderate) | 84 (Moderate) | 60 (Good) | 58 (Good) | 62 (Good) | 76 (Moderate) |
| pm10 | 68 (Unhealthy for Sensitive Groups) | 99 (Unhealthy) | 71 (Unhealthy for Sensitive Groups) | 71 (Unhealthy for Sensitive Groups) | 141 (Very Unhealthy) | 104 (Unhealthy) | 78 (Unhealthy for Sensitive Groups) | 106 (Unhealthy) | 58 (Unhealthy for Sensitive Groups) | 38 (Moderate) | 54 (Unhealthy for Sensitive Groups) | 51 (Unhealthy for Sensitive Groups) | 74 (Unhealthy for Sensitive Groups) | 106 (Unhealthy) | 110 (Very Unhealthy) | 128 (Very Unhealthy) | 158 (Very bad Hazardous) | 118 (Very Unhealthy) | 101 (Unhealthy) | 101 (Unhealthy) |
| so2 | 14 (Good) | 16 (Good) | 14 (Good) | 12 (Good) | 27 (Good) | 17 (Good) | 16 (Good) | 14 (Good) | 12 (Good) | 10 (Good) | 15 (Good) | 15 (Good) | 18 (Good) | 15 (Good) | 19 (Good) | 29 (Good) | 24 (Good) | 23 (Good) | 23 (Good) | 18 (Good) |
PM10 6.7 (Good)
particulate matter (PM10) suspended dustPM2,5 1.7 (Good)
particulate matter (PM2.5) dustCO 100 (Good)
carbon monoxide (CO)NO2 7.6 (Good)
nitrogen dioxide (NO2)O3 0.02 (Good)
ozone (O3)SO2 8.6 (Good)
sulfur dioxide (SO2)顺城区
| index | 2022-05-27 |
|---|---|
| pm10 | 32 |
| pm25 | 24 |
| co | 468 |
| no2 | 21 |
| o3 | 32 |
| so2 | 4.6 |
顺城区

| index | 2020-05 | 2020-04 | 2020-03 | 2020-02 | 2020-01 | 2019-12 | 2019-11 | 2019-10 | 2019-09 | 2019-08 | 2019-07 | 2019-06 | 2019-05 | 2019-04 | 2019-03 | 2019-02 | 2019-01 | 2018-12 | 2018-11 | 2018-10 |
|---|---|---|---|---|---|---|---|---|---|---|---|---|---|---|---|---|---|---|---|---|
| pm25 | 26 | 53 | 40 | 52 | 111 | 77 | 47 | 63 | 29 | 22 | 32 | 28 | 30 | 44 | 60 | 83 | 94 | 74 | 63 | 67 |
| co | 593 | 700 | 692 | 877 | 1 | 1 | 790 | 964 | 873 | 841 | 942 | 719 | 662 | 761 | 925 | 1 | 1 | 1 | 925 | 852 |
| no2 | 23 | 32 | 25 | 27 | 49 | 43 | 33 | 40 | 30 | 19 | 23 | 26 | 28 | 33 | 38 | 39 | 43 | 36 | 39 | 39 |
| o3 | 130 | 130 | 102 | 87 | 68 | 60 | 62 | 98 | 121 | 119 | 180 | 157 | 145 | 117 | 110 | 84 | 60 | 58 | 62 | 76 |
| pm10 | 68 | 99 | 71 | 71 | 141 | 104 | 78 | 106 | 58 | 38 | 54 | 51 | 74 | 106 | 110 | 128 | 158 | 118 | 101 | 101 |
| so2 | 14 | 16 | 14 | 12 | 27 | 17 | 16 | 14 | 12 | 10 | 15 | 15 | 18 | 15 | 19 | 29 | 24 | 23 | 23 | 18 |