Air Pollution in Zhong’ayacun: Real-time Air Quality Index and smog alert.
Pollution and air quality forecast for Zhong’ayacun. Today is Tuesday, June 16, 2026. The following air pollution values have been recorded for Zhong’ayacun:- particulate matter (PM2.5) dust - 22 (Moderate)
- carbon monoxide (CO) - 219 (Good)
- ozone (O3) - 0 (Good)
- nitrogen dioxide (NO2) - 7 (Good)
- particulate matter (PM10) suspended dust - 36 (Moderate)
- sulfur dioxide (SO2) - 8 (Good)

What is the air quality in Zhong’ayacun today? Is the air polluted in Zhong’ayacun?. Is there smog?
What is the current level of PM2.5 in Zhong’ayacun? (particulate matter (PM2.5) dust)
Today's PM2.5 level is:
22 (Moderate)
For comparison, the highest level of PM2.5 in Zhong’ayacun in the last 7 days was: 23 (Friday, May 27, 2022) and the lowest: 23 (Friday, May 27, 2022).
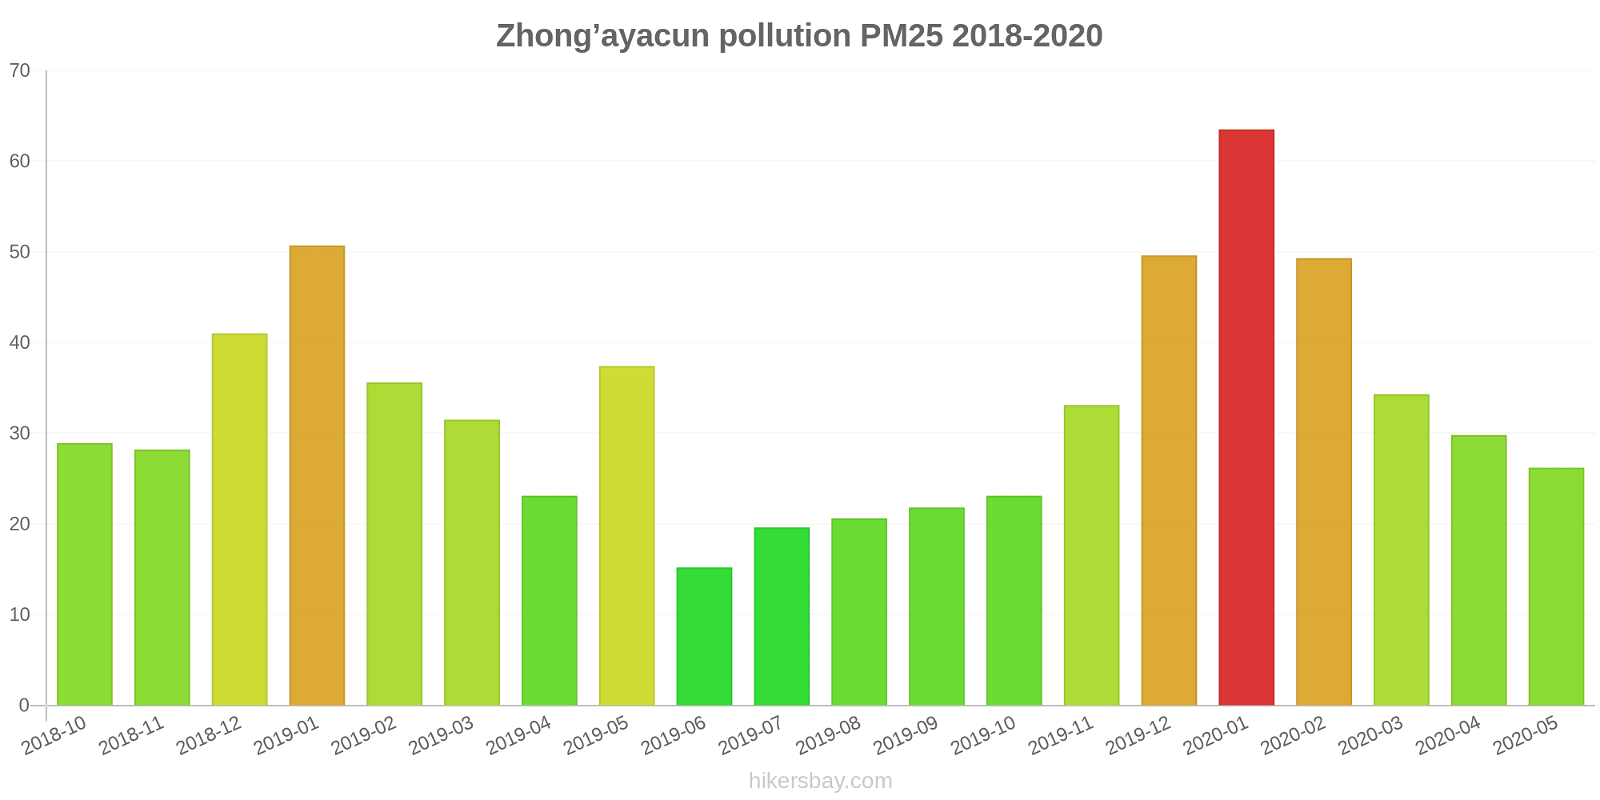
The highest PM2.5 values were recorded: 64 (January 2020).
The lowest level of particulate matter PM2.5 pollution occurs in month: June (15).
How high is the CO level? (carbon monoxide (CO))
219 (Good)
How is the O3 level today in Zhong’ayacun? (ozone (O3))
0 (Good)
How high is the level of NO2? (nitrogen dioxide (NO2))
7 (Good)
What is the level of PM10 today in Zhong’ayacun? (particulate matter (PM10) suspended dust)
The current level of particulate matter PM10 in Zhong’ayacun is:
36 (Moderate)
The highest PM10 values usually occur in month: 151 (March 2019).
The lowest value of particulate matter PM10 pollution in Zhong’ayacun is usually recorded in: June (52).
What is the level of SO2 pollution? (sulfur dioxide (SO2))
8 (Good)
Current data Friday, May 27, 2022, 3:00 PM
PM2,5 22 (Moderate)
CO 219 (Good)
O3 0 (Good)
NO2 7 (Good)
PM10 36 (Moderate)
SO2 8 (Good)
Data on air pollution from recent days in Zhong’ayacun
index
2022-05-27
pm25
23
Moderate
co
475
Good
o3
25
Good
no2
21
Good
pm10
32
Moderate
so2
4
Good
data source »
Air pollution in Zhong’ayacun from October 2018 to May 2020
index
2020-05
2020-04
2020-03
2020-02
2020-01
2019-12
2019-11
2019-10
2019-09
2019-08
2019-07
2019-06
2019-05
2019-04
2019-03
2019-02
2019-01
2018-12
2018-11
2018-10
pm25
26 (Moderate)
30 (Moderate)
34 (Moderate)
49 (Unhealthy for Sensitive Groups)
64 (Unhealthy)
50 (Unhealthy for Sensitive Groups)
33 (Moderate)
23 (Moderate)
22 (Moderate)
21 (Moderate)
20 (Moderate)
15 (Moderate)
37 (Unhealthy for Sensitive Groups)
23 (Moderate)
32 (Moderate)
36 (Unhealthy for Sensitive Groups)
51 (Unhealthy for Sensitive Groups)
41 (Unhealthy for Sensitive Groups)
28 (Moderate)
29 (Moderate)
co
408 (Good)
509 (Good)
562 (Good)
1 (Good)
1 (Good)
1 (Good)
840 (Good)
744 (Good)
623 (Good)
619 (Good)
558 (Good)
431 (Good)
605 (Good)
666 (Good)
1 (Good)
1 (Good)
1 (Good)
1 (Good)
1 (Good)
924 (Good)
no2
16 (Good)
21 (Good)
18 (Good)
14 (Good)
32 (Good)
38 (Good)
36 (Good)
31 (Good)
27 (Good)
22 (Good)
19 (Good)
12 (Good)
18 (Good)
17 (Good)
25 (Good)
19 (Good)
30 (Good)
33 (Good)
10 (Good)
13 (Good)
o3
109 (Moderate)
112 (Moderate)
97 (Moderate)
93 (Moderate)
68 (Good)
68 (Good)
72 (Moderate)
87 (Moderate)
116 (Moderate)
125 (Unhealthy for Sensitive Groups)
129 (Unhealthy for Sensitive Groups)
118 (Moderate)
115 (Moderate)
106 (Moderate)
92 (Moderate)
81 (Moderate)
56 (Good)
48 (Good)
62 (Good)
76 (Moderate)
pm10
115 (Very Unhealthy)
149 (Very Unhealthy)
146 (Very Unhealthy)
122 (Very Unhealthy)
98 (Unhealthy)
106 (Unhealthy)
115 (Very Unhealthy)
82 (Unhealthy)
90 (Unhealthy)
80 (Unhealthy for Sensitive Groups)
70 (Unhealthy for Sensitive Groups)
52 (Unhealthy for Sensitive Groups)
142 (Very Unhealthy)
83 (Unhealthy)
151 (Very bad Hazardous)
123 (Very Unhealthy)
118 (Very Unhealthy)
84 (Unhealthy)
68 (Unhealthy for Sensitive Groups)
96 (Unhealthy)
so2
5.5 (Good)
7.2 (Good)
12 (Good)
16 (Good)
12 (Good)
14 (Good)
14 (Good)
4.5 (Good)
3.9 (Good)
5.1 (Good)
4.3 (Good)
4 (Good)
4.6 (Good)
8.3 (Good)
13 (Good)
11 (Good)
13 (Good)
20 (Good)
13 (Good)
21 (Good)
data source »
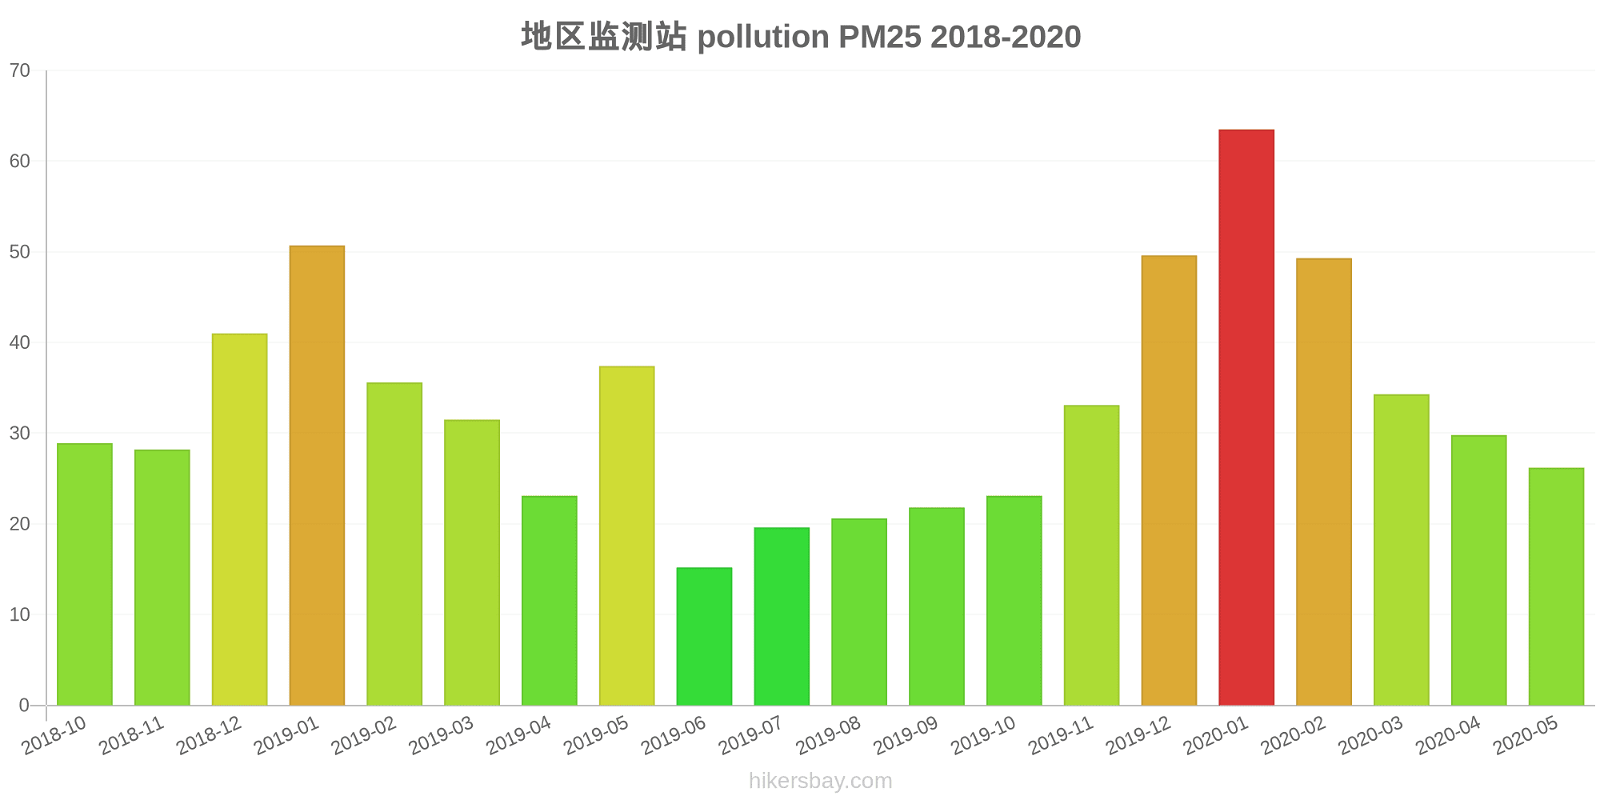
地区监测站
Friday, May 27, 2022, 3:00 PM
PM2,5 22 (Moderate)
particulate matter (PM2.5) dust
CO 219 (Good)
carbon monoxide (CO)
O3 0.05 (Good)
ozone (O3)
NO2 7 (Good)
nitrogen dioxide (NO2)
PM10 36 (Moderate)
particulate matter (PM10) suspended dust
SO2 7.7 (Good)
sulfur dioxide (SO2)
地区监测站
index
2022-05-27
pm25
23
co
475
o3
25
no2
21
pm10
32
so2
4.4
地区监测站
2018-10 2020-05
index
2020-05
2020-04
2020-03
2020-02
2020-01
2019-12
2019-11
2019-10
2019-09
2019-08
2019-07
2019-06
2019-05
2019-04
2019-03
2019-02
2019-01
2018-12
2018-11
2018-10
pm25
26
30
34
49
64
50
33
23
22
21
20
15
37
23
32
36
51
41
28
29
co
408
509
562
1
1
1
840
744
623
619
558
431
605
666
1
1
1
1
1
924
no2
16
21
18
14
32
38
36
31
27
22
19
12
18
17
25
19
30
33
10
13
o3
109
112
97
93
68
68
72
87
116
125
129
118
115
106
92
81
56
48
62
76
pm10
115
149
146
122
98
106
115
82
90
80
70
52
142
83
151
123
118
84
68
96
so2
5.5
7.2
12
16
12
14
14
4.5
3.9
5.1
4.3
4
4.6
8.3
13
11
13
20
13
21
* Pollution data source:
https://openaq.org
(ChinaAQIData)
The data is licensed under CC-By 4.0
PM2,5 22 (Moderate)
CO 219 (Good)
O3 0 (Good)
NO2 7 (Good)
PM10 36 (Moderate)
SO2 8 (Good)
Data on air pollution from recent days in Zhong’ayacun
| index | 2022-05-27 |
|---|---|
| pm25 | 23 Moderate |
| co | 475 Good |
| o3 | 25 Good |
| no2 | 21 Good |
| pm10 | 32 Moderate |
| so2 | 4 Good |

| index | 2020-05 | 2020-04 | 2020-03 | 2020-02 | 2020-01 | 2019-12 | 2019-11 | 2019-10 | 2019-09 | 2019-08 | 2019-07 | 2019-06 | 2019-05 | 2019-04 | 2019-03 | 2019-02 | 2019-01 | 2018-12 | 2018-11 | 2018-10 |
|---|---|---|---|---|---|---|---|---|---|---|---|---|---|---|---|---|---|---|---|---|
| pm25 | 26 (Moderate) | 30 (Moderate) | 34 (Moderate) | 49 (Unhealthy for Sensitive Groups) | 64 (Unhealthy) | 50 (Unhealthy for Sensitive Groups) | 33 (Moderate) | 23 (Moderate) | 22 (Moderate) | 21 (Moderate) | 20 (Moderate) | 15 (Moderate) | 37 (Unhealthy for Sensitive Groups) | 23 (Moderate) | 32 (Moderate) | 36 (Unhealthy for Sensitive Groups) | 51 (Unhealthy for Sensitive Groups) | 41 (Unhealthy for Sensitive Groups) | 28 (Moderate) | 29 (Moderate) |
| co | 408 (Good) | 509 (Good) | 562 (Good) | 1 (Good) | 1 (Good) | 1 (Good) | 840 (Good) | 744 (Good) | 623 (Good) | 619 (Good) | 558 (Good) | 431 (Good) | 605 (Good) | 666 (Good) | 1 (Good) | 1 (Good) | 1 (Good) | 1 (Good) | 1 (Good) | 924 (Good) |
| no2 | 16 (Good) | 21 (Good) | 18 (Good) | 14 (Good) | 32 (Good) | 38 (Good) | 36 (Good) | 31 (Good) | 27 (Good) | 22 (Good) | 19 (Good) | 12 (Good) | 18 (Good) | 17 (Good) | 25 (Good) | 19 (Good) | 30 (Good) | 33 (Good) | 10 (Good) | 13 (Good) |
| o3 | 109 (Moderate) | 112 (Moderate) | 97 (Moderate) | 93 (Moderate) | 68 (Good) | 68 (Good) | 72 (Moderate) | 87 (Moderate) | 116 (Moderate) | 125 (Unhealthy for Sensitive Groups) | 129 (Unhealthy for Sensitive Groups) | 118 (Moderate) | 115 (Moderate) | 106 (Moderate) | 92 (Moderate) | 81 (Moderate) | 56 (Good) | 48 (Good) | 62 (Good) | 76 (Moderate) |
| pm10 | 115 (Very Unhealthy) | 149 (Very Unhealthy) | 146 (Very Unhealthy) | 122 (Very Unhealthy) | 98 (Unhealthy) | 106 (Unhealthy) | 115 (Very Unhealthy) | 82 (Unhealthy) | 90 (Unhealthy) | 80 (Unhealthy for Sensitive Groups) | 70 (Unhealthy for Sensitive Groups) | 52 (Unhealthy for Sensitive Groups) | 142 (Very Unhealthy) | 83 (Unhealthy) | 151 (Very bad Hazardous) | 123 (Very Unhealthy) | 118 (Very Unhealthy) | 84 (Unhealthy) | 68 (Unhealthy for Sensitive Groups) | 96 (Unhealthy) |
| so2 | 5.5 (Good) | 7.2 (Good) | 12 (Good) | 16 (Good) | 12 (Good) | 14 (Good) | 14 (Good) | 4.5 (Good) | 3.9 (Good) | 5.1 (Good) | 4.3 (Good) | 4 (Good) | 4.6 (Good) | 8.3 (Good) | 13 (Good) | 11 (Good) | 13 (Good) | 20 (Good) | 13 (Good) | 21 (Good) |
PM2,5 22 (Moderate)
particulate matter (PM2.5) dustCO 219 (Good)
carbon monoxide (CO)O3 0.05 (Good)
ozone (O3)NO2 7 (Good)
nitrogen dioxide (NO2)PM10 36 (Moderate)
particulate matter (PM10) suspended dustSO2 7.7 (Good)
sulfur dioxide (SO2)地区监测站
| index | 2022-05-27 |
|---|---|
| pm25 | 23 |
| co | 475 |
| o3 | 25 |
| no2 | 21 |
| pm10 | 32 |
| so2 | 4.4 |
地区监测站

| index | 2020-05 | 2020-04 | 2020-03 | 2020-02 | 2020-01 | 2019-12 | 2019-11 | 2019-10 | 2019-09 | 2019-08 | 2019-07 | 2019-06 | 2019-05 | 2019-04 | 2019-03 | 2019-02 | 2019-01 | 2018-12 | 2018-11 | 2018-10 |
|---|---|---|---|---|---|---|---|---|---|---|---|---|---|---|---|---|---|---|---|---|
| pm25 | 26 | 30 | 34 | 49 | 64 | 50 | 33 | 23 | 22 | 21 | 20 | 15 | 37 | 23 | 32 | 36 | 51 | 41 | 28 | 29 |
| co | 408 | 509 | 562 | 1 | 1 | 1 | 840 | 744 | 623 | 619 | 558 | 431 | 605 | 666 | 1 | 1 | 1 | 1 | 1 | 924 |
| no2 | 16 | 21 | 18 | 14 | 32 | 38 | 36 | 31 | 27 | 22 | 19 | 12 | 18 | 17 | 25 | 19 | 30 | 33 | 10 | 13 |
| o3 | 109 | 112 | 97 | 93 | 68 | 68 | 72 | 87 | 116 | 125 | 129 | 118 | 115 | 106 | 92 | 81 | 56 | 48 | 62 | 76 |
| pm10 | 115 | 149 | 146 | 122 | 98 | 106 | 115 | 82 | 90 | 80 | 70 | 52 | 142 | 83 | 151 | 123 | 118 | 84 | 68 | 96 |
| so2 | 5.5 | 7.2 | 12 | 16 | 12 | 14 | 14 | 4.5 | 3.9 | 5.1 | 4.3 | 4 | 4.6 | 8.3 | 13 | 11 | 13 | 20 | 13 | 21 |